This article can appear as a particularly impressive and unexpected one. You will understand how we can implement a machine learning algorithm on the pixel intensity value with a common K-means clustering algorithm.
In this method, we would generate a compressed variant of our picture with more scattered colours. The image will be processed in a lower intensity resolution, whereas the fraction of pixels will prevail. This procedure is very interesting, so I expect that you will like it.
What is Colour Quantization?
Colour quantization is the method of lessening the abundance of different colours applied in an image. We may be required to produce this sort of compression to render an image in media supporting only a restricted number of shades (ordinarily due to memory restraints).
Certainly, all compressions come with a price. In this example, the resulting picture may deviate too much from the primary one. Therefore, the colour quantization aims to achieve a compressed copy comparable to the real one. The essential constituent for accomplishing this is choosing the colour palette by picking the colours that compile the initial image.
The most popular procedures overcome the obstacle of colour quantization into a clustering problem of features where each feature describes the colour of a pixel. It consists of building the palette by picking a characteristic topic for all clusters. Following that, the compression remaps all the values into their cluster representative. As you may imagine, the resulting palette deeply depends on the colour spectrum and distance metric applied.
Colour Spaces and Colour Contrast
A colour can be rendered as a feature in an n-dimensional area named colour space. The space is generally 3-dimensional, and the coordinates in that area can be utilized to encode a colour value.
There are various colour spaces for varying objectives and with diverse ranges (spectrum of colours). In all of them, it is permissible to set a distance metric that quantifies the colour contrast. The most popular and straightforward distance metric employed is the Euclidean distance practised in RGB and Lab colour ranges.
What is the K-Means algorithm?
K-Means is an unsupervised algorithm from the machine learning approach. This algorithm tries to make clusters of input data features and is one of the several simple and spontaneous clustering algorithms, amongst various others.
The input data objects need to be allocated to separate clusters based on the relationship among them. The simplest technique to estimate the association among various things/data points determines the distance separating them. The most regularly accepted standard of space separating two points is the Euclidean distance measure.
The Implementation
Now we can write our code. We aim to diminish the abundance of tones in the initial image by applying the K-means clustering algorithm for illustrating results with a restricted representation of colours. We will produce colour quantization practising a few distinct values for K.
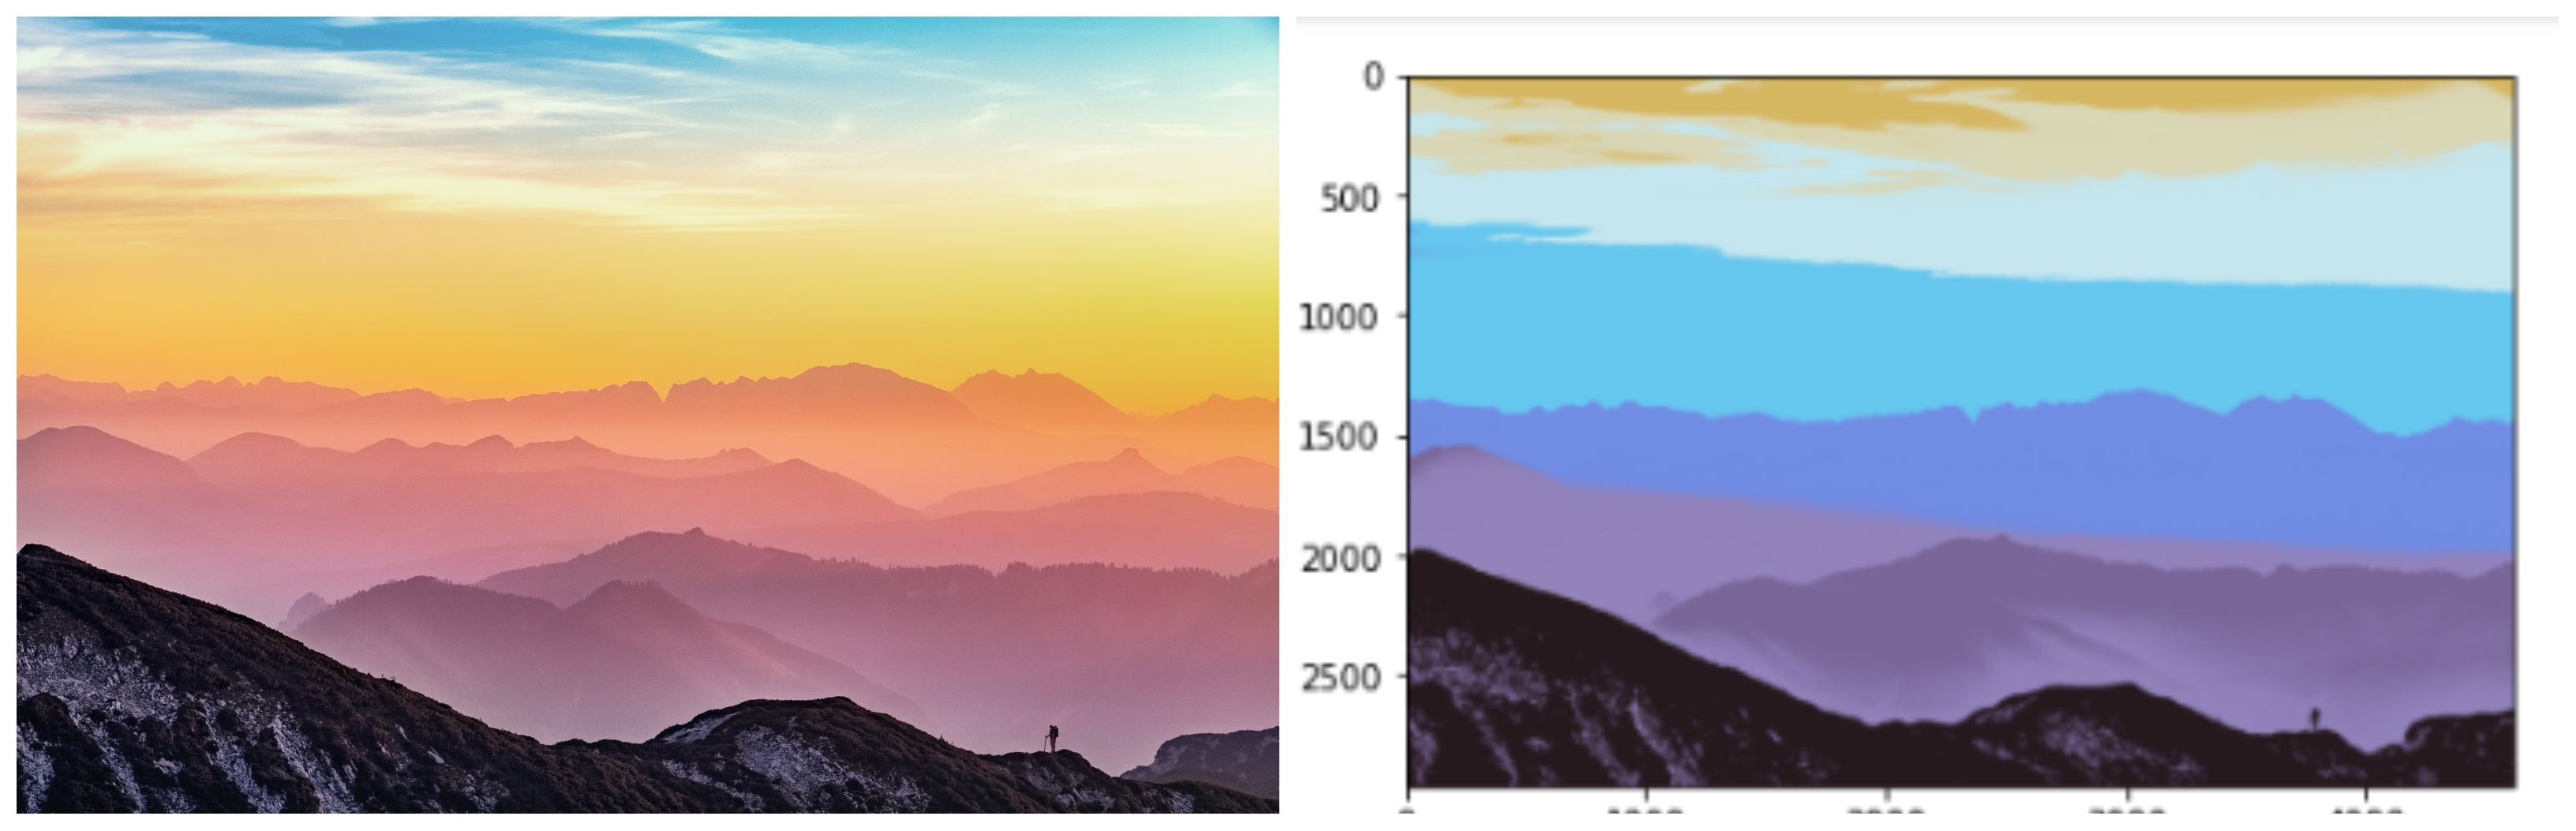
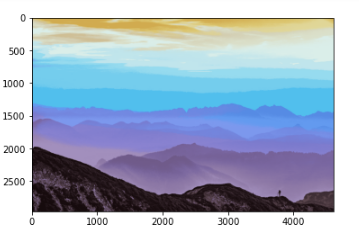
Here is the input image we are using for today.

Source: Simon Berger
Steps In Image Quantization:
- In the beginning step, we shall attempt to determine the number of clusters for our picture. Here several numbers basically describe the number of colours we desire to display our idea with. In our case, we would examine how the results change with a k value between 5 and 50 colours.
- After determining the number of colours, it is time to determine the cluster’s centroids, which would be the groups’ colour representative. For instance, for 3 colors let C1= (140,120,160) ,C2= (115,170,120) ,C3= (162,142,181) be the 3 cluster centers.
- In the following step, we shall measure the distance of all points of the cluster centroids. And based on the range, we shall appoint every moment to the focus with the least distance. To estimate the distance, we need to study the Euclidean distance. We would proceed with this step until the maximum number of repetitions is executed or the centroid of clusters doesn’t change.
import cv2
import numpy as np
import matplotlib.pyplot as plt
def quantimage(image,k):
    i = np.float32(image).reshape(-1,3)
    condition = (cv2.TERM_CRITERIA_EPS + cv2.TERM_CRITERIA_MAX_ITER,20,1.0)
    ret,label,center = cv2.kmeans(i, k , None, condition,10,cv2.KMEANS_RANDOM_CENTERS)
    center = np.uint8(center)
    final_img = center[label.flatten()]
    final_img = final_img.reshape(image.shape)
    return final_img
image = cv2.imread('a.png')
plt.imshow(quantimage(image,5))
plt.show()
plt.imshow(quantimage(image,8))
plt.show()
plt.imshow(quantimage(image,25))
plt.show()
plt.imshow(quantimage(image,35))
plt.show()
plt.imshow(quantimage(image,45))
plt.show()
-
Initially, we would read the input picture and convert it into a 3d array: the picture’s B, G, and R-value. Next, we have initialized the K-means clustering algorithm employing OpenCV. We also initialize the termination rule where it states if the number of repetitions is 20 or if every cluster centroid shifts inside a euclidean of 1, we shall terminate the execution.
-
Following, we are saving the label array and the centre matrix. The label array reserves the label value for all points, whereas the centre matrix holds the centroid of all clusters. In the next line, we have substituted the pixel values with their centroid values and return the final result.
Now we can look at our results.
Output:
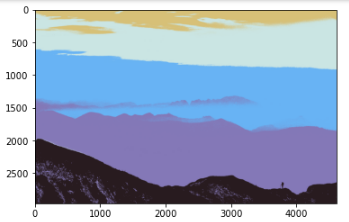
- k=5
-
-
-
-
-
-
-
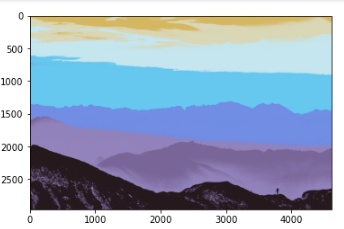
- k=8
-
-
-
-
-
-
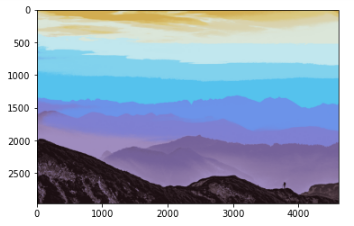
* k=25
-
-
-
-
-
-
-
-
- k=35
-
-
-
-
-
-
-
* k=45
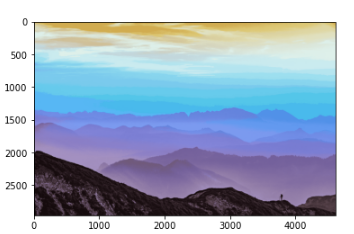
Here we can observe as the estimation of K value rises, the image matures more realistic. Astonishing, right? The second case(k=8) is apparently the most charming.
We succeeded in diminishing the abundance of colours to just 3 while maintaining the overall appearance feature. Nevertheless, by getting a more familiar look at every couple of pictures, in some instances, it is likely to remark on some features that make us state that one is much more appealing than the others.
Overall, the mountains appear clearer and extra specified for this second image (k=8) when applying RGB, which can be noticed particularly in the initial two images.
Summary
In this blog post, you discovered how to implement colour quantization using OpenCV and k-means clustering. While colour quantization does not flawlessly impersonate the cartoon effect, it does illustrate that by lessening the number of colours in a picture, you can give a more posterized, animated touch to the image. Of course, colour quantization has more functional applications than simply visual attractiveness.
Colour quantization is generally applied in methods where memory is restricted or when confining is needed. Some people find that colour quantization is suitably utilized when developing CBIR systems. In case, QBIC, one of the fundamental image search engines, proved that by practising quantized colour histograms and the quadratic distance, picture search engines were reasonable.
Thanks for Browsing my Article. Kindly comment and don’t forget to share this blog as it will motivate me to deliver more quality blogs on ML & DL-related topics. Thank you so much for your help, cooperation, and support!
About Author
Mrinal Walia is a professional Python Developer with a computer science background specializing in Machine Learning, Artificial Intelligence and Computer Vision. In addition to this, Mrinal is an interactive blogger, author, and geek with over four years of experience in his work. With a background working through most areas of computer science, Mrinal currently works as a Testing and Automation Engineer at Versa Networks, India. My aim to reach my creative goals one step at a time, and I believe in doing everything with a smile.
Medium | LinkedIn | ModularML | DevCommunity | Github
Data Scientist and a Technical Writer! I will give you the best of Open-Source and AI.
Talks about #chatgpt, #opensource, #contentcreation, #communitybuilding, and #artificialintelligence
Technical Writer | Data Science, ML, AI, Open-Source | Do More with Data - Litmus


