This article was published as a part of the Data Science Blogathon.
Table of Contents
Introduction
Working with Dataset
Visualizations
Results after Analysis
Measures to be taken to reduce Terrorism
End-Note
Introduction

In this article, we are going to perform Exploratory Data Analysis on terrorism dataset to find out the hot zone of terrorism. Exploratory data analysis is nothing but analyzing the given data and finding the trends, patterns and making some assumptions. In this dataset, there are many features including countries, states, regions, gang names, weapon types, target types, years, months, days, and many more features.
For the Global Terrorism dataset, check this link and download it. https://bit.ly/2TK5Xn5

Working with Dataset
Let’s start by importing some required libraries.
import numpy as np
import pandas as pd
import matplotlib.pyplot as plt
import seaborn as sns
import warnings
warnings.filterwarnings("ignore")
Both matplotlib and seaborn are very popular libraries that are used for visualizations. Import warnings and set it to ignore to just ignore all the warnings.
Now import the dataset using read_csv.
#import terrorism dataset
terrorism_df=pd.read_csv(r'C:UsersAdminDownloadsglobalterrorismdb_0718dist.csv')
View the dataset.
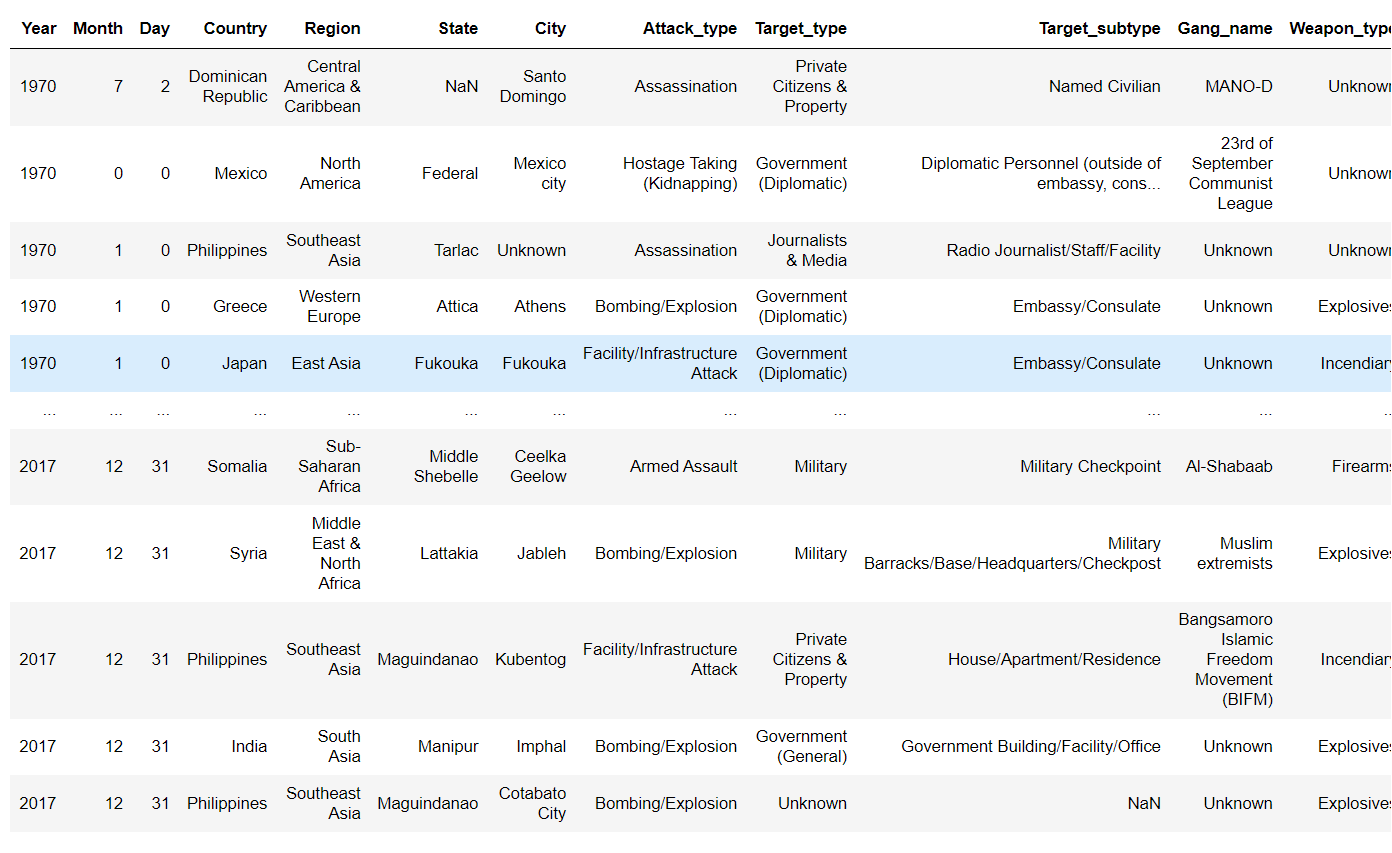
terrorism_df
Now view the shape.
print("There are {} rows and {} columns in the dataset".format(terrorism_df.shape[0],terrorism_df.shape[1]))
There are 181691 rows and 12 columns in the dataset
Now view all the columns in the data frame.
terrorism_df.columns
Index([‘eventid’, ‘iyear’, ‘imonth’, ‘iday’, ‘approxdate’, ‘extended’,
‘resolution’, ‘country’, ‘country_txt’, ‘region’,
…
‘addnotes’, ‘scite1’, ‘scite2’, ‘scite3’, ‘dbsource’, ‘INT_LOG’,
‘INT_IDEO’, ‘INT_MISC’, ‘INT_ANY’, ‘related’],
dtype=’object’, length=135)
View the total number of unique columns in the dataset.
No_of_cols=terrorism_df.columns.nunique()
print("There are total %d columns in the data"%No_of_cols)
There are a total of 135 columns in the data
Rename some columns which we are going to use for analysis.
#let's rename some important columns
terrorism_df=terrorism_df.rename(columns={'iyear':'Year','imonth':'Month','iday':'Day','country_txt':'Country','region_txt':'Region',
                             'provstate':'State','city':'City','attacktype1_txt':'Attack_type','targtype1_txt':'Target_type',
                             'targsubtype1_txt':'Target_subtype','gname':'Gang_name','weaptype1_txt':'Weapon_type'})
Check if the column names were updated.
#Columns names were updated in this data frame
terrorism_df
Now take only those columns which are required for analysis in the dataset.
terrorism_df=terrorism_df[['Year','Month','Day','Country','Region','State','City','Attack_type','Target_type','Target_subtype','Gang_name','Weapon_type']]
Check if it’s updated.
#our new dataframe
terrorism_df
Now make some changes that are required for the dataset.
Fill NaN values in Target_subtype column as Others
terrorism_df['Target_subtype'] = terrorism_df['Target_subtype'].fillna('others')
Fill NaN values in the State column as Unknown
terrorism_df['State']=terrorism_df['State'].fillna('Unknown')
Fill NaN values in the city column as Unknown
terrorism_df['City']=terrorism_df['City'].fillna('Unknown')
To make it simpler replace it with Vehicle
terrorism_df.replace( {"Vehicle (not to include vehicle-borne explosives, i.e., car or truck bombs)": "Vehicle"},inplace = True)
This is our final updated data frame.
terrorism_df
Now view the shape.
terrorism_df.shape
(181691, 12)
Now there are only 12 columns and 181691 rows.
Check for null values.
terrorism_df.isnull().sum()
Year              0
Month             0
Day               0
Country           0
Region            0
State             0
City              0
Attack_type       0
Target_type       0
Target_subtype    0
Gang_name         0
Weapon_type       0
dtype: int64
There are no null values over the entire data.
View top 10 rows of data.
terrorism_df.head(10)
View unique column names.
terrorism_df.columns.unique()
Index([‘Year’, ‘Month’, ‘Day’, ‘Country’, ‘Region’, ‘State’, ‘City’,
‘Attack_type’, ‘Target_type’, ‘Target_subtype’, ‘Gang_name’,
‘Weapon_type’],
dtype=’object’)
Number of columns in the dataset.
terrorism_df.columns.nunique()
13
Total_countries=terrorism_df['Country'].nunique()
print("Total %d countries were noted in the data"%Total_countries)
Total 205 countries were noted in the data
print(terrorism_df['Region'].unique())
['Central America & Caribbean' 'North America' 'Southeast Asia'
 'Western Europe' 'East Asia' 'South America' 'Eastern Europe'
 'Saharan Africa' 'Middle East and North Africa' 'Australasia & Oceania'
 'South Asia' 'Central Asia']
print(terrorism_df[‘Region’].nunique())
12
print(terrorism_df['Attack_type'].unique())
['Assassination' 'Hostage Taking (Kidnapping)' 'Bombing/Explosion'
 'Facility/Infrastructure Attack' 'Armed Assault' 'Hijacking' 'Unknown'
 'Unarmed Assault' 'Hostage Taking (Barricade Incident)']
print(terrorism_df['Target_type'].unique())
['Private Citizens & Property' 'Government (Diplomatic)'
 'Journalists & Media' 'Police' 'Utilities' 'Military'
 'Government (General)' 'Airports & Aircraft' 'Business'
 'Educational Institution' 'Violent Political Party'
 'Religious Figures/Institutions' 'Unknown' 'Transportation' 'Tourists'
 'NGO' 'Telecommunication' 'Food or Water Supply'
 'Terrorists/Non-State Militia' 'Other' 'Maritime' 'Abortion Related']
print(terrorism_df['Gang_name'].unique())
['MANO-D' '23rd of September Communist League' 'Unknown' ...
 'Fatoni Warriors' 'Minorities of Metropolitan Attacks'
 'Baloch Republican Party']
print(terrorism_df['Gang_name'].nunique())
3537
There was a total of 3537 gangs in this dataset.
print(terrorism_df['Weapon_type'].unique())
['Unknown' 'Explosives' 'Incendiary' 'Firearms' 'Chemical' 'Melee'
 'Sabotage Equipment' 'Vehicle' 'Fake Weapons' 'Radiological' 'Other'
 'Biological']
View info.
terrorism_df.info()
RangeIndex: 181691 entries, 0 to 181690
Data columns (total 12 columns):
 #   Column          Non-Null Count   Dtype
---  ------          --------------   -----
 0   Year            181691 non-null  int64
 1   Month           181691 non-null  int64
 2   Day             181691 non-null  int64
 3   Country         181691 non-null  object
 4   Region          181691 non-null  object
 5   State           181691 non-null  object
 6   City            181691 non-null  object
 7   Attack_type     181691 non-null  object
 8   Target_type     181691 non-null  object
 9   Target_subtype  181691 non-null  object
 10  Gang_name       181691 non-null  object
 11  Weapon_type     181691 non-null  object
dtypes: int64(3), object(9)
memory usage: 16.6+ MB
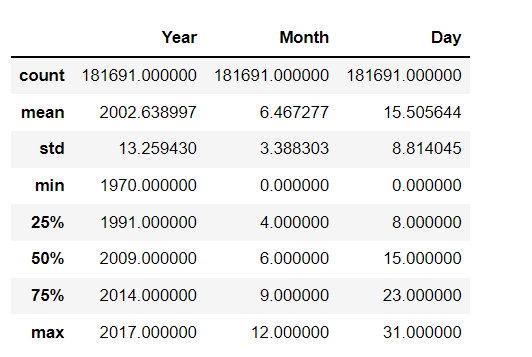
View the statistical description of the dataset.
terrorism_df.describe()
View top 10 countries.
terrorism_df['Country'].value_counts().head(10)
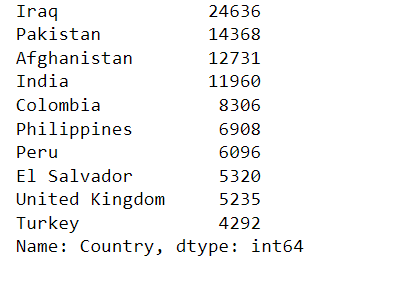
These were the top 10 affected countries.
terrorism_df['Region'].value_counts().head(10)
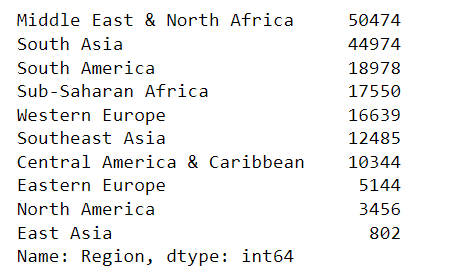
These were the top 10 affected regions.
terrorism_df['State'].value_counts().head(10)
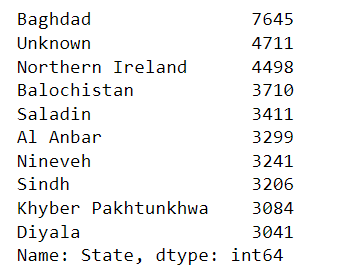
These were the top 10 affected states.
terrorism_df['Target_subtype'].value_counts().head(10)
Unnamed Civilian/Unspecified                               11596
Police Security Forces/Officers                            11178
others                                                     10373
Military Unit/Patrol/Convoy                                 8277
Military Personnel (soldiers, troops, officers, forces)     7963
Government Personnel (excluding police, military)           6610
Village/City/Town/Suburb                                    6542
Politician or Political Party Movement/Meeting/Rally        6306
Police Building (headquarters, station, school)             5907
Military Barracks/Base/Headquarters/Checkpost               5211
Name: Target_subtype, dtype: int64
terrorism_df['City'].value_counts().head(10)
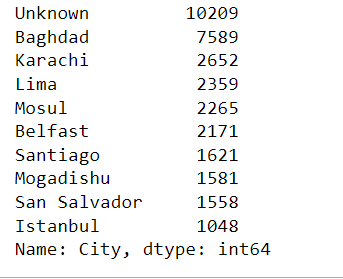
These were the top 10 affected cities.
terrorism_df['Attack_type'].value_counts().head(10)
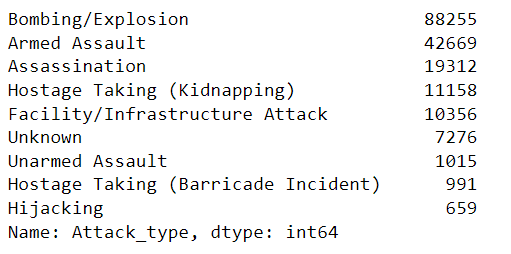
These were the top 10 chosen attacking modes.
terrorism_df['Target_type'].value_counts().head(10)
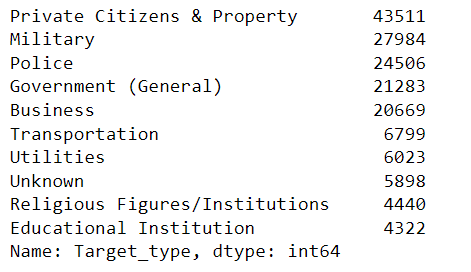
These were the top 10 targets to attack.
terrorism_df['Gang_name'].value_counts().head(10)
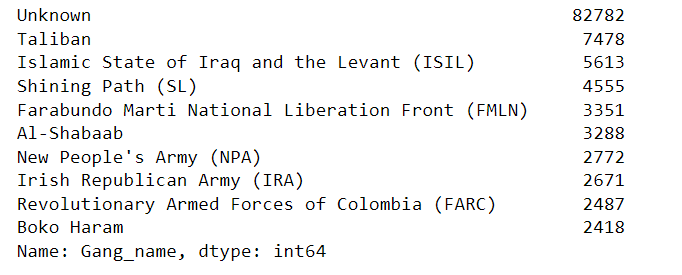
These were the most dangerous and leading top 10 gangs.
terrorism_df['Weapon_type'].value_counts().head(5)
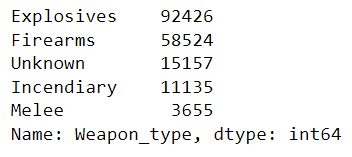
These are the most chosen weapons for attacks.
Visualizations
Now let us find some hot zones using visualizations. For this, we have to use matplotlib and seaborn which we have installed at the beginning.
plt.figure(figsize=(20,5));
sns.countplot(x=terrorism_df.Weapon_type);
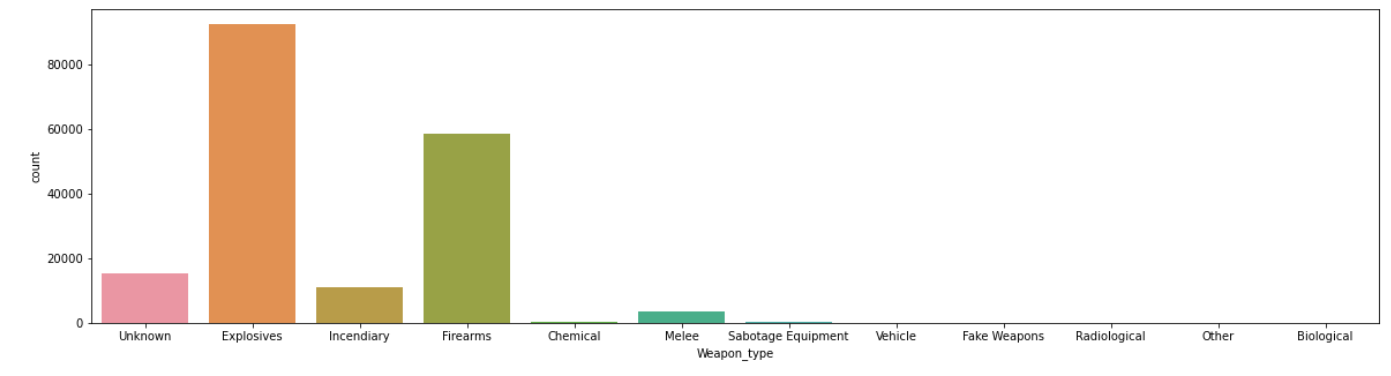
Most of the attacks were attacked through explosives and then through firearms.
plt.figure(figsize=(20,5));
plt.xticks(rotation = 90)
plt.title('Attacks by Year')
sns.countplot(x=terrorism_df.Year);
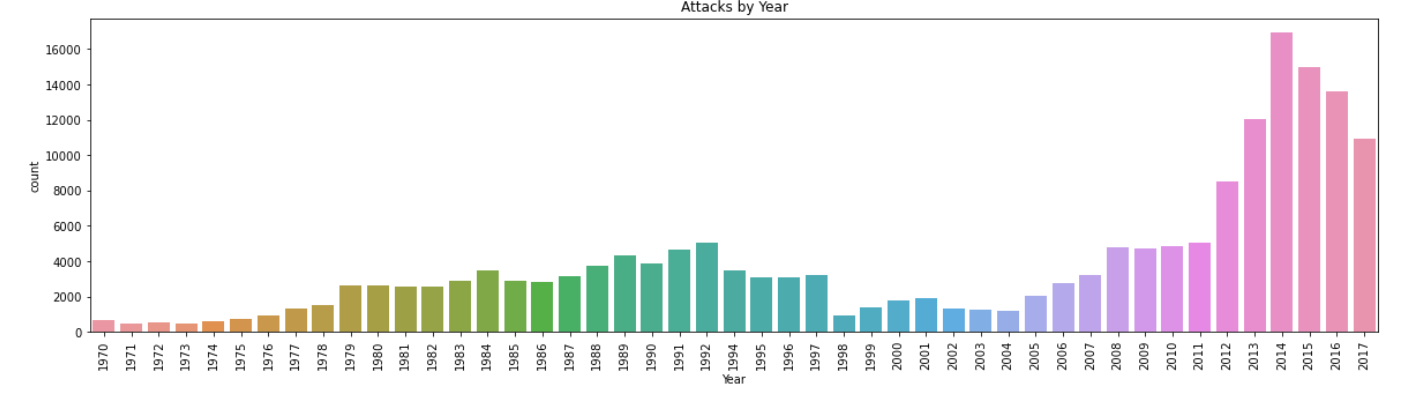
Attacks were more during 2014 and then in 2015. When compared to attacks from 1970 onwards, the last 6 years scored a maximum. But from 2014 onwards count started decreasing.
plt.figure(figsize=(20,5));
plt.title('Attacks by Month')
sns.countplot(x=terrorism_df.Month);
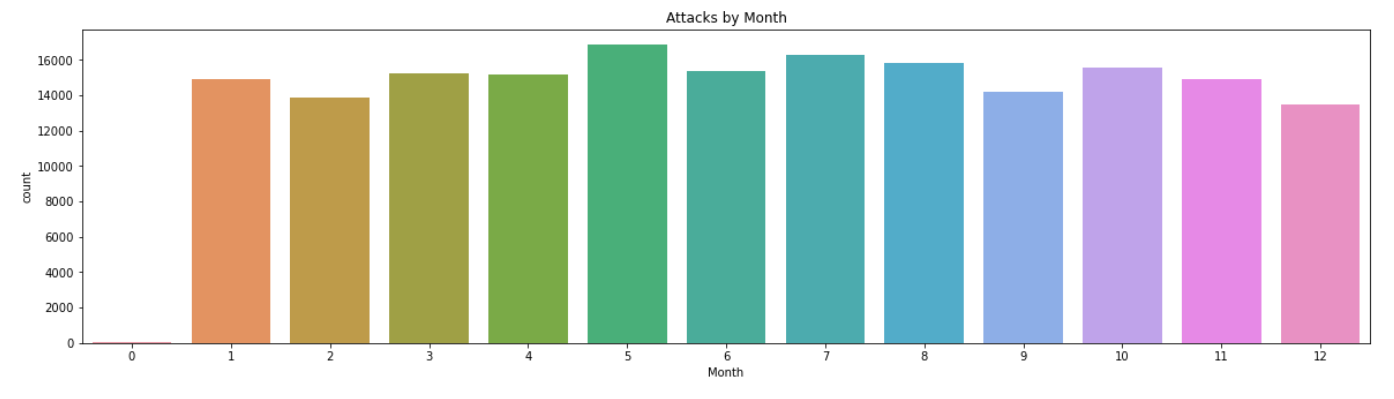
Almost every month has the same contribution.
plt.figure(figsize=(20,5));
plt.title('Attacks by Day')
sns.countplot(x=terrorism_df.Day);
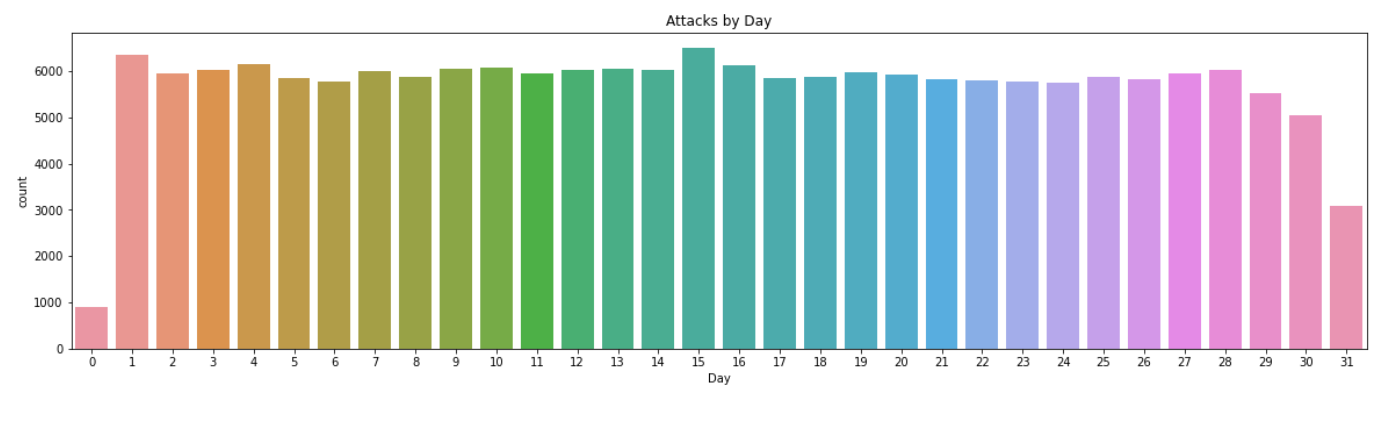
Almost Every day has the same contribution but attacks were low during 31st and high during 15th and 1st.
plt.figure(figsize=(30,5));
plt.rcParams.update({'font.size':8});
plt.xticks(rotation = 90)
plt.title('Attacks by Country')
sns.countplot(x=terrorism_df.Country);
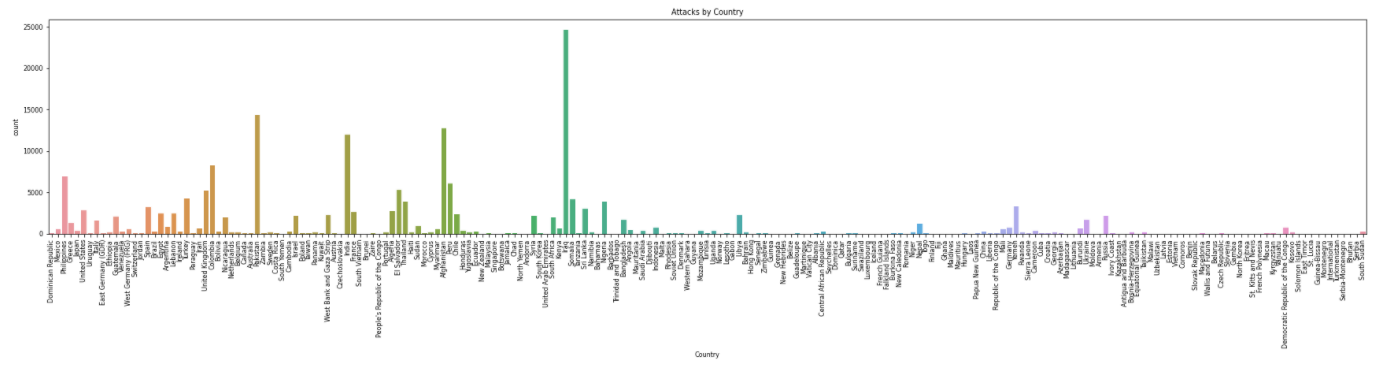
Iraq dominates all the countries and it has the highest number of attacks and then Pakistan, Afghanistan, and India follow it. Government should increase safety measures in these countries.
plt.figure(figsize=(28,5));
plt.rcParams.update({'font.size':10});
plt.xticks(rotation = 0)
plt.title('Attacks by Region')
sns.countplot(x=terrorism_df.Region);
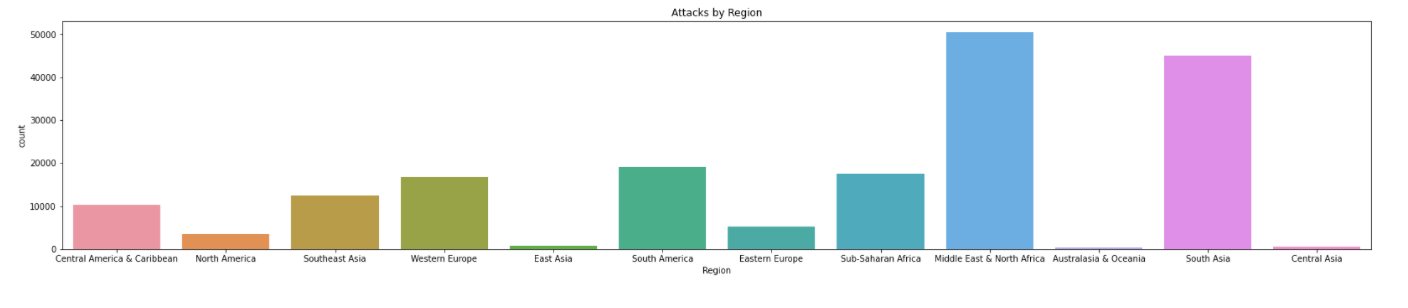
The Middle East& North Africa leads 1st among all the regions and then South Asia takes 2nd place.
plt.figure(figsize=(20,5));
plt.rcParams.update({'font.size':10});
plt.xticks(rotation = 90)
plt.title('Based on Target type')
sns.countplot(x=terrorism_df.Target_type);
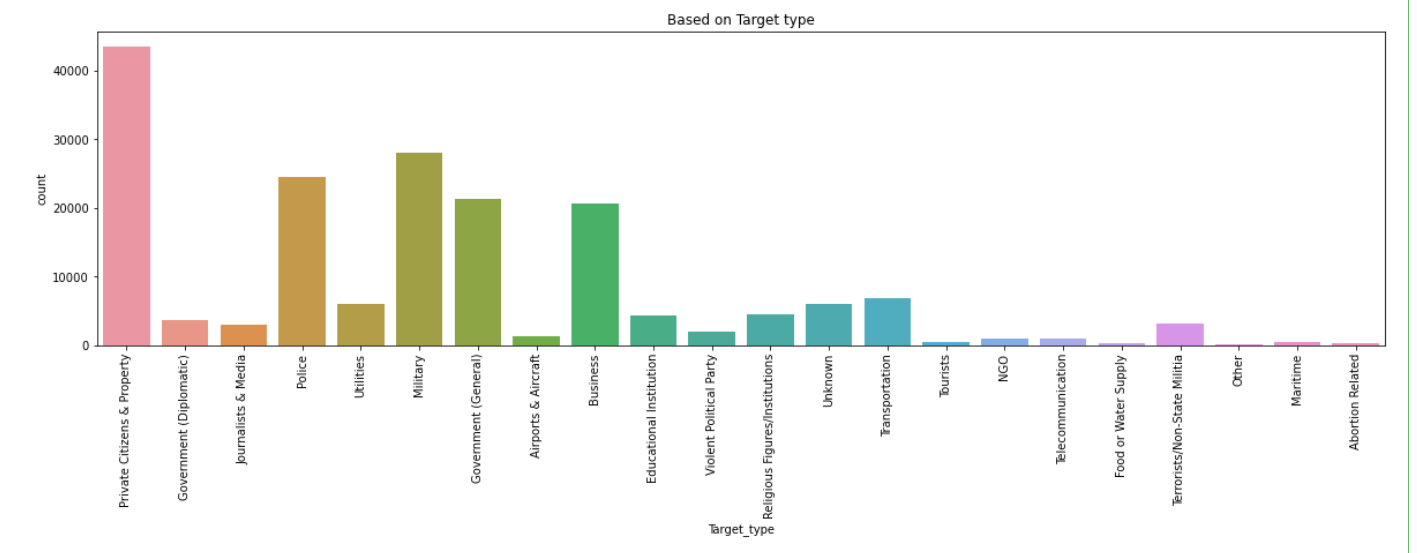
For most of the attacks, the target is Private Citizens& property and the next Military leads.
plt.figure(figsize=(25,5));
plt.rcParams.update({'font.size':12});
plt.xticks(rotation = 0)
plt.title('Based on Attack type')
sns.countplot(x=terrorism_df.Attack_type);
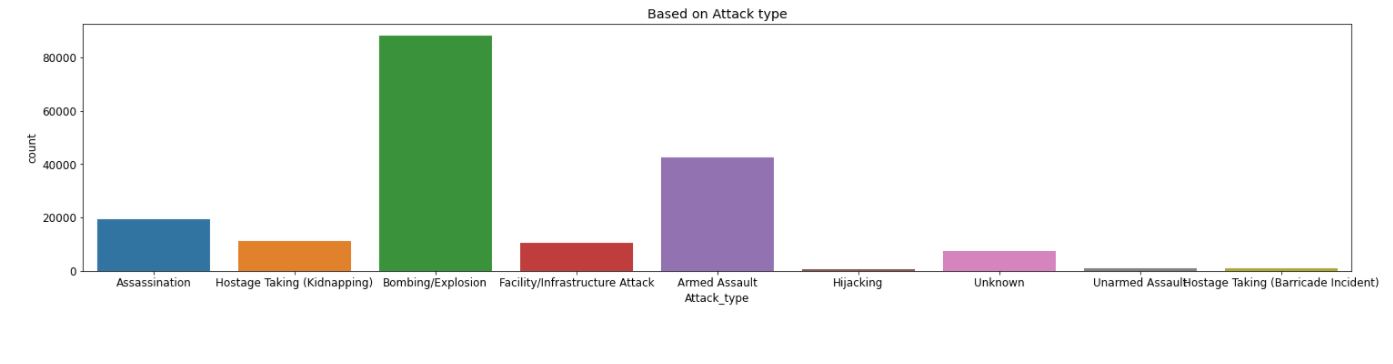
Most of the attacks were through either Bombing or Explosion.
Results of Analysis
- Most of the attacks were attacked through explosives and then through firearms.
- Attacks were more during 2014 and then in 2015. When compared to attacks from 1970 onwards, the last 6 years scored a maximum. But from 2014 onwards count started decreasing.
- Almost Every day has the same contribution but attacks were low during 31st and high during 15th and 1st.
- Iraq dominates all the countries and it has the highest number of attacks and then Pakistan, Afghanistan, and India follow it.
- The Middle East& North Africa leads 1st among all the regions and then South Asia takes 2nd place.
- For most of the attacks, the target is Private Citizens& property and the next Military leads.
- Most of the attacks were through either Bombing or Explosion.
Measures to be Taken to Reduce Terrorism
- By reducing access to dangerous weapons
- Government should provide more security over countries
- Security should be strengthened across borders
- Government should take measures on increased immigration
- and many more…
Endnotes
–> We have learned how to perform Exploratory data analysis by taking a dataset.
–> In this article, we have taken the Terrorism data set and we found how hot zones in the country.
–> We also conclude visualizations.
Hope you guys found this article useful on Exploratory Data Analysis.
Read the latest articles on our blog.
Connect with me on LinkedIn.
Thanks!
The media shown in this article is not owned by Analytics Vidhya and are used at the Author’s discretion
This is Amrutha, I am pursuing B.Tech in the Computer science Department. I am interested in developing ML Models with python and Data Analysis. And also I have an interest in Web Development. I hope my articles in Analytics Vidhya help you to learn better. Thank you!!


