This article was published as a part of the Data Science Blogathon.
Introduction
Data scientists/engineers/Analysts are in huge demand and various large and small firms are hiring left right and centre for various roles. Entry to mid-level roles involves quite a lot of individual contributor roles as well, where individuals own a project or a solution end to end. Business case study assignments can be used as a proxy to understand candidates’ ability to work as individual contributors. Knowing the nuances of effectively solving a case study assignment can surely help in landing multiple job offers.
Data scientists hiring involves case studies and it is an effective way to judge a candidate’s eligibility for the role. It is mostly considered an elimination round, and about 80% of the candidates are filtered out. Usually, in business analytics case studies, coding knowledge, problem-solving ability, presentation skills and overall role fitness are evaluated. Some case studies might focus just on building models, while others might focus on insights and final outcomes and recommendations, and many eligible candidates fail to clear this round due to a lack to clear understanding as to what needs to be presented.
This article sheds some light on how to go about solving business analytics or data scientists using these case studies.
Problem Statement
About the Data – The client is a leading fashion retailer in Australia. Company A runs a display advertising campaign for this brand, where it shows ads to users leading them to make a purchase on the brand’s website. The given dataset is the Sales data for all users who made a purchase online in the first half of October ’17. Link to download data.
Tasks
- Provide an overview of the brand’s sales by the following attributes:
- Overall – Total Sales and Revenue in the given time period
- Basket – Avg. unique quantity, revenue per order.
- Attributes – Time of Day, Day of Week, Geography, Payment Type
- Frequency – How many are single/multiple purchasers? What is the frequency of multi-purchase? Any typical attributes?
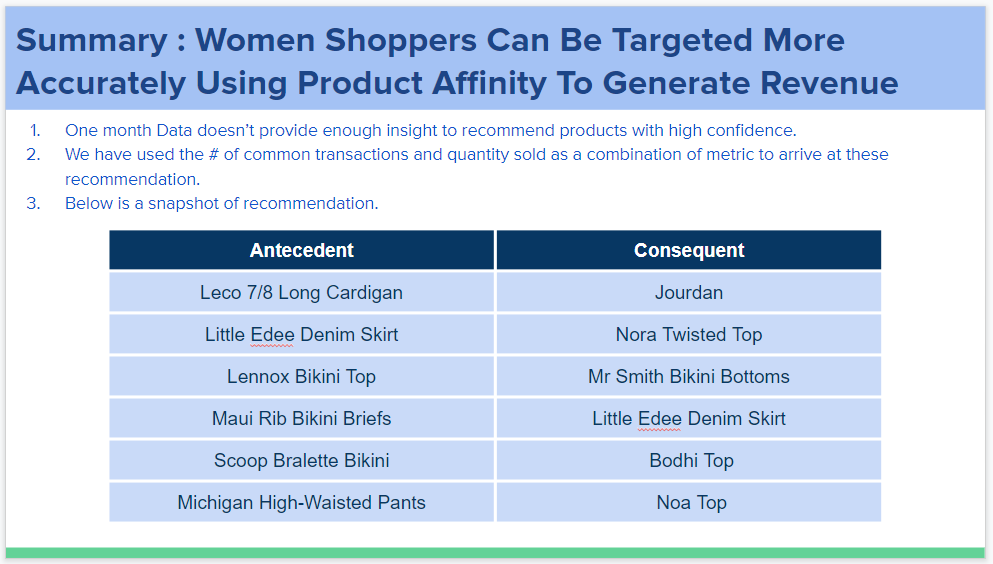
- Product Affinity – Which products are more likely to sell together?
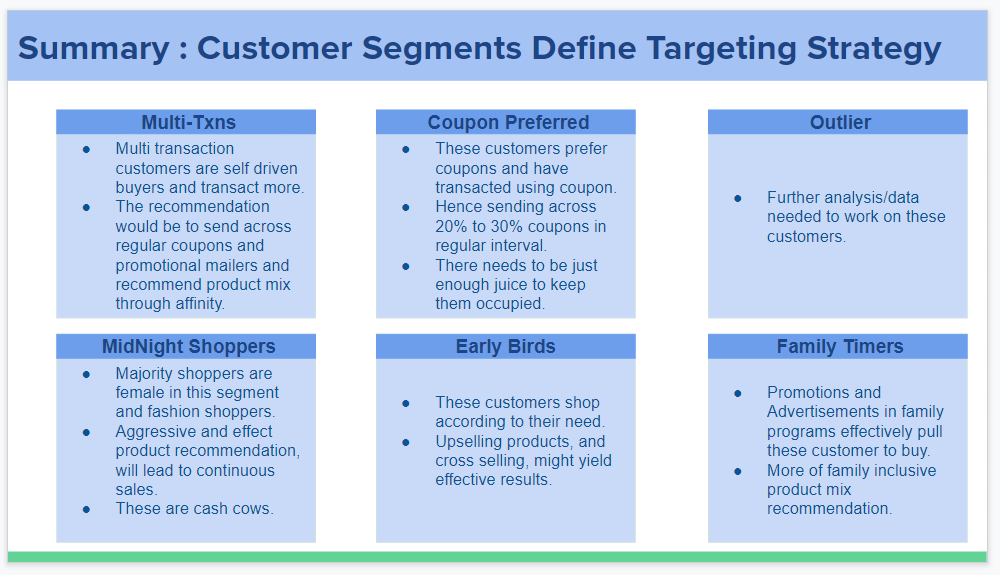
- Based on your analysis, arrive at a statistical segmentation of the brand’s audience based on Revenue. The number of segments is up to you. Please provide definitions of each group.
Output and Requirements
- Create a PowerPoint-based Report on your findings from the above. Your presentation should have the following 3 sections:
- Overview of the brand’s sales performance
- Product Affinity
- Segmentation
- Please include a slide or two on how would you broadly go about targeting more users for this brand. Come up with a well-defined media strategy.
Solutioning
Broadly below are the steps to be followed:
- Read the problem statement carefully a couple of times even before opening the dataset. Write down all ideas, questions and solution methods that come to your mind.
- Data preprocessing, validation. Identify data issues, incomplete data, or any other problem that can potentially derail the analysis.
- Create the skeleton of your presentation. This provides clarity of thought as to what needs to be done.
- Creating a master dataset, which has almost all the features/columns needed.
- Feature engineering if there is a need to create composite features.
- Create summaries and insights using excel, tableau public or python. Dashboards provide great visualization capabilities and are quite useful in finding insights as compared to excel.
- Create segments and identify their personas
- Using the Apriori data mining algorithm, identify product affinity.
- Once the outputs are validated, populate the PPT. Make sure uniform fonts and formats are used across slides.
- Make sure there is a story to tell.
- The important step is to QC your output more than once before sending it out. Keep aside at least 5% of your time to go through the final PPT, and identify errors, spelling mistakes, and formatting errors if any.
Load Dataset
import pandas as pd
import matplotlib.pyplot as plt
import datetime
import time
import re
import numpy as np
file_name = "Fashion - Assignment Data .csv"
fashin_df = pd.read_csv(file_name, encoding = "cp1252", parse_dates=True, dtype={'Product_Name': str, 'Product_ID': str, "Number_of_Products": str})
display(fashin_df.head())
display(fashin_df.columns)

Data Preprocessing
Data cleaning takes the most effort during work but is the least assessed skill in interviews. As there is no standard process, this step can be used to highlight programming as well as data processing skills. Below are the certain operations that need to be done, before segmentation or before using the apriori algorithm.
- Convert the timestamp column into DateTime format.
- Get date and time columns from DateTime.
- Filter products where the product name is undefined.
- Change Product Name, Product ID and Number of Products dtypes from object to a string.
- Get unique columns or primary key columns
- Create new features like coupon tags, hours, and days of the week. It’s advised to create an exhaustive list of variables while processing before removing on machine learning or data mining algorithms
- Prepare data that can be used for the apriori algorithm.
Update DateTime column type and get two new columns
fashin_df[fashin_df["Product_Name"] == "undefined"]
fashin_df.timestamp = pd.to_datetime(fashin_df.timestamp)
fashin_df['dates'] = fashin_df['timestamp'].dt.date
fashin_df_002["User_Birthday_new"] = pd.to_datetime(fashin_df["User_Birthday"], errors='coerce')
fashin_df['Time'] = [datetime.datetime.time(d) for d in fashin_df['timestamp']]
Change Product Name, Product ID, and Number of Products dtypes from object to a string
types_dict = {'Product_Name': str, 'Product_ID': str, "Number_of_Products": str}
for col, col_type in types_dict.items():
    fashin_df[col] = fashin_df[col].astype(col_type)
Identify the uniqueness of the data
fashin_df["Order_ID"] = fashin_df['timestamp'].astype(str).str.cat(fashin_df[['user ID', 'ip_address']].astype(str), sep=' - ')
Convert to numeric and fillna
fashin_df["Revenue"] =  pd.to_numeric(fashin_df["Revenue"], errors='coerce')
fashin_df["Revenue"] = fashin_df["Revenue"].replace(np.nan, 0)
Apriori Preprocessing – Product_Name Product_ID Number_of_Products
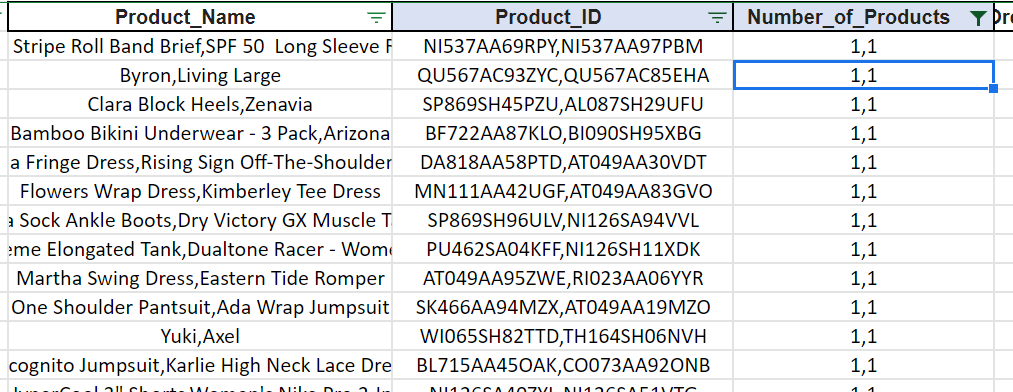
Multiple products from the same order are represented as a list, separated by commas, this is not an ideal input for the apriori algorithm. Product pairs from the same transaction are one way to represent data for the apriori algorithm. This has been done below.
## Get a quantity columns
## write a function for the same
df_c = pd.concat([fashin_df["Order_ID"], fashin_df["Number_of_Products"].str.split(",", expand = True)], axis=1)
df_f = df_c.melt(id_vars=["Order_ID"],
var_name="Product_Split",
value_name="Number_of_Products")
df_f.head()
df_c = pd.concat([fashin_df["Order_ID"], fashin_df["Product_Name"].str.split(",", expand = True)], axis=1)
df_e = df_c.melt(id_vars=["Order_ID"],
var_name="Product_Split",
value_name="Product_Name")
df_e.head()
df_c = pd.concat([fashin_df["Order_ID"], fashin_df["Product_ID"].str.split(",", expand = True)], axis=1)
df_d = df_c.melt(id_vars=["Order_ID"],
var_name="Product_Split",
value_name="Product_ID")
df_d.head()
a1 = pd.merge(df_f,df_e,on=['Order_ID',"Product_Split"],how='left')
a2 = pd.merge(a1, df_d,on=['Order_ID',"Product_Split"],how='left')
a2["Number_of_Products"] = pd.to_numeric(a2["Number_of_Products"], errors='coerce')
a2["Number_of_Products"] = a2["Number_of_Products"].replace(np.nan, 0)
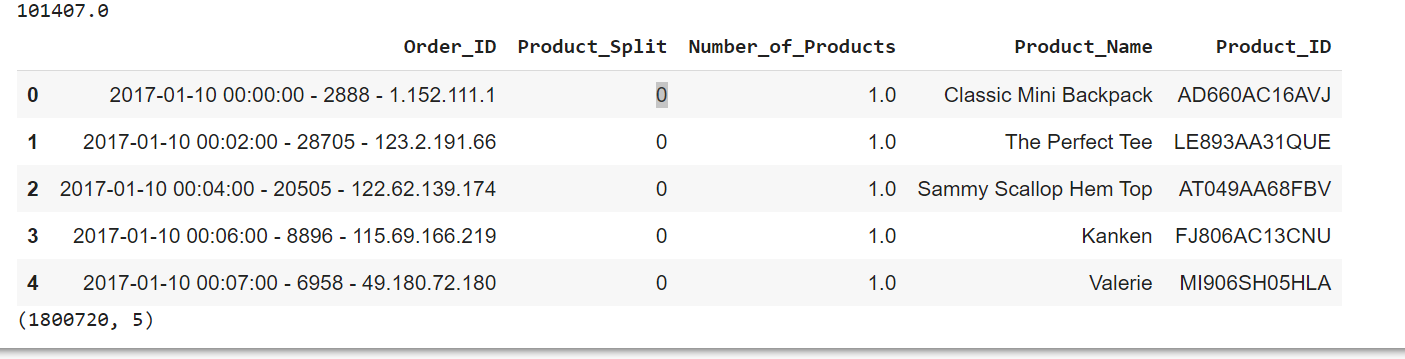
display(sum(a2["Number_of_Products"] ))
display(a2.head())
display(a2.shape)
Quantity_to_join = a2.groupby(["Order_ID"]).agg({"Number_of_Products":sum}).reset_index()

Quantity_to_join.rename({"Number_of_Products" : "Quantity"}, axis='columns', inplace = True)

fashin_df_002 = pd.merge(fashin_df,Quantity_to_join,on=['Order_ID'],how='left')
a1 = pd.merge(df_f,df_e,on=['Order_ID',"Product_Split"],how='left')

a2 = pd.merge(a1, df_d,on=['Order_ID',"Product_Split"],how='left')

display(a2.head())

display(a2.shape)

a3 = a2[a2.Number_of_Products.notnull()]

a3.to_csv("Product_Details_002.csv")
Saved to CSV and apriori algorithm is run to get product affinity. The final output is at order_id, product level. An order with a single product isn’t very useful to the apriori algorithm and can be ignored as well.
Create new columns for coupon applied and time of the day
fashin_df_002["Coupon_Tag"] = np.where(fashin_df_002.Order_Coupon_Code.isnull() == True, "No Coupon","Coupon")
fashin_df_002["Hour"] = fashin_df_002['timestamp'].apply(lambda x: x.hour)
fashin_df_002["Hour_Bracket"] = np.where((fashin_df_002.Hour >= 0) &(fashin_df_002.Hour <= 7), "Mid - Night - Morning",
                                        np.where((fashin_df_002.Hour > 7) &(fashin_df_002.Hour <= 13),"First Half",
                                                np.where((fashin_df_002.Hour > 13) &(fashin_df_002.Hour <= 17),"Second Half","Night")))
Segmentation
Top-down approach: Top-down approach uses already known business knowledge to build segments. For example – Segments of customers between the ages of 18 to 25 have more than 5 transactions with an average quantity of 2. The approach is neat, defines the segment clearly, has a clear objective and is easy to implement.
Bottom-up approach: Bottom-up approach identifies users with similar attributes and groups them as a segment. Once the segments are created, there cannot be direct actionability. These segments need to evaluate based on their metrics and identify and name those segments.
Due to the time constraints in getting these assignments out as quickly as possible, the Top-down approach has been chosen.
fashin_df_002["Segment_Tag"] = np.where(fashin_df_002.Revenue == 0, "Outlier",
                                       np.where(fashin_df_002.Multi_Txns_cust.isnull() == False, "Multi_Txns",
                                               np.where(fashin_df_002.Coupon_Tag == "Coupon", "Coupon_Cust",
                                                       np.where(fashin_df_002.Hour_Bracket == "First Half", "First Half",
                                                               np.where(fashin_df_002.Hour_Bracket== "Mid - Night - Morning", "Mid - Night - Morning",
                                                                       np.where((fashin_df_002.Hour_Bracket == "Night") or (fashin_df_002.Hour_Bracket=="Second Half"), "Second Half", "Outlier") )))))
Summary metrics to create plots and charts
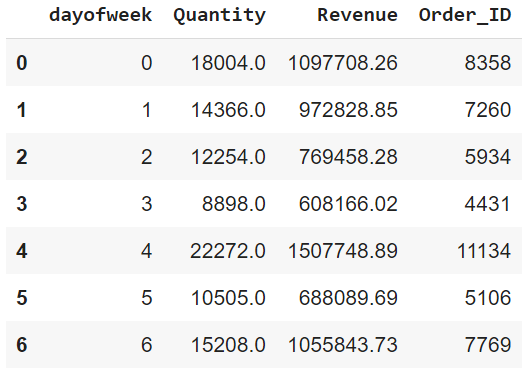
Which day of the week has the highest revenue, quantity and orders?
fashin_df_002.groupby("dayofweek").agg({"Quantity":sum, "Revenue":sum, "Order_ID" : pd.Series.nunique}).reset_index()
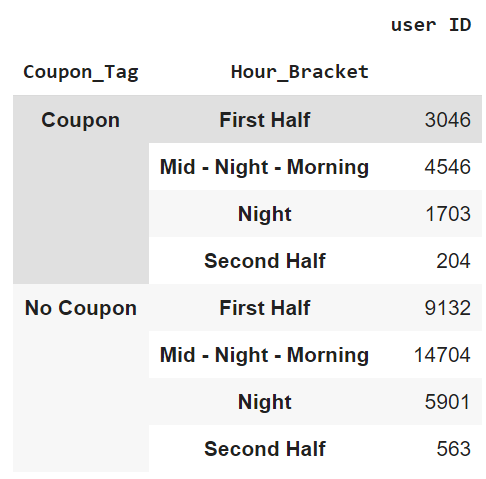
Is coupon redemption distributed equally during the day?
–> 0-7 Midnight-Morning, 8-13 First Half, 14-17 Second Half, >17 Night
all_single_txns_full_df = fashin_df_002[fashin_df_002.Multi_Txns_cust.isnull() == True]
all_single_txns_full_df.groupby(["Coupon_Tag", "Hour_Bracket"]).agg({"user ID":pd.Series.nunique})
A few other EDA questions that can be answered for the data scientists roles are :
- Which payment method is preferred by users and does it have any relationship with coupons?
- Does coupon redemption change based on the day of the week?
- Is it ideal to give coupons on the day, when there is higher redemption or when there is lower redemption?
- Is there a specific pattern based on gender?
- What is the average frequency of a customer?
- Is the distribution normal?
Apriori Algorithm In SQL
Use Product_Details_002.csv as the input data. Converting the below formulas into SQL code to get product affinity pairs.
SQL Apriori code link.
PPT Template
PPTs should contain the below sub-sections:
- Title Slide
- Agenda
- Sub Title
- Supporting slide with charts and insights
- Recommendation and Conclusion
- Appendix
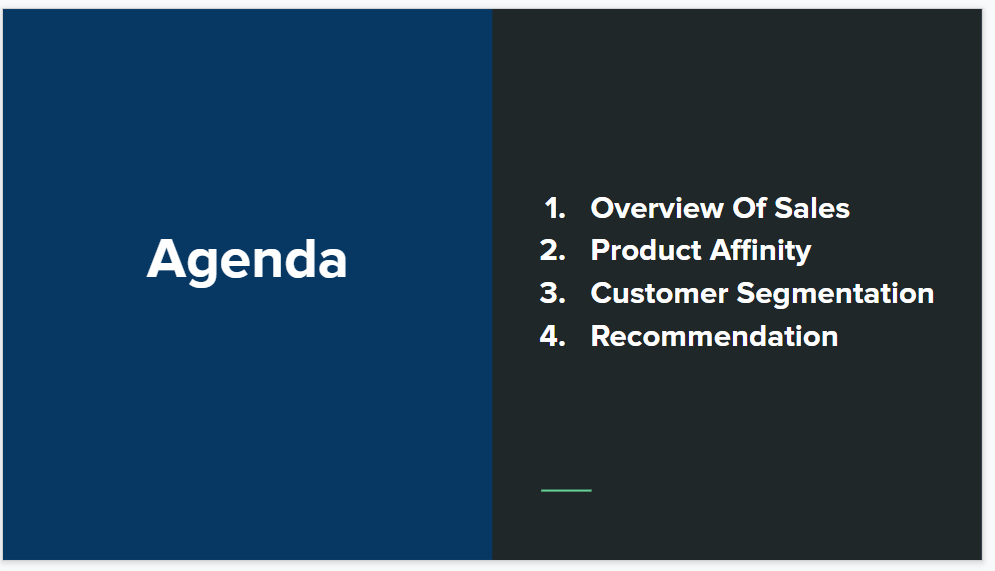
Agenda
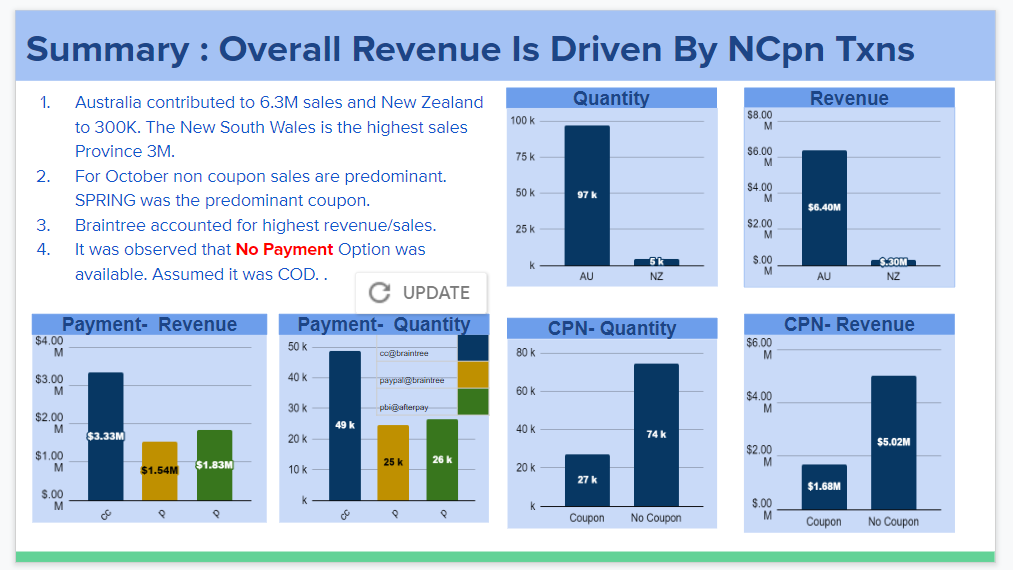
Summary – Supporting slides with insights
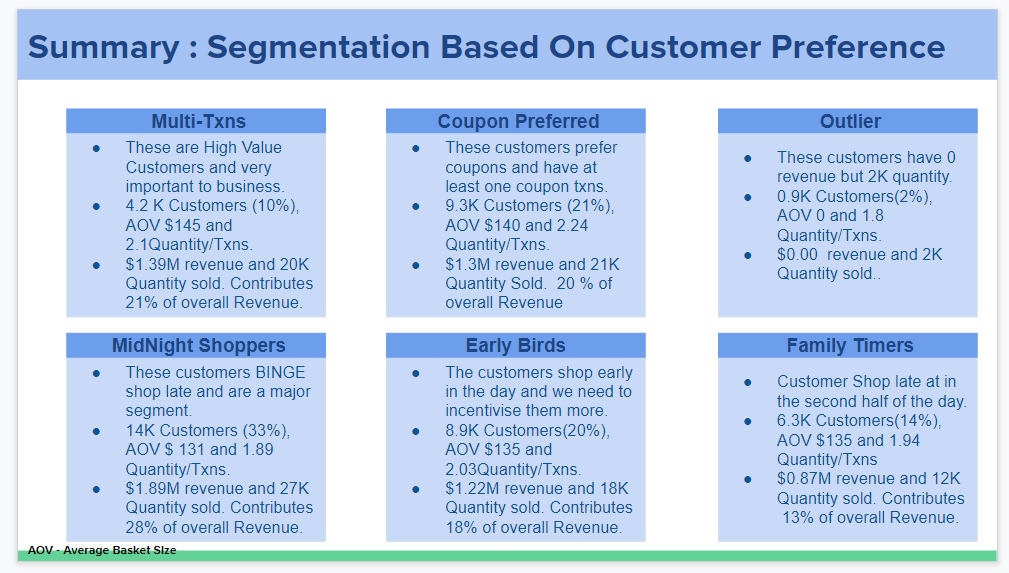
Recommendation – Customer Persona
Recommendation – Targetting strategy
Product Affinity
What’s Next?
Until HR calls for interviews for the data scientists roles, below are a few things that might help.
- Review possible questions that the interviewer might ask about the data scientists’ roles.
- Be through with the solution and reason for choosing a particular methodology.
- Play your own devil’s advocate and defend your solution.
- List the shortcomings of the solution clearly and keep possible alternative solutions handy.
- Know the algorithm used in detail. For example, if XGBoost is used, know the minute details for this algorithm and the reasons for choosing it over decision trees, or logistic regression.
- Some possible questions that can be asked for the above case study are
- Why not use a clustering algorithm like Kmeans or DBSCAN?
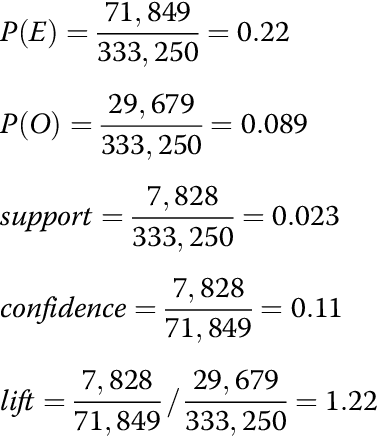
- What are the mathematical formula for support, lift, and confidence? Can they be manipulated to consider quantity, and revenue as well?
- How can you measure or evaluate the performance of the top-down clustering approach?
- Explain Kmeans algorithm.
Conclusion
While case studies for data scientists can be a daunting task, it provides a clear picture of the role offered. It also shows that the firm is ready to ready to put in a lot of effort in selecting the best candidates as well. In summary :
- A case study is a preliminary round and used to filter unfit candidates, hence maximum efforts in terms of techniques(use multiple techniques) and presentation matter the most.
- Provide original ideas and solutions, don’t be limited by assumption.
- Consider challenges as opportunities to further improve the solution. For example, if certain data isn’t provided, provide information as to how this data would be useful and the opportunity lost by not having it.
- Not all solutions need to be practical, provide hypothetical solutions to show creativity.
- Presentation – just data, tables, and images on a PPT slide just aren’t enough. Callouts, writing a descriptive heading and providing clear cut bullet points, add great value and help make the message clear.
- Highlight the value proposition of the solution.
- The focus needs to be on getting a working solution and not achieving the perfect solution. There is no perfection in case study assignments.
- Try to showcase technical abilities, social and behavioural skills, or a combination of the two.
- Do not be shortsighted and only answer the questions asked, if there are opportunities to go beyond those questions, use them to showcase your skill. For example: In a data munging/wrangling case study, build a model as well. If time permits create an impressive dashboard.

Good luck! Here’s my Linkedin profile if you want to connect with me or want to help improve the article. Feel free to ping me on Topmate/Mentro; you can drop me a message with your query. I’ll be happy to be connected. Check out my other articles on data science and analytics here.
The media shown in this article is not owned by Analytics Vidhya and is used at the Author’s discretion.
Data scientist. Extensively using data mining, data processing algorithms, visualization, statistics, and predictive modeling to solve challenging business problems and generate insights. My responsibilities as a Data Scientist include but are not limited to developing analytical models, data cleaning, explorations, feature engineering, feature selection, modeling, building prototype, documentation of an algorithm, and insights for projects such as pricing analytics for a craft retailer, promotion analytics for a fortune 500 wholesale club, inventory management/demand forecasting for a jewelry retailer and collaborating with on-site teams to deliver highly accurate results on time.


