Introduction
Solving case studies is a great way to keep your grey cells active. You get to use math, logic and business understanding in order to solve questions. Do you find it exciting too ? Having received an overwhelming response on my last week’s case study, I thought the show must go on. Do check out the last week’s case study before solving this one.
This case study is one of my favorite because of its real life implementation. The calculations which you’ll do in solving this case are the ones which often take place in real life. Therefore, it’s not just mathematical but practical also. For experienced job roles, similar case studies often appears in job interviews also. So, give your best attempt!
The objective of this case study is to optimize the price level of products for an online vendor. I have over-simplified the case study to make it a similar platform for all, including people who have worked in similar industry. I’ve solved this case study in two ways, using business approach & analytical approach (using R). The data set is available for download below.
Are you preparing for your next data science interview? We have put together several such case studies as part of our comprehensive ‘Ace Data Science Interviews‘ course. Make sure you check it out!

Case Study
Suppose, you are the owner of an online grocery store. You sell 250 products online. A conventional methodology has been applied to determine the price of each product. And, the methodology is very simple – price the product at par with the market price of the product.
You plan to leverage analytics to determine pricing to maximize the revenue earned.
Out of 100000 people who visit your website, only 5000 end up purchasing your products. Now, all those who made a purchase, you have obtained their buying patterns, including their average unit purchased etc.
To understand the impact of price variations, you tried testing different price points for each product. You got astonished by the results. The impact can be broken down into two aspects:
- A lower price point increases the volume of the purchased product.
- Customers compare price points of a few products more than others, to make a decision whether to buy products from your portal or not.
For instance, Product 1 might be a frequently used product. If you decrease the price point of product 1, then the customer response rate which was initially 5% goes up to 5.2% over and above the fact that the customer will purchase more of product 1.
On the other hand, decrease in product price obviously decreases the margin of the product.
Now, you want to find the optimum price points for each of the product to maximize the total profit earned. In this case study, you are provided with a table with all 250 items : Download Dataset
Following are the variables available in the data set:
- Average Price/Unit : Market price of the product
- Cost/Unit : Current cost of the product
- Average Profit/Unit : Profit for each unit
- Average units sold : Average number of units of product sold to a customer who makes a purchase
- Incremental acquisition : For every 10% decline in unit price, this is the increase in total customer response rate. Note that overall response rate initially is 5% (5000 out of 100000 make a purchase). You are allowed to decrease the price of a product maximum by 10% by market laws.
- Increase in sale volume : For every 10% decline in unit price of product, this is the increase in volume. Again, you are allowed to decrease the price of a product maximum by 10% by market laws.
Note: The maximum price hike permitted is 20%. So, basically the price of a product can be varied between -10% to +20% around the average price/unit.
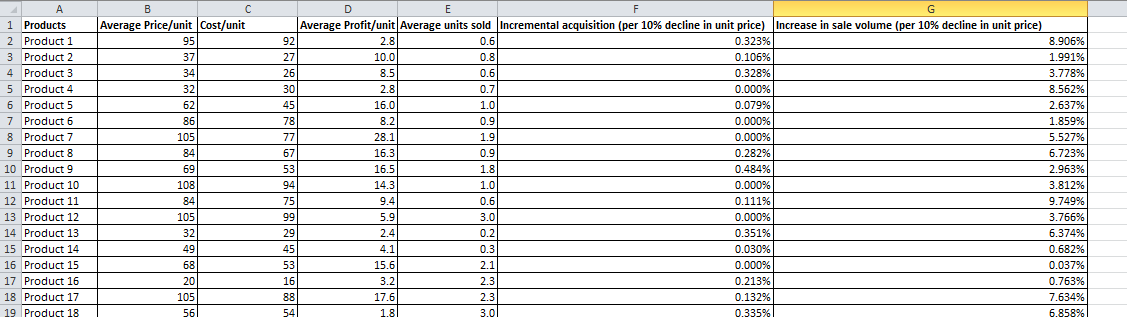 Snapshot of data set
If you make the calculation of the profit earned per customer who comes to your portal :
Total Profit Earned : $165
We will try to solve this case study both by a business approach and an analytical approach. Let’s do it!
Business approach to solve the problem
To solve the problem without applying any technique, let’s analyze the frequency distributions.
Profit Margin : Here is a distribution of profit margin for each of 250 products.
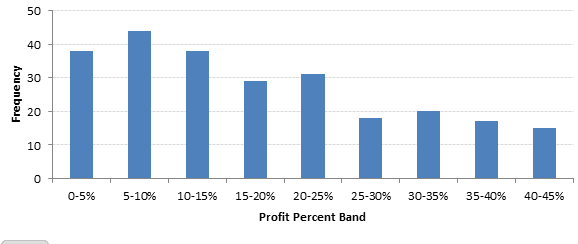
Let’s divide the products based on profit margin bands.
Low Profit Margin: Less than 10% Profit
Medium Profit Margin: 10% – 25% Profit
High Profit Margin: 25% + Profit
Incremental volume : Here is a distribution of incremental volume for each of 250 products.
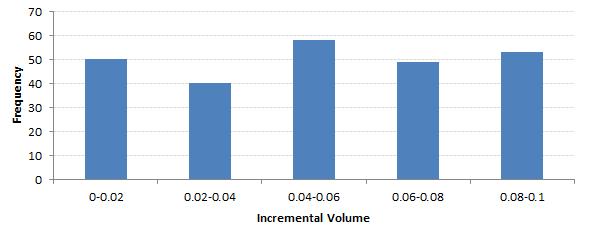
Let’s categorize incremental volume bands:
Low Incremental Volume: Less than 2%
Medium Incremental Volume: 2% – 6%
High Incremental Volume: 6% + Profit
Incremental Acquisition : Here is a distribution of incremental acquisition for each of 250 products.
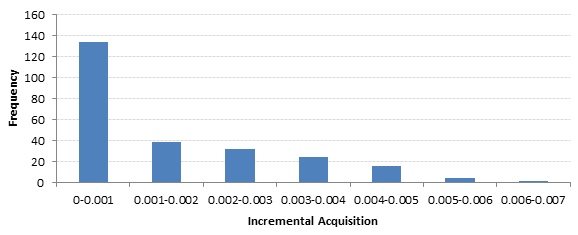
Finally, we should split incremental acquisition bands also:
Low Incremental Acquisition: Less than 0.1% Profit
Medium Incremental Acquisition: 0.1% – 0.4% Profit
High Incremental Acquisition: 0.4% + Profit
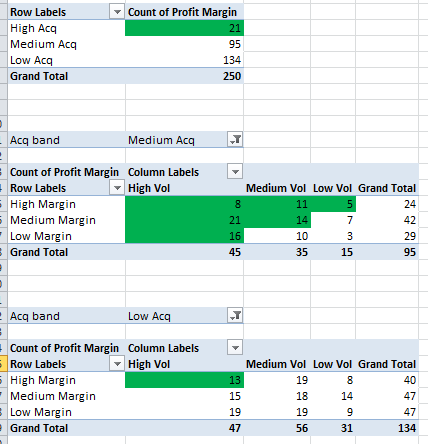
Let’s discuss the pricing strategy now:
Until here, we have got three decision attributes for each product. The extreme of the pricing is -10% and 20%. We need a -10% for products which can give a big acquisition increment or high volume increment or both. For rest we need to increase the profit margin by increasing pricing by +20%.
Obviously, this is a super simplistic way to solve this problem, but we are on a track of getting low hanging fruits benefit.
Because the incremental acquisition has a mean at 0.4%,we know that if we decrease the cost of products with high acquisition incremental rate, we will have significant incremental overall sales, but quite less impact due to less profit margins.
For medium incremental acquisitions, we need to take decision on profit margins and incremental volumes. All the cells shaded in green are the ones that will be tagged for -10% and rest at 20% price increase. The decision here is purely intuitive taking into account the basic understanding of revenue drivers for which we have seen the distributions above.
Now if we calculate the total profit earned, we see significant gains over and above the initial profit.
Total Profit earned : $267 (Increase of 62%)
Analytical approach to solve the problem
Let’s take a more analytical/numerical way to solve the same problem. Here is what we try in this algorithm :
- We start with a vector of all zeros for each 250 products incremental sales price.
- We now increase/decrease each of the product’s incremental sales price by 1% to see the impact on total profit.
- For an increase in profit, we keep the incremental sales. Now we start with this vector to find further marginal increment.
Here is the R code:
setwd("C:\\Users\\ts93856\\Desktop\\Taxi")
data <- read.csv("Bigbasket.csv")
dim(data)
#250*7
summary(data)
# This is the initial value of the increment vector - all zeros
increment <- array(0,250)

flag = 0
increment_i <- increment
#flag = 1 is a condition when the increment vector remains the same
while (flag == 0) {
print(find_rev(increment_i))
increment_iplus1 <- incremental_new(increment_i)
if (min(increment_iplus1 == increment_i) == 1) {flag = 1}
increment_i <- increment_iplus1
}
increment_i
find_rev(increment_i)
/find_rev(increment)
price <- increment_i
write.csv(price,"price.csv")

#This function tries to get the next best increment vector
incremental_new <- function(initial_increments){
initial_rev <- find_rev(initial_increments)
intermediate_rev <- 0
for(i in 1:250){
increments <- initial_increments
if(increments[i] > -0.099) {increments[i] <- increments[i] - 0.01}
rev <- find_rev(increments)
if (rev > initial_rev) {final_increments <- increments
intermediate_rev <- rev
}
if(increments[i] < 0.19) {increments[i] <- initial_increments[i] + 0.01}
rev <- find_rev(increments)
if (rev > max(initial_rev,intermediate_rev)) {final_increments <- increments}
}
return(final_increments)
}
# This function will get us the overall revenue for the given increment vector
find_rev <- function(increment){
price <- data$Avg_Price_per_unit*(1+increment)
volumes <- data$Average_units_sold*(1-(data$Increase_sale_volume*increment*10))
multiplier <- (1-(data$Incremental_acquisition*increment*10))
total_multiplier <- prod(multiplier)
profit_wo_multiplier <- 0.05*(sum(price*volumes) - sum(volumes*data$Cost_per_unit))
profit_w_multiplier <- profit_wo_multiplier*total_multiplier
net_profit <- sum(profit_w_multiplier)
return(net_profit)}
Total Profit earned : $310 (88% incremental benefit)
2 minutes silence for all those who questioned the power of data analytics! 😀
End Notes
The data used in this analysis is derived from a simulation of prices of a grocery store. The best approach is generally a combination of both business and numerical method. I encourage you to try such algorithms on this data and share with us your approach and total profit incremental benefit.
Did you like reading this article ? Do share your experience / suggestions in the comments section below. I’d love to know your intuitive solutions to learn more ways of solving this case.
You can test your skills and knowledge. Check out Live Competitions and compete with best Data Scientists from all over the world.
Tavish Srivastava, co-founder and Chief Strategy Officer of Analytics Vidhya, is an IIT Madras graduate and a passionate data-science professional with 8+ years of diverse experience in markets including the US, India and Singapore, domains including Digital Acquisitions, Customer Servicing and Customer Management, and industry including Retail Banking, Credit Cards and Insurance. He is fascinated by the idea of artificial intelligence inspired by human intelligence and enjoys every discussion, theory or even movie related to this idea.


Hi Tavish, Thanks for the share. Just a quick clarification, "Average units sold : Average number of units of product sold to a customer who makes a purchase" Shouldn't it be "Average number of units of product sold to a customer who makes "ANY" purchase" ? Especially when the Average units sold numbers are less than 1..!! Thanks.
Yes you are right. I am referring "a purchase" as "any purchase"
Hi Tavish, long time :). Fantastic job with the analytical part, From what I understood from the above case, we have assumed no correlation between products when varying prices,right ? We have basically calculated the ideal price point for each product and then finally calculated the aggregated net profit ? How would you approach this if products are correlated among themselves, with price changes in one changing the dynamics of other products ?
Yes Abhinav, Assuming no correlation is over simplistic. In case we bring in the dimensionality of correlation between products, my R code will not change significantly. The only piece that will change is the last function where we calculate the incremental revenue.
Looks like you have implemented Genetic Algorithm to identify best set of Values, Am I right ..?
I will prefer saying Newton Raphson method rather than genetic algorithm.