This article was published as a part of the Data Science Blogathon.
Introduction to Geospatial Data Analysis
Geospatial data is any type of data that has certain geographic factors like latitude, longitude, etc. geographic component simply means a location or several locations that can take the form of simple points or more complex shapes describing lines, boundaries, or even elevation. Some examples include country borders, the outline of water bodies, and global supply chain, etc. GIS (Geospatial Information system) is geographic or spatial data that helps to identify the geographic location of features and boundaries on Earth which means every data is represented with reference to earth. Spatial data is always represented in a combination of a bunch of coordinates and topology. whenever we target a particular geographic event to analyze and solve a problem using the GIS mechanism then along with geographic information we have time, temporal information, and other information (attribute information) required.
Introduction and Installation of GeoPandas
GeoPandas is free and an open-source python package used for reading, writing, and analyzing the vector dataset with the help of plotting different intellectual plots. It extends the datatypes and functionalities used by pandas to allow spatial operations on geometric types. In simple words, the Geopandas library is built on top of the Python Pandas library that is used for basic data preprocessing and geoPandas extends all the pandas functionality to work with vector data visualizations. It further depends on Fiona for file access and Matplotlib for visualization of data. In short geoPandas is simple a python library but to function it there are various dependencies and need to install like Pandas, Numpy, Matplotlib, Fiona, and shapely.
Installing GeoPandas on Anaconda Prompt
The benefit of installing GeoPandas using Conda is it automatically installs all the dependencies to fulfill the need for GeoPandas to function. we also install Descartes which is a library used for essential plotting of geographic data. So we need to run the two below commands.
conda install geopandas
pip install descartes
Installation Using PIP
We can also install GeoPandas using the PIP command from our system command prompt but the extra dependency you need to install manually in the case with PIP. And if you are working with Google Colab or Kaggle kernel then you only need to install GeoPandas in Notebook itself.
pip install geopandas
Reading Vector Data from File
We have a simple JSON file of the Nepal Municipal corporation. You can download the file using this link and If you are using Colab or Kaggle kernel then can directly read the data using the URL. The first thing is to import the library and then read the data.
Python Code:
import geopandas as gpd

in_geojson = r'https://raw.githubusercontent.com/iamtekson/geospatial-data-analysis-python/master/data/shp/municipality.json'
geo_df = gpd.read_file(in_geojson)
print(geo_df.head())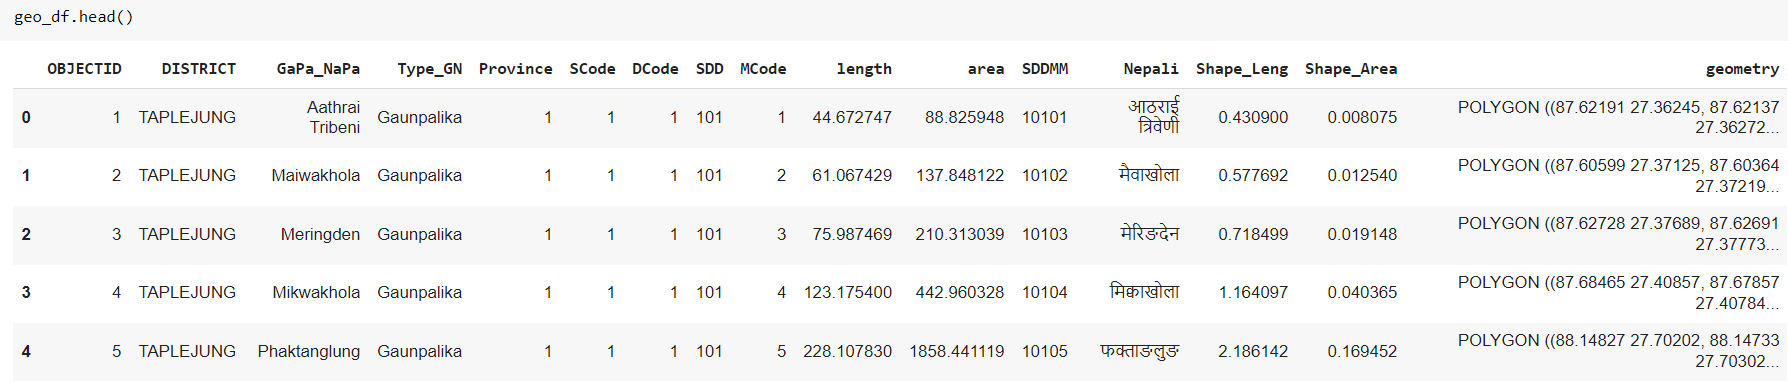
In the same way, you can read files of multiple file formats like JSON, SHP, XML, etc.
Reading The Vector Data from the Database
Always it is not possible to get a dataset in a direct file and you are supposed to load it from different sources one is a database because organizations collect and store the data in databases and as a GIS data analyst you have to load the data from organization databases. First, you need to implement a connection with the database you are working with using username, password, and database name in which data is present which can be any database like MySQL, MongoDB, Postgre SQL, etc. After that, you need to write a SQL query to retrieve the data from the SQL table and then use GeoPandas to read the data and load it as a DataFrame. Below is a sample code for reference.
from sqlalchemy import create_engine
#You have to enter your username, password, database name
db_connection_url = 'postgres://myusername:mypassword@myhost:5432/DatabaseName'
con = create_engine(db_connection_url)
sql = "SELECT geom, highway FROM roads"
df = geopandas.GeoDataFrame.from_postgis(sql, con)
Reading Metadata of Geo Dataframe
Metadata is the kind of information about any other data. geoPandas has a coordinates function that provides the information regarding CRS (Coordinate system).
geo_df.crs
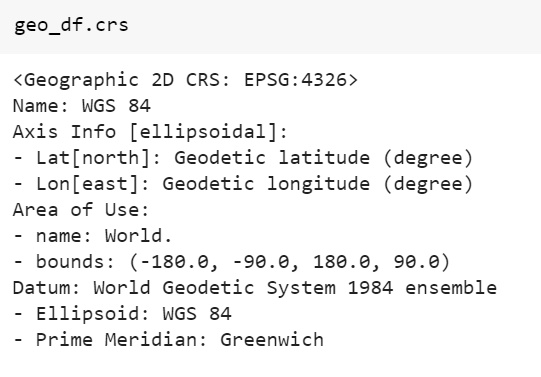
To observe the geometric type of geographic data we can use the below function.
Visualization of Vector Data Using GeoPandas
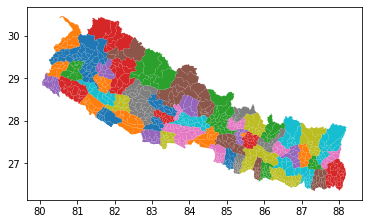
To visualize the vector dataset we can simply use the plot function of geoPandas because in the backend it uses the Matplotlib python library.
geo_df.plot()
But it contains fill color as blue and if you have to plot a graph based on certain columns then we have to mention column names in the plot function to have different colors also we have various parameters to define in the plot function. Below is an example of plotting a district-wise plot.
geo_df.plot('DISTRICT')
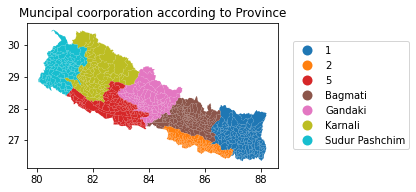
It also has a legend property to plot a graph with legend and design it using subplots and position. below is a sample snippet of designing a graph.
#based on province
fig, ax = plt.subplots(1, figsize=(4.5, 10))
geo_df.plot(ax = ax, column='Province', legend=True, legend_kwds={'loc':'center left'})
leg = ax.get_legend()
leg.set_bbox_to_anchor((1.04, 0.5))
plt.title("Muncipal coorporation according to Province")
plt.show()
Writing Dataframe to Vector Data
We can write or save Dataframe in a vector format using GeoPandas. It is the same as how we save Dataframe in CSV or any other format in Pandas.
#writing vector data to a file
geo_df.to_file('/', encoding="utf-8")
Hands-on Geospatial Data Analysis on Real-data
Now we have a good understanding of Geospatial data and it’s time to pick a new dataset and try hands-on data visualization and analysis using what we learned and explore our learnings to understand why Geospatial analysis is so popular and used everywhere for business planning and decision-making. The dataset is similar to the above-used dataset which is an ESRI district dataset that has many shape files ESRI district shape files, area of interest, etc. You can access all the data files through this link. And create a new Python file if you are using any python IDE or create a new Jupyter notebook working with collab or Kaggle kernels.
Load the ESRI Shape File
The first thing to proceed to the analysis part is to import the necessary libraries and load the data. when you check the type of data then it is GeoPandas geo DataFrame.
import pandas as pd
import matplotlib.pyplot as plt
import geopandas as gpd
districts = gpd.read_file(r'geospatial_data/Shapefiles/districts.shp')
print(type(districts))
districts.head()
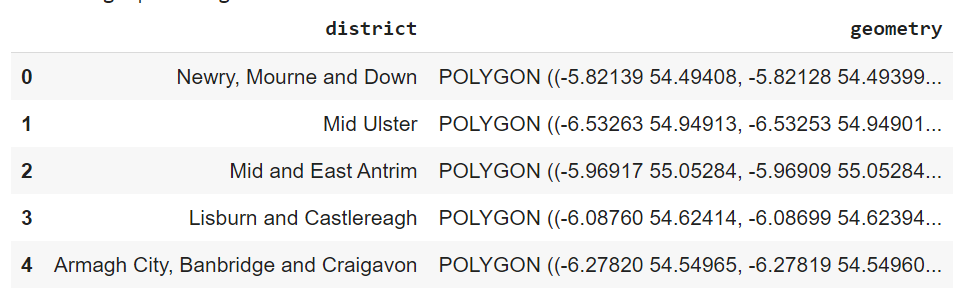
We have a different district of the northern island and if you have not seen the geometry column It gets created when we import vector files like SHP file, or geo JSON file and contains the information corresponding to the geometrical properties of each of these attributes so when you working with Geopandas geo DataFrame then don’t skip or delete the geometry column even by accident because that will cause for this to loose the geometrical properties which means it is not going to be a special data anymore.
Visualize the ESRI Shapefile using geoPandas
geoPandas Plot function is used to simply plot the geographic data of geo DataFrame. To draw a plot more interactive we can border out each district using edge color, you can change the color of the graph using a color attribute and indeed use the c-map property to design the blog in a very good way.
#plot
districts.plot(cmap=’jet’, edgecolor=’black’, column=’district’)
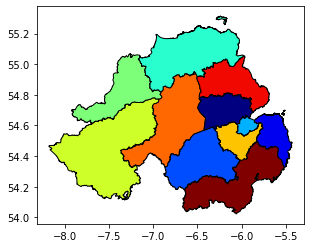
There are different attributes and ranges of values that you can use. There are different color maps as well like HSV, turbo, etc. To find more attributes, values, and color maps you can reach official documentation from here.
Area of Interest Shape File
we can load as many shape files as we want and you might be interested to know what this area of interest might especially mean when we consider the special extent of different districts of the northern island. So load the area of interest shape file and plot it.
area_of_interest = gpd.read_file(r'geospatial_data/Shapefiles/area_of_interest.shp')
area_of_interest.plot()
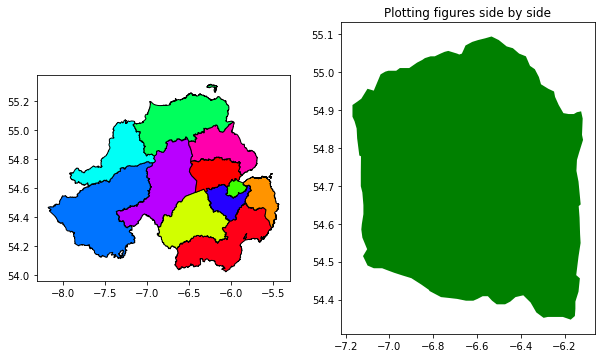
How to Plot Information from Multiple Files
We will learn how to analyze two files in the same plot or plot the information from the same file but with different representations side by side or one after another. We can also define it as plotting information from different sources in a single plot.
#plotting the figure side by side
fig, (ax1, ax2) = plt.subplots(ncols=2, figsize=(10, 8))
districts.plot(ax=ax1, cmap='hsv', edgecolor='black', column='district')
area_of_interest.plot(ax=ax2, color='green')
plt.title("Plotting figures side by side")
Plot two figures one after the other you need to define N-rows instead of defining N-columns that give you a resultant plot in an up-down manner.
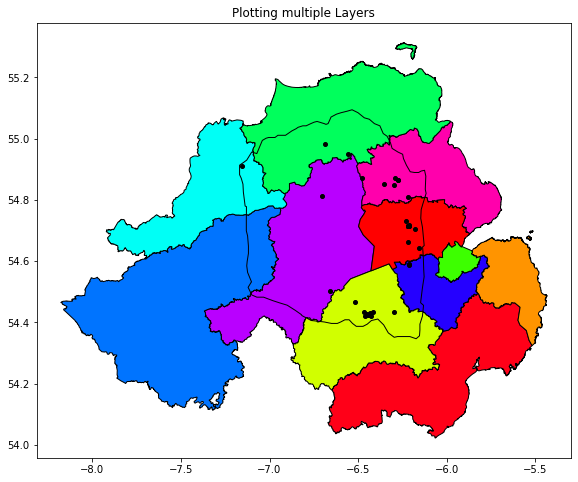
Plotting Multiple Layers
Layers simply mean to plot multiple layers in a single plot. Above the two plots separated in one single diagram means they have different axis but here to plot different plots on single axes.
#plotting multiple layers
fig, ax = plt.subplots(figsize=(10, 8))
districts.plot(ax=ax, cmap='hsv', edgecolor='black', column='district')
area_of_interest.plot(ax=ax, color='green')
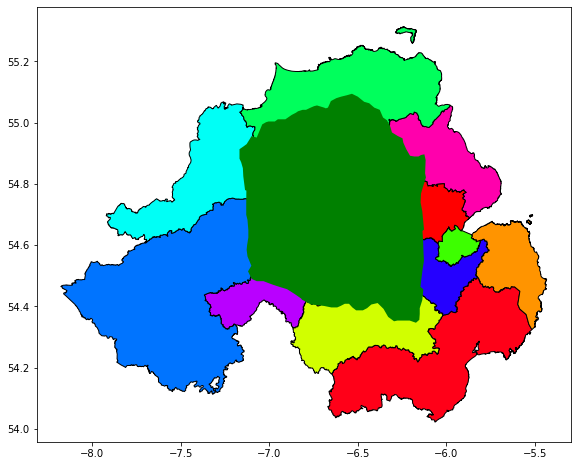
You can observe that the second area of interest layer hides the first layer so we can define the color attribute to None and use edge color. we are not limited to 2 layers and can add as many as we want. we have an ATM shape file in the dataset and we can draw its layer to know where different ATMs are located.
#plotting multiple layers
fig, ax = plt.subplots(figsize=(10, 8))
districts.plot(ax=ax, cmap='hsv', edgecolor='black', column='district')
#second layer of area of interest
area_of_interest.plot(ax=ax, color='none', edgecolor='black')
#third layer to ATMs
atms = gpd.read_file(r'geospatial_data/Shapefiles/atms.shp')
atms.plot(ax=ax, color='black', markersize=16)
plt.title("Plotting multiple Layers")
plt.show()
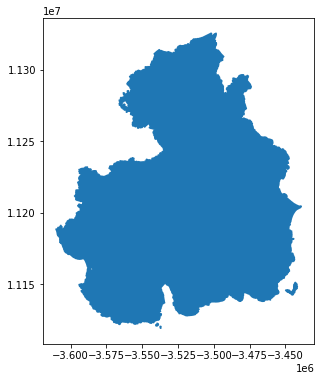
Working with Projections in GeoPandas
In this case, the coordinate reference system that all of these layers are using is basically a geographic coordinate reference system. So the reason that you are able to plot these things accurately in a special sense is that it contains a predefined coordinate reference system. If we check the coordinate reference system of our data then it is EPSG 4326 and working in different situations and GIS you will find a situation where you are required to work with different coordinate reference systems depending on need. For example, we have to calculate the area of each of these attributes, and the area is calculated in meter square or kilometers while these layers are having a geographic coordinate reference system such as WGS 1984. You are going to get the computation in decimal points so we will look at how to reproject the geoPandas geo DataFrame from one coordinate reference system to another. To demonstrate we will reproject the district layers from EPSG 4326 which is WGS 1984 into a projected coordinate system which is quite frequently used in the UK and the coordinate reference system we shall be converting is EPSG 32629.
#working with projections
new_districts = districts.to_crs(epsg=32629)
new_districts.plot(figsize=(10, 8))
You can visually observe the projected coordinate reference system that how it has visually changed and on the X and Y axis, the units are in meters. Now you can plot the districts and multiple layers on reprojected geoPandas geo DataFrame.
Top 7 Geoprocessing Applications of GeoPandas Library
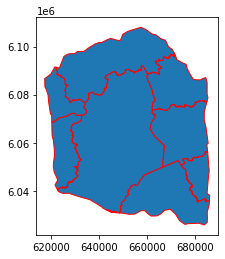
1. Find Intersect two layers
Intersect two layers basically means to find the common area between both the layers. In our dataset, we will find how many districts lie in our area of interest.
districts_in_aoi = gpd.overlay(districts, area_of_interest, how = 'intersection')
districts_in_aoi.plot(edgecolor = 'red')
2. Find the Union of Two Layers
In the same way, we can find the Union of two layers which is used to analyze the complete area in a single plot.
#Union of two
union = gpd.overlay(districts, area_of_interest, how = 'union')
union.plot(edgecolor = 'red', figsize=(8, 6))

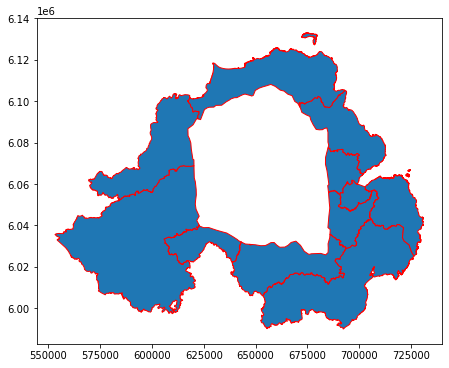
3. How to obtain the symmetric differences of polygons using GeoPandas?
The symmetric difference means finding a new set that has all the elements of either set but not the intersection part. It is the opposite of finding the intersection to removing the intersection.
#symmetric difference of polygon
sd = gpd.overlay(districts, area_of_interest, how = 'symmetric_difference')
sd.plot(edgecolor = 'red', figsize=(8, 6))
4. How to find the difference between Polygons?
The difference is simply subtracting the area of the second polygon from the first polygon and you can also form the vice-versa. The output will be approximately similar to symmetric difference output.
# difference of polygon
diff = gpd.overlay(area_of_interest, districts, how = 'difference')
diff.plot(figsize=(8, 6))
5. How to use dissolve geoprocessing operation using GeoPandas?
Dissolve operation basically eliminates the boundaries of enumeration units with a common value to create a much larger area holding the same common value between both polygons. we will perform it on union operation so we add one common column to union the geoPandas geo DataFrame and add value as one and dissolve it across the boundaries of common value. Dissolve operation is basically used to combine similar features within a data layer.
dissolve_sa = union.dissolve(by='common_column')
dissolve_sa.plot(figsize=(8, 6))
6. Creating a Buffer
Buffer means to measure the distance outward in the direction of an object. It can be done on all three types of data which is point, line, and area. We have already learned projection so again we will reproject the district dataset to a new coordinate reference system and create a buffer of 500 meters.
buffer_data = districts.to_crs(epsg = 24547)
buffer_500 = buffer_data['geometry'].buffer(distance=500)
buffer_500.plot(figsize=(10,6))
7. Obtaining Centroid of polygons
Centroid means to locate the center of each polygon and we can simply find it out using the centroid function. below is a demo to demonstrate the centroid of each district of the union plot.
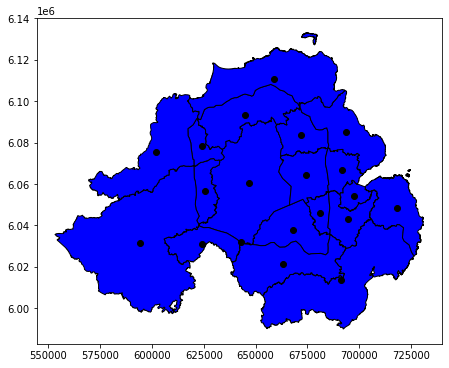
#obtain centroid of union
centroid = union['geometry'].centroid
fig1, ax1 = plt.subplots(figsize=(8, 6))
union.plot(ax = ax1, color='blue', edgecolor='black')
centroid.plot(ax = ax1, color = 'black')
Conclusion on Geospatial Data Analysis
GeoPandas is the most used Python library for GIS analysis after GIS software. The evolving developers today mostly prefer this type of tool for their analysis because it makes it easy to represent, and create BI reports. Geographic analysis is used by every business today in order to scale their sales and business across the world and capture the new market easily. Let us summarize the learnings from this tutorial with a few key points to remember and utilize the power of Geospatial data analysis.
- Geospatial data analysis deals with geographic data with reference to the earth’s surface to analyze, visualize, and find a solution to a particular problem which may include any event, city, town, district, country, or zone.
- There is various software for GIS like QGIS, ArcGIS, etc. And there are different libraries in python that extend their functionalities and a combined and a vast range of GIS applications and functionalities are provided by the GeoPandas Python package.
- GeoPandas is an open-source library that extends the functionality of Pandas library and helps you in reading, writing, and visualizing the vector or polygon data. It does not end here but you can read data from shapefiles, geo packages, geo-JSON, and other common file-based geospatial storage formats.
- How data preprocessing and transformation are done using pandas of structured data the same can be done of vector data and visualize it using GeoPandas.
- GeoPandas supports all aggregate functions, geographic analysis functions, and transformation functions for easy visualization and we have performed some of the operations like intersection, union, coordinate reference system, finding centroid, etc.
The media shown in this article is not owned by Analytics Vidhya and is used at the Author’s discretion.
I am a software Engineer with a keen passion towards data science. I love to learn and explore different data-related techniques and technologies. Writing articles provide me with the skill of research and the ability to make others understand what I learned. I aspire to grow as a prominent data architect through my profession and technical content writing as a passion.


