How would you distinguish between best, good and worst analyst from a group of analysts?
I would simply provide them same problem and data set and ask them to create a predictive model out of it.
Why is this a sure shot test?
This is the core of any analysis or any data mining activity. The degree to which an analyst is able to bring out insights and trends is what differentiates a good analyst from a bad one. This is the sole idea on which competitions such as the ones running on Kaggle are built. In larger scheme of things, it is this ability to extract information from data, which differentiates companies like Google, Amazon and Capital One from their competitors.
[stextbox id=”section”]Steps in creating competitive advantage while building predictive models: [/stextbox]
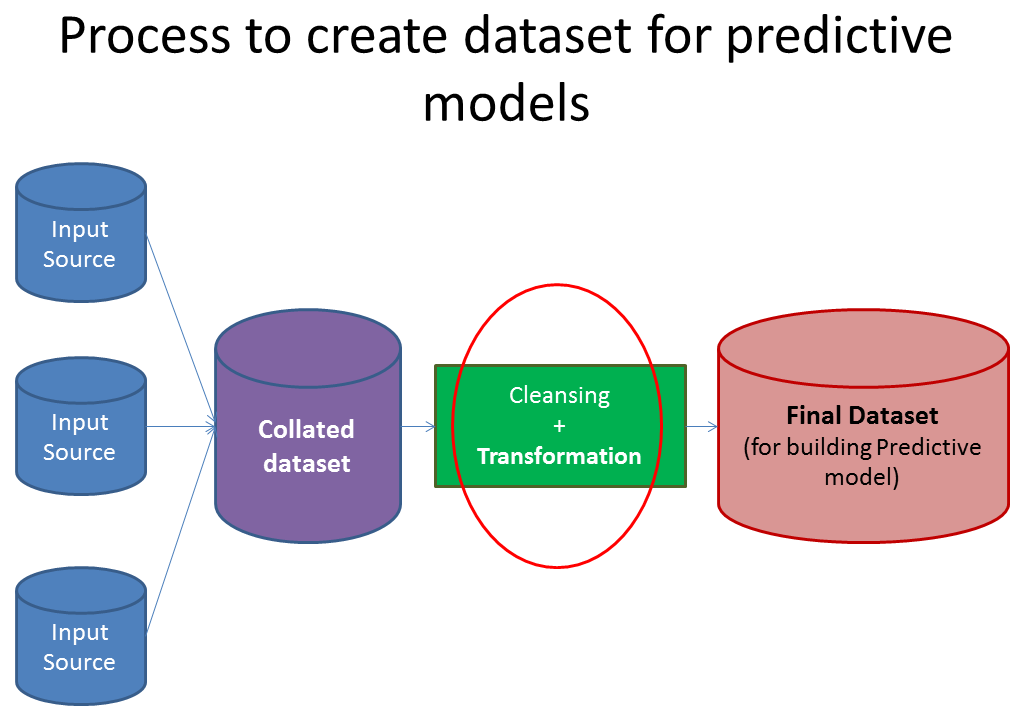
There are 2 key steps involved every time you try and create this competitive advantage:
- Cleansing and transforming datasets to create a comprehensive data set which captures all possible hypothesis
- Choosing the right set of predictive modeling tools and techniques which work on the data set created in last step and bring out insights
Both the steps in this process are equally important. We’ll focus on the first step in this article and discuss step 2 at a later date.
Building a comprehensive data set takes time and effort. The more time you can spend in transforming variables and extracting information, the better your model would be expected to perform. You can not and should not rely entirely on your tools to identify trends, insights or relationships.
This article addresses a situation which we face on a daily basis as analysts. How do we extract maximum information from a defined data set? By no means, this is an exhaustive list of extracting every possible information. But, it is good enough to get you thinking on the right track. If you have any other thoughts / practices which you use to extract more information about the variables, please add them in comments
[stextbox id=”section”]1. Create variables for difference in date, time and addresses[/stextbox]
While you might be using date and time values on their own, you can create new variables by considering differences in dates and time. Here is an example hypothesis: An applicant who takes days to fill in an application form is likely to be less interested / motivated in the product compared to some one who fills in the same application with in 30 minutes. Similarly, for a bank, time elapsed between dispatch of login details for Online portal and customer logging in might show customers’ willingness to use Online portal.
Another example is that a customer living closer to a bank branch is more likely to have a higher engagement than a customer living far off.
[stextbox id=”section”]2. Create new ratios and proportions[/stextbox]
Instead of just keeping past inputs and outputs in your dataset, creating ratios out of them might add a lot of value. Some of the ratios, I have used in past are: Input / Output (past performance), productivity, efficiency and percentages. For example, in order to predict future performance of credit card sales of a branch, ratios like credit card sales / Sales person or Credit card Sales / Marketing spend would be more powerful than just using absolute number of card sold in the branch
[stextbox id=”section”]3. Apply standard transformations[/stextbox]
By looking at variations and plots of a variable along with output, you can see if applying basic transformations on variables creates a better relationship. Most commonly used transformations include Log, exponential, quadratic and trignometric variations. For example, Log(Marketing spend) might have a more representable relationship with Sales as compared to absolute Marketing spend.
[stextbox id=”section”]4. Include effect of influencer[/stextbox]
Influencer can impact on the behaviour of your study significantly. Influencer could be of various form and sizes. It could be an employee of your Organization, agent of your Organization or a customer of your Organization. Bringing the impact of these related entities can improve the models significantly. For example, a loan initiated by a sub-set of brokers (and not all brokers) might be more likely to be transferred to a different entity after the lock-in period. Similarly, there might be a sub set of Sales personnel involved who do a higher cross-sell to their customers.
[stextbox id=”section”]5. Check variables for seasonality and create the model for right period[/stextbox]
A lot of businesses face some kind of seasonality. It could be driven by tax benefits, festive season or weather. If this is the case, you need to make sure that the data and variables are chosen for the right period. This article can give you more details on how to tackle effects of seasonality while modeling.
What do you think of these manipulations? Are there some other transformations which you use while creating a predictive model? In case there are, please add them in the comments below
If you like what you just read & want to continue your analytics learning, subscribe to our emails or like our facebook page.
Kunal Jain is the Founder and CEO of Analytics Vidhya, one of the world's leading communities of Al professionals. With over 17 years of experience in the field, Kunal has been instrumental in shaping the global Al landscape. His expertise spans diverse markets, from developed economies like the UK to emerging ones like India, where he has successfully led and delivered complex data-driven solutions. As a recognized thought leader, Kunal has empowered countless individuals to realize their Al ambitions through his visionary approach to Al education and community building. Before founding Analytics Vidhya, Kunal earned both his undergraduate and postgraduate degrees from IIT Bombay and held key roles at Capital One and Aviva Life Insurance across multiple geographies. His passion lies at the intersection of analytics, Al, and fostering a thriving community of data science professionals.


Hi Kunal, Is it possible to give a single link for all related articles. I am following AV for sometime and got to this article only thru the link provided by Sunil's article on variable creation. The recommended article section (above ) for this article includes none of those "Data Cleaning & transformation" articles by Sunil - which are very relevant to this one (though they are published later ) Aggregating all related articles under one header and doing it as a ongoing activity - would be very helpful for followers
Hi Kunal, Could you please provide article on Outlier/Anamoly detection with python library like Isolation random forest , one class svm, LOF.