Introduction
We use linear or logistic regression technique for developing accurate models for predicting an outcome of interest. Often, we create separate models for separate segments. To judge their effectiveness, we even make use of segmentation methods such as CHAID or CRT.
But, is that necessary ? Can’t we create a single model and enable it with some segmentation variable as an input to the model ?
May be, we could. Particularly because, creating separate model for separate segments may be time consuming and not worth the effort. But, creating separate model for separate segments may provide higher predictive power.
In this article, not only I’ve given an answer to the question above, but have also shared a perfect guideline for doing optimal segmentation for model development. Furthermore, this article also explores the possibilities of leveraging a segment model approach using complex techniques like stochastic gradient boosting or random forest into a simple logistic or linear regression framework (albeit to a very limited extent).
Doing this, brings the essence of interaction effects in modeling process and replicated the advantages of complex techniques stated above.

What is Segmentation ?
I could take you down in the depth of marketing to explain this concept. But, why to complicate things if they could be made simpler?
So, I define Market Segmentation as,
“Dividing the target market or customers on the basis of some significant features which could help a company sell more products in less marketing expenses.”
Companies have limited marketing budgets. Yet, the(marketing team) is expected to makes large number of sales to ensure rising revenue & profits. In limited marketing budgets, how is it made possible? Answer is, using segmentation.
Let’s move a step back and understand how do companies create a product which people buy.
Actually, a product is created in two ways –
- Create a product after analyzing (research) the needs and wants of target market – For example: Computer. Companies like Dell, IBM, Microsoft entered this market after analyzing the enormous market which this product upholds.
- Create a product which evokes the needs & wants in target market – For example: iPhone. Nobody knew they will need a touch screen phone, until Steve Jobs made them realize what they are deprived of!
Once the product is created, the ball shifts to the marketing team’s court. As mentioned above, they make use of market segmentation techniques. This ensures the product is positioned to the right segment of customers with high propensity to buy.
Techniques of Segmentation
There are two broad set of methodologies for segmentation: Objective (supervised) and Non-Objective (unsupervised) segmentation methodologies. As the name indicates, a supervised methodology requires the objective to be stated as the basis for segmentation.
Given below are some examples of objective and non-objective approaches.
Objective Segmentation
- Segmentation to identify the type of customers who would respond to a particular offer
- Segmentation to identify high spenders among customers who will use the e-commerce channel for festive shopping
- Segmentation to identify customers who will default on their credit obligation for a loan or credit card
Non-Objective Segmentation
- Segmentation of the customer base to understand the specific profiles which exist within the customer base so that multiple marketing actions can be personalized for each segment
- Segmentation of geographies on the basis of affluence and lifestyle of people living in each geography so that sales and distribution strategies can be formulated accordingly
- Segmentation of web site visitors on the basis of browsing behavior to understand the level of engagement and affinity towards the brand
Hence, it is critical that the segments created on the basis of an objective segmentation methodology must be different with respect to the stated objective (e.g. response to an offer).
However, in case of a non-objective methodology, the segments are different with respect to the “generic profile” of observations belonging to each segment, but not with regards to any specific outcome of interest.
The most common techniques used for building an objective segmentation are CHAID and CRT. Each of these techniques attempt to maximize the difference among segments with regards to the stated objective (sometimes referred to as the target for segmentation). CHAID uses a chi square statistic for the same while CRT uses Gini impurity.
The most common techniques for building non-objective segmentation are cluster analysis, K nearest neighbor techniques etc.
Each of these techniques uses a distance measure (e.g. Euclidian distance, Manhattan distance, Mahalanobis distance etc.) This is done to maximize the distance between the two segments. This implies maximum difference between the segments with regards to a combination of all the variables (or factors).
How to create segments for model development ?
1. Commonly adopted methodology
If you have thoroughly followed this article till here, we are now good to delve into the methodology adopted for creating segments. Of course, with the sole objective of building separate models for each segments.
Let us consider an example.
Here we’ll build a logistic regression model for predicting likelihood of a customer to respond to an offer. A very similar approach can also be used for developing a linear regression model. I’ve discussed it in the following section.
Logistic regression: It uses 1 or 0 indicator in the historical campaign data, which indicates whether the customer has responded to the offer or not.
Usually, one uses the target (or ‘Y’ known as dependent variable) that has been identified for model development to undertake an objective segmentation. Remember, a separate model will be built for each segment. A segmentation scheme which provides the maximum difference between the segments with regards to the objective is usually selected. Below is a simple example of this approach.
Fig-1: Sample segmentation for building a logistic regression – commonly adopted methodology
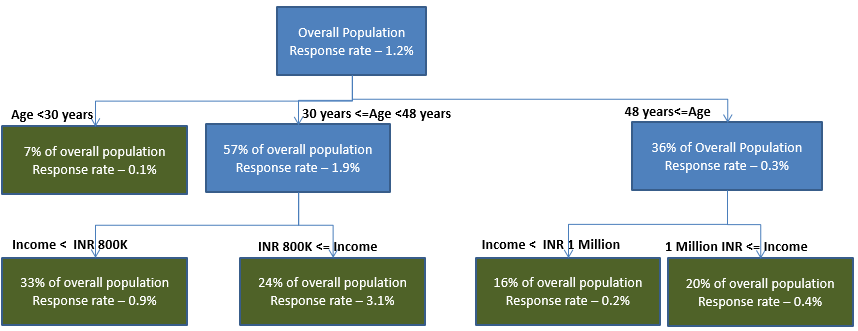
The above segmentation scheme is the best possible objective segmentation developed, because the segments demonstrate the maximum separation with regards to the objectives (i.e. response rate).
In the above tree, each separation should represent a statistically significant difference between the nodes with respect to the target. If a CHAID algorithm is used for developing the segmentation tree, then Chi Square value for each separation should be significantly different from zero (as measured by the “p” value of the separation).
In addition, it is the common business intuition (which may not always have a sound statistical rationale), to develop separate models if the difference in response rates between adjacent node is at least 30% (e.g. if the response rate in a particular node is 0.7% and the same for the adjacent node is 0.5% then the difference in response rate is ~30%)
The commonly adopted approach would suggest that one should build separate models for each of the terminal (or end) nodes, which have been depicted in green in Fig-1. But, is this the best approach from a modeling perspective? To answer that question, we need to find out a measure for evaluating a segmentation scheme from a modeling perspective.
The most effective measure for evaluating a segmentation scheme for the purpose of building separate models is the lift in predictive power that can be achieved by building segmented models. The following example is used to illustrate the same.
Let us assume that a logistic model is developed on the entire population to predict the likelihood of response.
Let us designate this as Model-1 (mostly analysts describe this as the parent model), let the Gini for this model be 0.57. Now as part of the segmented model development approach, five separate models are built, one for each end node (mostly analysts describe them as child models).
- Model-2.1 logistic model built for predicting response for the segment “age less than 30”
- Model-2.2 logistic model built for predicting response for the segment “age between 30 and 48 and income less than INR 800K”
- Model-2.3 logistic model built for predicting response for the segment “age between 30 and 48 and income greater than or equal to INR 800K”
- Model-2.4 logistic model built for predicting response for the segment “age more than 48 and income less than INR 1 Million”
- Model-2.5 logistic model built for predicting response for the segment “age more than 48 and income greater than or equal to INR 1 Million”
After building 5 separate models, the score or the predicted probability is calculated for each observation (or record) and the 5 data sets (for each end node) are appended.
The Gini of the combined data set is compared with the Gini of model-1. Then, the ratio of the two is designated as the lift in predictive power. For instance, if the Gini of the combined data set is 0.6, then the lift will be 1.05. It can be seen that, though segmentation is the best possible objective segmentation, yet it provides only 5% extra lift in predictive power.
Let us find out why this may be the case. It should be noted that, when one is developing a linear model, the lift in Adjusted R Square should be considered instead of lift in Gini.
While building the overall model (Model-1), one can always use appropriate dummy variables to represent the segmentation. For instance, one can use the following dummies (it should be noted that due to degree of freedom constraint there will be one less than all possible number of dummies)
- Dummy-1: Age less than 30 then 1 else 0
- Dummy-2: Age between 30 and 48 then 1 else 0
- Dummy-3 Income less than INR 800K
- Dummy-4 Income between 800K and 1 Million
The predictive power of the model will be even better if one uses dummies to replicate the segmentation tree
- Dummy-1: age less than 30
- Dummy-2: age between 30 and 48 and income less than INR 800K
- Dummy-3: age between 30 and 48 and income greater than INR 800K
- Dummy-4: age more than 48 and income less than INR 1 Million
These dummies would provide the same differentiation in response rate as that of the five individual segments. Hence, it can be seen that the differentiation in response rate which is provided by the segmentation can easily be replicated by using a set of dummy variables in an overall regression model.
However, this is not the complete explanation behind the low lift in predictive power. It is also important to consider the set of segmented models or the child models. Fig-2 provides the list of variables in the child models.
The variables in each model are ordered in accordance to their predictive strength (as measured by the Wald Chi Square and the Standardized Betas). The same color has been used to depict a particular variable across segments so as to make the comparison easier.
Fig-2: Variables across the 5 child models
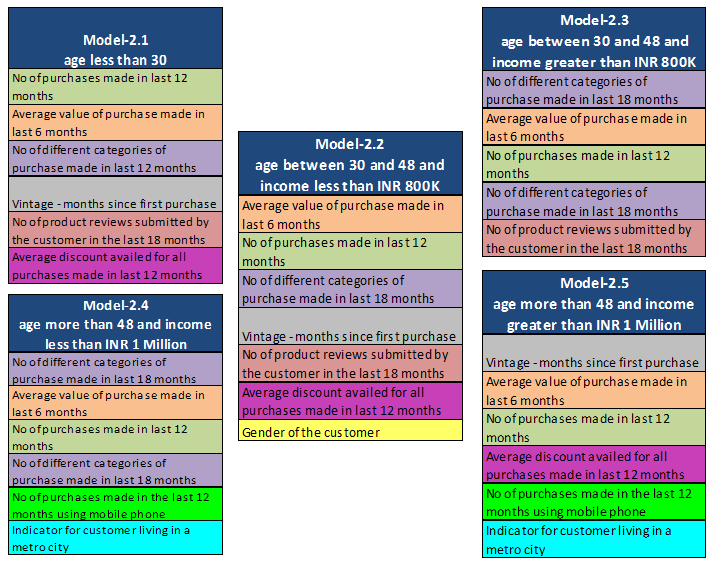
It can be observed that the variables in each of the five child models are quite similar, though the relative ordering of the variables is slightly different. This implies that the drivers of response are similar across segments. In addition, if one considers the predictive pattern of a particular variable across segments, one can observe something even more interesting.
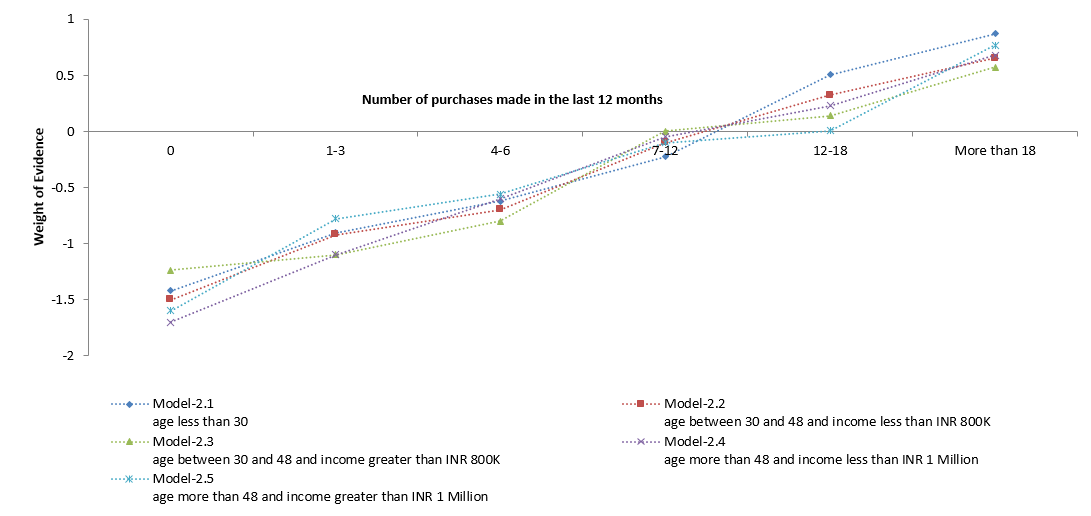
Fig-3 depicts the predictive pattern for the variable “Number of purchase in the last 12 months”. For depicting the predictive pattern, the Weight of Evidence (WoE) has been plotted.
Weight of Evidence is a common measure used for understanding if a particular range of value for a variable has a relatively higher or lower concentration of the desired target. A positive value of WoE indicates that there is a higher concentration of the target and vice-versa.
In this case, for higher values of number of purchases, one observes a higher WoE; indicating a relatively higher concentration of the respondents. While building a linear model, the average value of the target across each range of the variable should be used for understanding the predictive pattern.
A visual inspection of the graph reveals that though the individual WoEs are different across the segments, yet the trend is very similar. This implies that the predictive pattern of the variable is same across segments. Therefore, the impact of variable in overall model is not very different as compared to the segment wise impact.
In other words, it means that there is no interaction effect between the segmenting variables (i.e. age and income) aJnd the predictor variable ““Number of purchase in the last 12 months”. Hence, the segmentation is not expected to yield any benefit with regards to lift in predictive power.
It should also be noted that in this case the information value of the variables are also similar across segments. In case of a linear model, partial R square can be used instead of information value. If this is the case for most of highly predictive variables, then segmentation would add limited value to the overall predictive power.
Fig-3: Predictive Pattern of the Variable “Number of purchase in the last 12 months” Across the Five Segments
2. The Appropriate Methodology
In order to harness the interaction effect between the segmenting variables and the predictor variables, it is important to devise a segmentation scheme where predictors and predictive patterns of the variables are different across segments.
This will help one to create a scenario where the predictive power of the segmented models is higher than the predictive power of the overall model. Fig-4 provides an alternate segmentation scheme for the problem described earlier.
Fig-4: Sample segmentation for building a logistic regression – alternate methodology
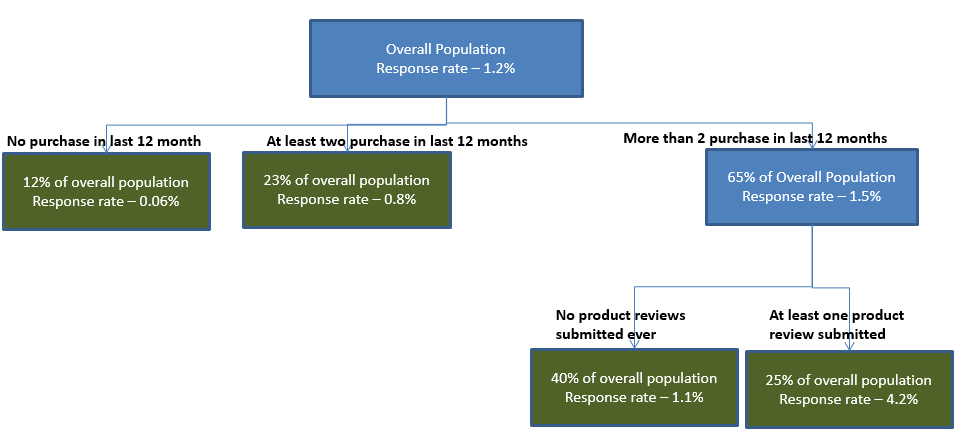
In this case, one would develop the following segmented models (child models):
- Model-3.1 logistic model built for predicting response for the segment “No purchase in the last 12 months”
- Model-3.2 logistic model built for predicting response for the segment “At least 2 purchases in the last 12 months”
- Model-3.3 logistic model built for predicting response for the segment “More than 2 purchase in last 12 months and No product reviews submitted ever”
- Model-3.4 logistic model built for predicting response for the segment “More than 2 purchase in last 12 months and At least one product review submitted”
The variables in the child models have been depicted in Fig-5. As in earlier case, the common variables have been highlighted in same color. It can be observed that in this case, the extent of overlap of the variables between segments is very limited. Therefore, each segment represents a homogeneous set of customers for whom the driver of response are almost completely different.
Hence, in this case the Gini of the segmented system of models is significantly higher compared to the Gini of the overall model. This segmentation provides a significantly superior predictive power which is created due to the interaction of the segmenting variables and the predictor variables.
Fig-5: Variables across the 4 child models
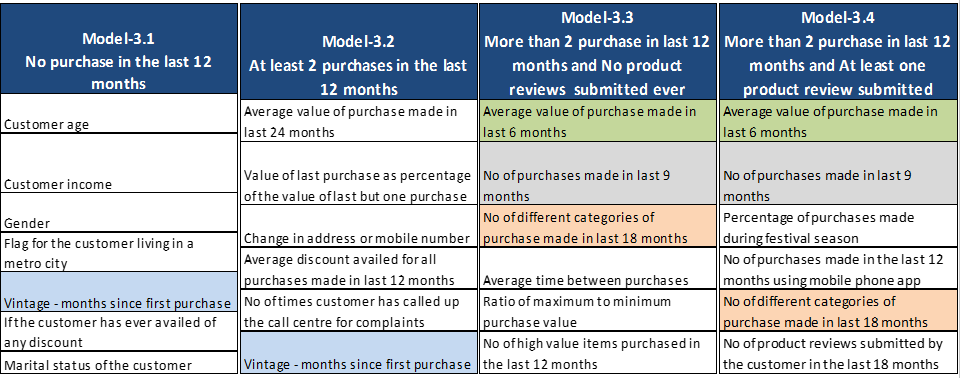
Fig-6: Predictive Pattern of the Variable “Number of purchase in the last 24 months” Across the Five Segments
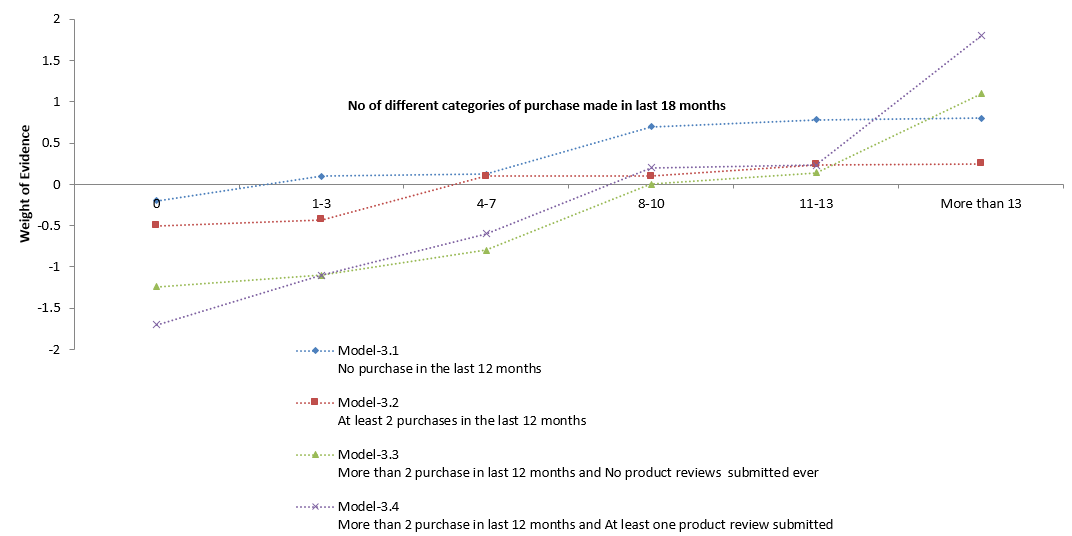
In this case, one can observe that the predictive pattern of a particular variable is significantly different across segments. The lines in Fig-5 are much more dispersed and look different from one another as compared to Fig-3, which indicates that the predictive pattern of the variable is different across segments.
Therefore the impact of the variable in the overall model is quite very different as compared to the segment wise impact. In other words, it means that there is significant interaction effect between the segmenting variables and the predictor variable “No. of different categories of purchase made in last 18 months”.
Hence, the segmentation is expected to produce superior lift in predictive power. It should also be noted that in this case the information value of the variables are also different across segments.
Using Machine Learning for Segmentation
There is another interesting aspect to it. For segmentation, it is also good to consider machine learning algorithms based on multiple trees. Multiple Additive Regression Tree, Random Forest and Stochastic Gradient Boosting are techniques that use a multitude of trees and an ensemble of the same for making predictions.
For instance if one considers stochastic gradient boosting, at a very simplistic (and possibly amateurish level), the method involves building an ensemble of trees wherein the residual from the first tree is used as the target for the second tree and so on till no further improvement in predictive power is observed.
Each tree in this case consists of a few nodes and ensures that it does not over fit the data. In reality, each of these tree is expected to capture the interaction effect instead of fitting too closely to the target at hand. One can relate this philosophy (at a broad level) with the idea behind creation of segments for developing models, wherein the objective of the segmentation is not to achieve a closer fit with the target but to identify interaction effects.
In fact, a possible way of identifying the segments for developing separate models may involve considering the nodes of the first few trees in a stochastic gradient boosting ensemble of trees and consider if those are appropriate for building segmented models.
End Notes
In this article, we learnt the following aspects:
- While performing segmentation for the purpose of model development, one should strive to achieve a lift in predictive power and not merely differentiation with regards to the target of interest.
- Segmentation capture interaction effects, whereby the relative importance of the predictors or the predictive pattern changes across segments.
- The process of building such segmentations involve developing child models for each segment and investigating the variables that are selected in each of the child models.
- A graphical examination of the highly predictive variables across segments can also yield valuable insights. Therefore, the process requires iteration and careful analysis of the child models. Sole reliance on a CHAID or CRT algorithm may not yield the appropriate result. One must remember that the ultimate objective is to enhance the predictive power of the segmented system.
Did you find the article useful ? Have you used any of these techniques in your market segmentation process? Do share your opinions and suggestions in the comments section below.
About the Authors
Sandhya Kuruganti and Hindol Basu are authors of a book on business analytics titled “Business Analytics: Applications to Consumer Marketing”, recently published by McGraw Hill. The book is available on Flipkart and Amazon India/UK/Canada/US. They are seasoned analytics professionals with a collective industry experience of more than 30 years.


Hello. Great article. I wonder how did you go from the segmentation scheme in figure 1 to the segmentation scheme in figure 4?? Aditionally, according to the list of predictors in figure 5, the variable "Number of purchase in the last 24 Months" was not considered in any of the child models, so why do you use it in figure 6??
Hi Sandhya and Hindol This was a wonderful article on using segmentation as an input to a predictive model. I want to specifically clear my ignorance around the alternate technique where we would look to segment based on the predictive power difference across various segments of our predictors. Technically speaking I was thinking about using clustering technique for segmentation but now I believe that would not be a good idea. Do you suggest any specific methodology to implement the "Appropriate Methodology" as described by you? Again thanks for the article. This was a definite food for thought.
Good One