This article was published as a part of the Data Science Blogathon
Introduction
Spreadsheets or Excel is the foremost and most adaptive way of exploring a dataset. It can help in making necessary changes to the datatypes, creating new features, sorting data, and creating new features out of already available features.
Following the same lines, Mito is a Jupyter-Lab extension and Python library that makes it super easy to manipulate data in the spreadsheet environment with GUI support and much more. In this article cum guide, I will explain:
- How to properly set up Mito
- How to debug installation errors
- Usage of various features offered by the Mito
- How this library generates Python equivalent code for all the changes done on the dataset
Installing Mito
Mito is a Python Library and can be installed via the pip package manager. It requires Python 3.6 and above version. Also, Nodejs, which is a JavaScript runtime environment should be installed on your system.
I want to mention that you should install this package in a separate environment (virtual environment) to avoid any dependency error. Let’s go through the installation steps (run these commands in the terminal).
1. Create an environment
I am using Conda to create a new environment. You can also use Python’s “venv” for creating virtual environments.
conda create -n mitoenv python=3.8
2. Activate the environment
conda activate mitoenv
3. Install Mito via pip
pip install mitoinstaller
4. Run the Mito installer
python -m mitoinstaller install
This process will take a while to install and set up the Mito.
5. Start the Jupyter lab
jupyter lab
A quick fix
When you start the Jupyter lab, you may get this type of error:
.
.
.
File "c:userslenovoanaconda3envsmitoenvlibsite-packagesjupyter_corepaths.py", line 387, in win32_restrict_file_to_user
    import win32api
ImportError: DLL load failed while importing win32api: The specified module could not be found.
To fix this error, simply run the following command:
pip install --upgrade pywin32==225
If you face other difficulties, feel free to comment down below. I would be happy to assist.
MitoSheets Interface
In the Jupyter lab, create a new notebook and initialize the Mitosheet:
import mitosheet
mitosheet.sheet()
For the first time, you will be prompted to enter your email address for signup:
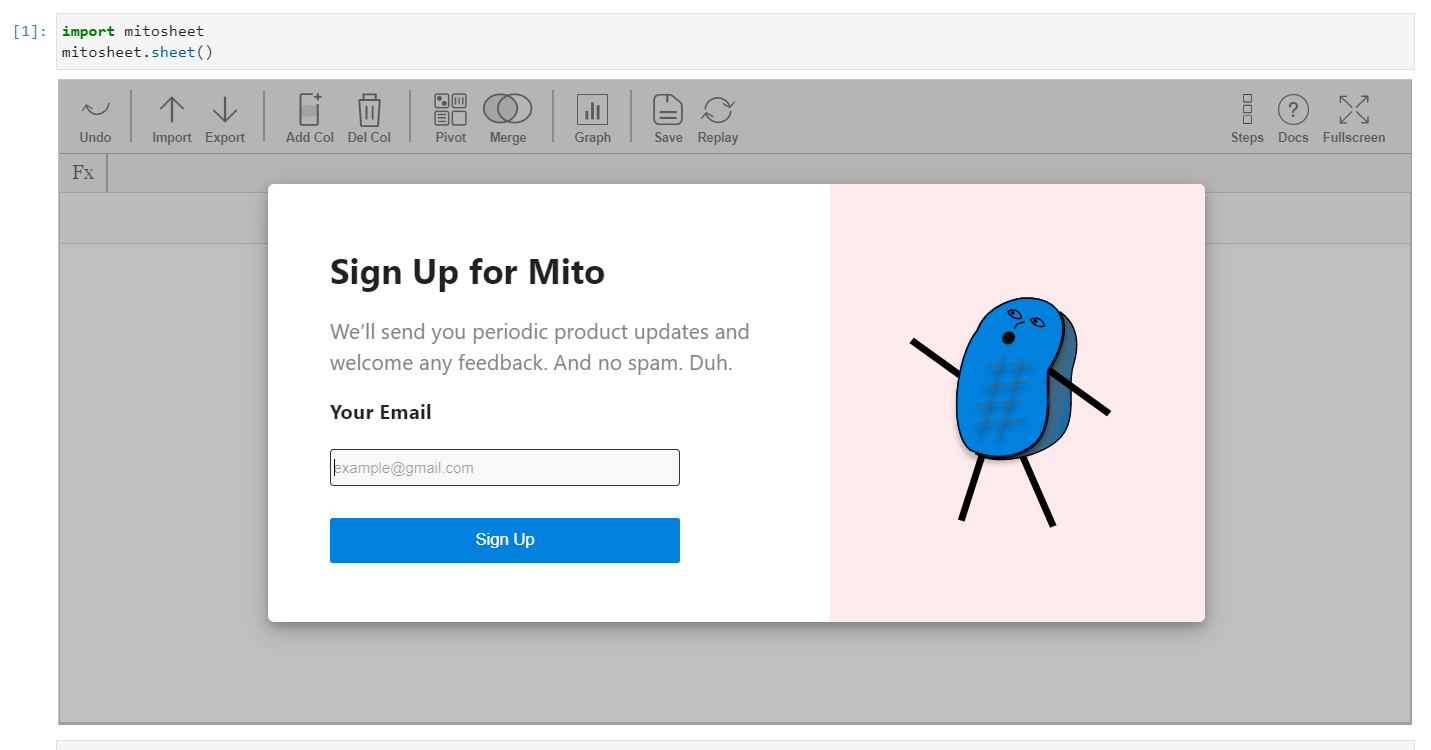
First-time setup screen (Screenshot from notebook)
After filling up the basics, you will be redirected to the GUI spreadsheet. Let’s discover all the features of this interface and discuss how the changes are converted to Python equivalent code.
Loading the Dataset
To load a dataset in MitoSheets, simply click on Import. Then you will have two options:
- Add a file from the current folder: This will list all the CSV files in the current directory and you will be able to select them from the dropdown menu.
- Add the file by the path of the file: This will add only that particular file.
See this in action:
If you look at the cell below this, you will find out that the Python equivalent code to import a dataset using Pandas has been generated with proper comments!
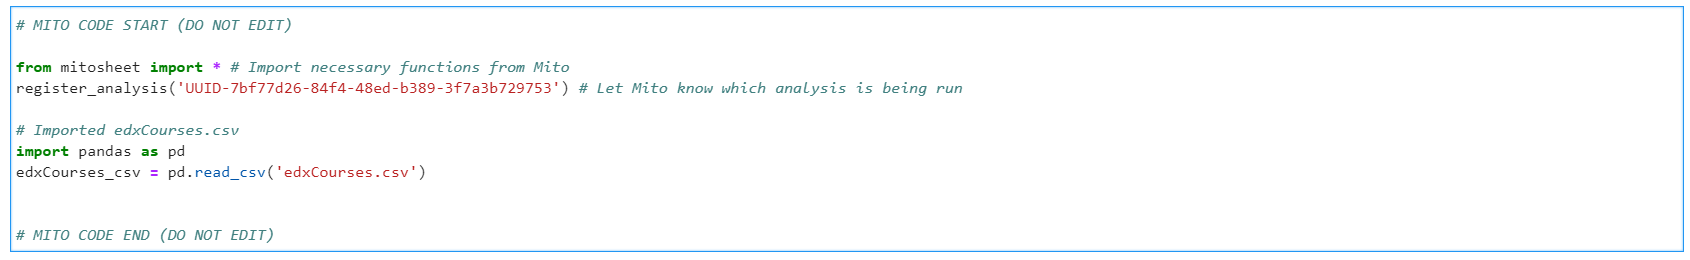
This is the power of Mito, every action you take in your Mitosheet will be converted to Python equivalent code! Let’s explore all the features of Mito in detail.
Adding and Deleting Columns
Just like in excel and spreadsheets, you can add a new column that might be created from the existing columns or features. To perform this action in Mito, simply click on the “Add Col” button. The column will be added next to the currently selected column. Initially, the column name will be an alphabet and all the values of the column will be zero.
To edit the contents of this new column,
- Click on the new column name (The allotted alphabet)
- A sidebar menu will pop up where you can edit the name of the column.
- To update the contents of the column, click on any cell of this column, and assign the value. You can either assign a constant value or create values out of the existing features of the dataset. For creating values from existing columns, directly call the column name with operators to be performed.
- The data type of the new column is changed according to the value assigned.
The GIF below describes all the things mentioned above:
Similarly, to delete any column,
- Select any column by clicking on it.
- Click on “Del Col” and that particular column will be deleted from the dataset.
The Python equivalent code with proper comments is generated in the next cell for the actions performed is:
# MITO CODE START (DO NOT EDIT)
from mitosheet import * # Import necessary functions from Mito
register_analysis('UUID-7bf77d26-84f4-48ed-b389-3f7a3b729753') # Let Mito know which analysis is being run
# Imported edxCourses.csv
import pandas as pd
edxCourses_csv = pd.read_csv('edxCourses.csv')
# Added column H to edxCourses_csv
edxCourses_csv.insert(7, 'H', 0)
# Renamed H to newCol in edxCourses_csv
edxCourses_csv.rename(columns={"H": "newCol"}, inplace=True)
# Set newCol in edxCourses_csv to =coursePrice + courseEnrollments
edxCourses_csv['newCol'] = edxCourses_csv['coursePrice'] + edxCourses_csv['courseEnrollments']
# Deleted column newCol from edxCourses_csv
edxCourses_csv.drop('newCol', axis=1, inplace=True)
# MITO CODE END (DO NOT EDIT)
Create Pivot Tables
A pivot table is an important excel function that summarizes the numeric variables based on one more categorical feature. To create such a table using Mito,
- Click on “Pivot” and select the source dataset (by default the CSV loaded)
- Select the rows, columns, and value column for the pivot table. You can also select the aggregation function for the values column. All the options such as sum, mean, median, min, max, count, and standard deviation are available.
- After selecting all the necessary fields, you will get a separate table containing the Pivot table implementation.
The GIF below demonstrates how to create a Pivot table for the “mean” aggregation function:
Generated Python code for this:
# MITO CODE START (DO NOT EDIT)
from mitosheet import * # Import necessary functions from Mito
register_analysis('UUID-a35246c0-e0dc-436b-8667-076d4f08e0c1') # Let Mito know which analysis is being run
# Imported edxCourses.csv
import pandas as pd
edxCourses_csv = pd.read_csv('edxCourses.csv')
# Pivoted edxCourses_csv into df2
pivot_table = edxCourses_csv.pivot_table(
    index=['courseOrganization'],
    values=['coursePrice'],
    aggfunc={'coursePrice': 'mean'}
)
# Reset the column name and the indexes
df2 = pivot_table.rename_axis(None, axis=1).reset_index()
# MITO CODE END (DO NOT EDIT)
Merging Two Datasets
Merging datasets is an essential part of data science projects. Generally, the datasets are divided among various tables so as to increase the accessibility and readability of information. Merging in Mitosheets is easy.
- Click on “Merge” and select the data sources.
- You need to specify the keys to which this merger should be done.
- You can also select the columns from the data sources to be retained after the merger. By default, all the columns will be retained in the merged dataset.
Python Equivalent:
# MITO CODE START (DO NOT EDIT)
from mitosheet import * # Import necessary functions from Mito
register_analysis('UUID-88ac4a92-062f-4ed8-a55d-729394975740') # Let Mito know which analysis is being run
# Imported Airport-Pets.csv, Zipcode-Data.csv
import pandas as pd
Airport_Pets_csv = pd.read_csv('Airport-Pets.csv')
Zipcode_Data_csv = pd.read_csv('Zipcode-Data.csv')
# Merged Airport_Pets_csv and Zipcode_Data_csv
temp_df = Zipcode_Data_csv.drop_duplicates(subset='Zip')
Airport_Pets_csv_tmp = Airport_Pets_csv.drop(['State', 'Division'], axis=1)
Zipcode_Data_csv_tmp = temp_df.drop(['Mean_Income', 'Pop'], axis=1)
df3 = Airport_Pets_csv_tmp.merge(Zipcode_Data_csv_tmp, left_on=['Zip'], right_on=['Zip'], how='left', suffixes=['_Airport_Pets_csv', '_Zipcode_Data_csv'])
# MITO CODE END (DO NOT EDIT)
Modifying Column Data types, sorting and filtering
You can change the existing columns data types, sort columns in ascending or descending order, or filter them via boundary conditions. The process to implement these steps in Mito is easy and can be done via the GUI itself by selecting the onscreen options.
- Click on the desired column
- You will be presented with a list of data types. You can choose any datatype from the dropdown according to your requirement and that data type will be applied to the whole column.
- Next, you can sort the data in ascending or descending order by selecting the provided choices.
- You can also filter your data with custom filters.
Python code:
# MITO CODE START (DO NOT EDIT)
from mitosheet import * # Import necessary functions from Mito
register_analysis('UUID-cc414267-d9aa-4017-8890-ee3b7461c15b') # Let Mito know which analysis is being run
# Imported edxCourses.csv
import pandas as pd
edxCourses_csv = pd.read_csv('edxCourses.csv')
# Changed coursePrice from int64 to float
edxCourses_csv['coursePrice'] = edxCourses_csv['coursePrice'].astype('float')
# Sorted coursePrice in edxCourses_csv in descending order
edxCourses_csv = edxCourses_csv.sort_values(by='coursePrice', ascending=False, na_position='first')
edxCourses_csv = edxCourses_csv.reset_index(drop=True)
# Filtered coursePrice in edxCourses_csv
edxCourses_csv = edxCourses_csv[edxCourses_csv['coursePrice'] >= 500]
edxCourses_csv = edxCourses_csv.reset_index(drop=True)
# MITO CODE END (DO NOT EDIT)
Graphs and Stats Generation
You can also generate graphs right in this extension without coding the plotting logic. By default, all the plots generated by this extension are made using Plotly. That means that plots are interactive and can be modified on the fly. One thing I noticed is that the code for graphs is not present in the next cell (Maybe developers push this in a later update)
There are two types of Graphs that can be generated using Mito:
1. By tapping the graphs button
You will be presented with a sidebar menu to make the selections for the type of graph and the corresponding axes to be selected.
2. By tapping the column name
When you tap the column name from the spreadsheet, the filters and sorting options are visible. But if you navigate to “Summary Stats”, a line plot or bar plot, depending upon the type of variable is displayed along with the summary of the variable. This summary changes for text and no text variables.
Save and Replay
All the transformations done on the dataset can be saved and used for other similar datasets. This takes the form of a macro or VBA in Excel. The same can be done via these functions too.

Screenshot from Author notebook
Backtracking all the Steps performed
This feature is the most interesting one. You can actually trace out all the transformations applied in the Mito-sheet. A list of all the operations is available with appropriate titles.
Also, you can view that particular step! This means that suppose you have changed some columns and then deleted them. You can step back to the time when it was not deleted.
You will also find this feature in Google’s Data Prep tool.
Conclusion
In this article, you got introduced to a new tool “Mito” – one-stop solution for implementing spreadsheet-like functions in a Python environment and getting the equivalent Python code for all the changes made. I explained how to install and debug the installation of Mito, all the features of this extension, and how to use them.
If you have any doubts, queries, or potential opportunities, then you can reach out to me via
1. Linkedin – in/kaustubh-gupta/
2. Twitter – @Kaustubh1828
3. GitHub – kaustubhgupta
4. Medium – @kaustubhgupta1828
The media shown in this article are not owned by Analytics Vidhya and are used at the Author’s discretion.
Kaustubh Gupta is a skilled engineer with a B.Tech in Information Technology from Maharaja Agrasen Institute of Technology. With experience as a CS Analyst and Analyst Intern at Prodigal Technologies, Kaustubh excels in Python, SQL, Libraries, and various engineering tools. He has developed core components of product intent engines, created gold tables in Databricks, and built internal tools and dashboards using Streamlit and Tableau. Recognized as India’s Top 5 Community Contributor 2023 by Analytics Vidhya, Kaustubh is also a prolific writer and mentor, contributing significantly to the tech community through speaking sessions and workshops.


Thank you very much for the mitosheet article Mr. Gupta. I have always wondered if I could find any software that works like mitosheet and now here it is. I will try it out. Regards Xavier