This article was published as a part of the Data Science Blogathon
AGENDA
- Introduction
- Machine Learning Pipeline
- Data Collection in ML
- Python Libraries used in Data Analysis
- Scipy
- Matplotlib
- Pandas
- Numpy
- Scipy
- Explanatory Data Analysis (EDA)
- Why do we need Data Analysis?
- Univariate Numerical Analysis
- Mean
- Median
- Percentile
- Standard deviation
- Other measures
- Bivariate Numerical Analysis
- Correlation
- Pearson Correlation
- Correlation
- Conclusion
Introduction:
“Data is the new oil” is a famous saying nowadays. So, How we can use this data to solve our business problems??
THINK!!
I hope you’re right 🙂
Yes, we can get some useful insights from the data to improve and solve our business problems. So again, HOW CAN WE GET USEFUL INSIGHT FROM DATA??
Yeah, by analyzing the data. So in this article, we are going to discuss the essential Statistical Data analysis techniques in Machine Learning.
After reading this article you will be able to draw valuable insights from your dataset by using statistical techniques.
Let’s get started.
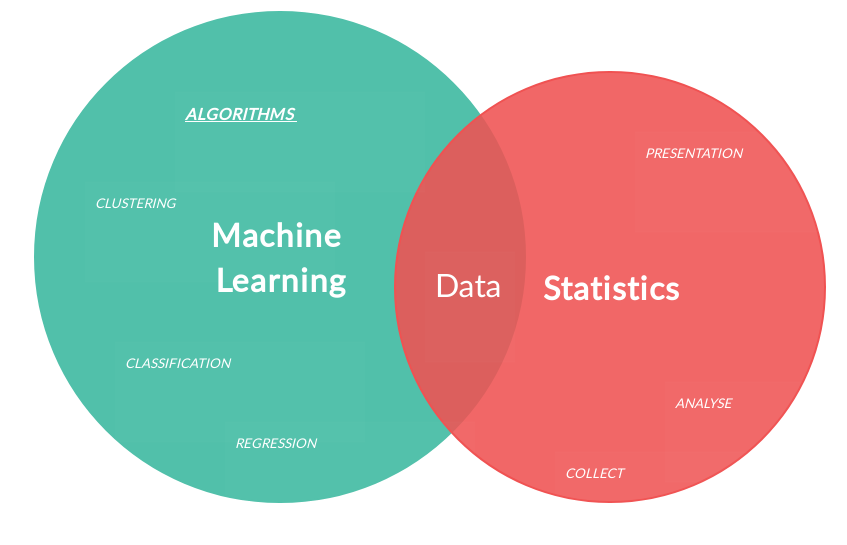
In Machine Learning, Data Analysis is the process of inspecting, cleansing, transforming, and modeling data with the goal of discovering useful information by informing conclusions and supporting decision making. It is used in many interdisciplinary fields such as Artificial Intelligence, Pattern Recognition, Neural Networks, etc…
Machine Learning Pipeline

Source: hub.packtpub.com
The machine learning pipeline is nothing but the workflow of the Machine Learning process starting from Defining our business problem to Deployment of the model. In the Machine Learning pipeline, the data preparation part is the most difficult and time-consuming one as the data is present in an unstructured format and it needs some cleaning. In this blog, we are going to dive deeper into the Data Analysis part using statistics!
Data collection in ML
As we all know 21th century is the known as ” Age of Data Abundance”. The collection of data is the collection of mosaic pieces. HOW WE ARRANGE THIS DATA TO GET USEFUL INSIGHTS IS WHAT MACHINE LEARNING PROVIDES US!!
Data can be obtained from various data sources such as
- APIs
- File
size - Database
- Videos/images/audios
CSV Format:
Comma Separated Values are in the form of text files. It used to represent the data in tabular format. Here, each line is a record and each record has multiple columns separated by Comma(delimiter).
Refer here to know how to convert comma-separated text file into excel format!!
Code:
import pandas as pd
dataset = pd.read_csv("filename.csv")
dataset.head(5)
Image 1

Python Libraries used in Data Analysis
SciPy
- SciPy
is the collection of open-source libraries, which helps to
organize our data for analysis. - There
are various libraries used namely,
Numpy
-
- Used
for scientific computing such as Numerical Analysis, Linear algebra, and
metric computation. - It
is essential for Machine Learning (ML) implementation
- Used
Code:
#importing numpy package
import numpy as np
#creating array
arr = np.array([0,1,2,3,"hi"])
print(arr)
#type of arr
print(type(arr))
#dimension of arr
print(arr.ndim)
#length of arr
print(len(arr))
Matplotlib
-
- Matplotlib
is the plotting library to produce quality figures such as histogram,
scatter plot etc… - Used
for Data visualization.
- Matplotlib
Code:
#importing matplotlib library
import matplotlib.pyplot as plt
#plotting values
plt.plot([1,2,3],[5,10,15])
#title
plt.title("Linear Relation", fontsize= 16)
#naming x and y axis
plt.xlabel("X axis", fontsize = 12)
plt.ylabel("Y axis", fontsize = 12)
plt.show()

Pandas
-
- Pandas
is an open-source library with High performance, easy-to-use
Data Structures, and Analysis tools for Python. - Data
Science works like Calculating statistics, cleaning data, etc… - It
is highly used in Data Mining and Preparation but less
in Data Modeling & Analysis.
- Pandas
Code:
#importing pandas library
import pandas as pd
dataset = pd.read_csv("filename.csv")
#defining dataframe from 2 series
data = { 'cars' : [5,2,3], 'bus':[3,4,0]}
#assigning indecies to row specific dataframe element
vehicles = pd.DataFrame(data, index = ['Sam','Rose', 'Bob'])
#getting information about the data
print(vehicles.info())
print(vehicles.loc['Bob'])

Explanatory Data Analysis( EDA)

Source: import.io
EDA is the approach for analyzing the dataset to summarise its main features. The dataset summaries can be of 2 types,
1. Numerical Summary: Numerical summaries are summaries in terms of Numbers. Ex: Mean( Average), Median, etc…It can be either
- Univariate – Measure relies only on one variable or
- Bivariate – measure relies on two variables.
2. Graphical Summary: Graphical summaries will be in the form of graphs. Ex: Histogram, Box-plot, etc…
Why do we need Data Analysis?
We need to analyze the data for the following reasons:
- Identifying dataset distribution
- Choosing the right Machine Learning algorithm
- Extracting Right features
- Evaluate our ML algorithm and presenting our results
Univariate Numerical Analysis
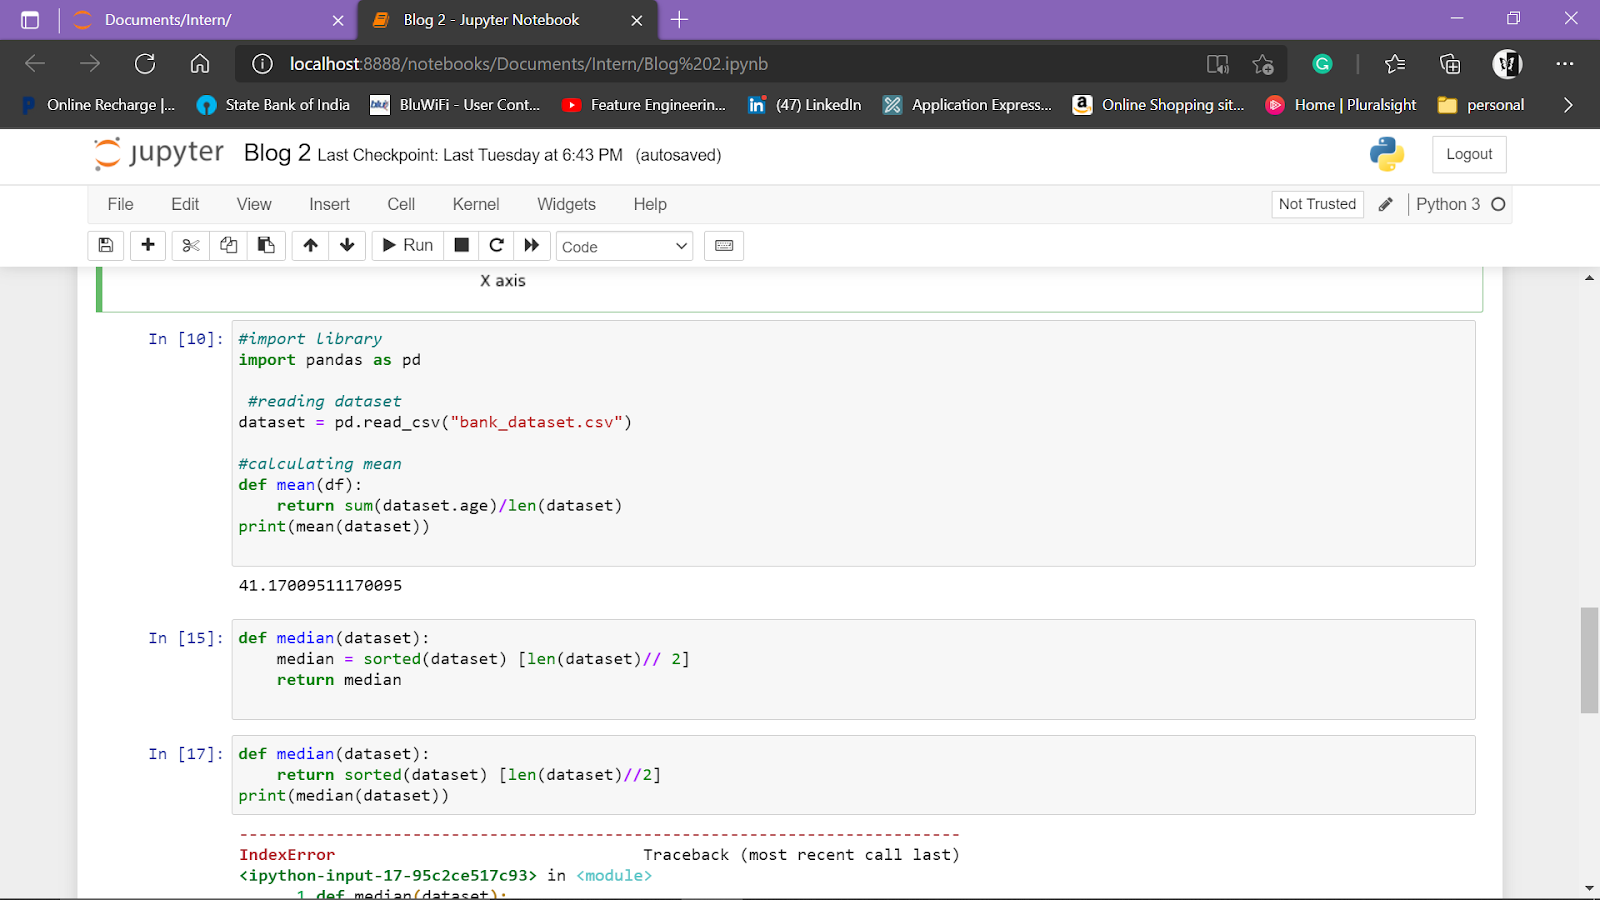
Mean
Mean is defined as the ratio of the sum of all values to the total number of values. Mean is also called as Average of the dataset
Mean = SUM OF ALL VALUES / TOTAL NUMBER OF VALUES
| PROS | CONS |
| Consider all values | Mean is sensitive for extreme values |
Code:
#import library
import pandas as pd
#reading dataset
dataset = pd.read_csv("bank_dataset.csv")
#calculating mean
def mean(df):
    return sum(dataset.age)/len(dataset)
print(mean(dataset))
Note:
DO NOT TRUST Mean!!
Median
Median is the value separating the lower half from the upper half of the data.
Steps:
1. Arrange the data in Ascending order
2. If the total number of values is :
- ODD: Take the middle number as Median
- EVEN: Take the average of the middle two numbers. (ie) Median = (Num 1 + Num 2)/ 2
| PROS | CONS |
| Insensitive to Extreme Values | Does not consider dataset distribution |
Code:
def median(dataset):
    median = sorted(dataset) [len(dataset)// 2]
    return median

Percentile
Percentile is the measure indicating a certain percentage of the dataset is below the value!
25%, 50% (median), 75%
| PROS | CONS |
| More expensive | Multiple measures |
Code:
data = [13,14,15,16,20,95,66,88]
#25th percentile
sort_data = sorted(data)
index1 = len(sort_data)*.25
print(index1)
#50th percentile
sort_data = sorted(data)
index2 = len(sort_data)*.50
print(index2)
#75th percentile
sort_data = sorted(data)
index3 = len(sort_data)*.75
print(index3)
Image 7
Since all the above methods do have some pros and cons. These methods do not give us the exact result we are looking for. SO WHAT TO DO THEN??? LET’S SEE.
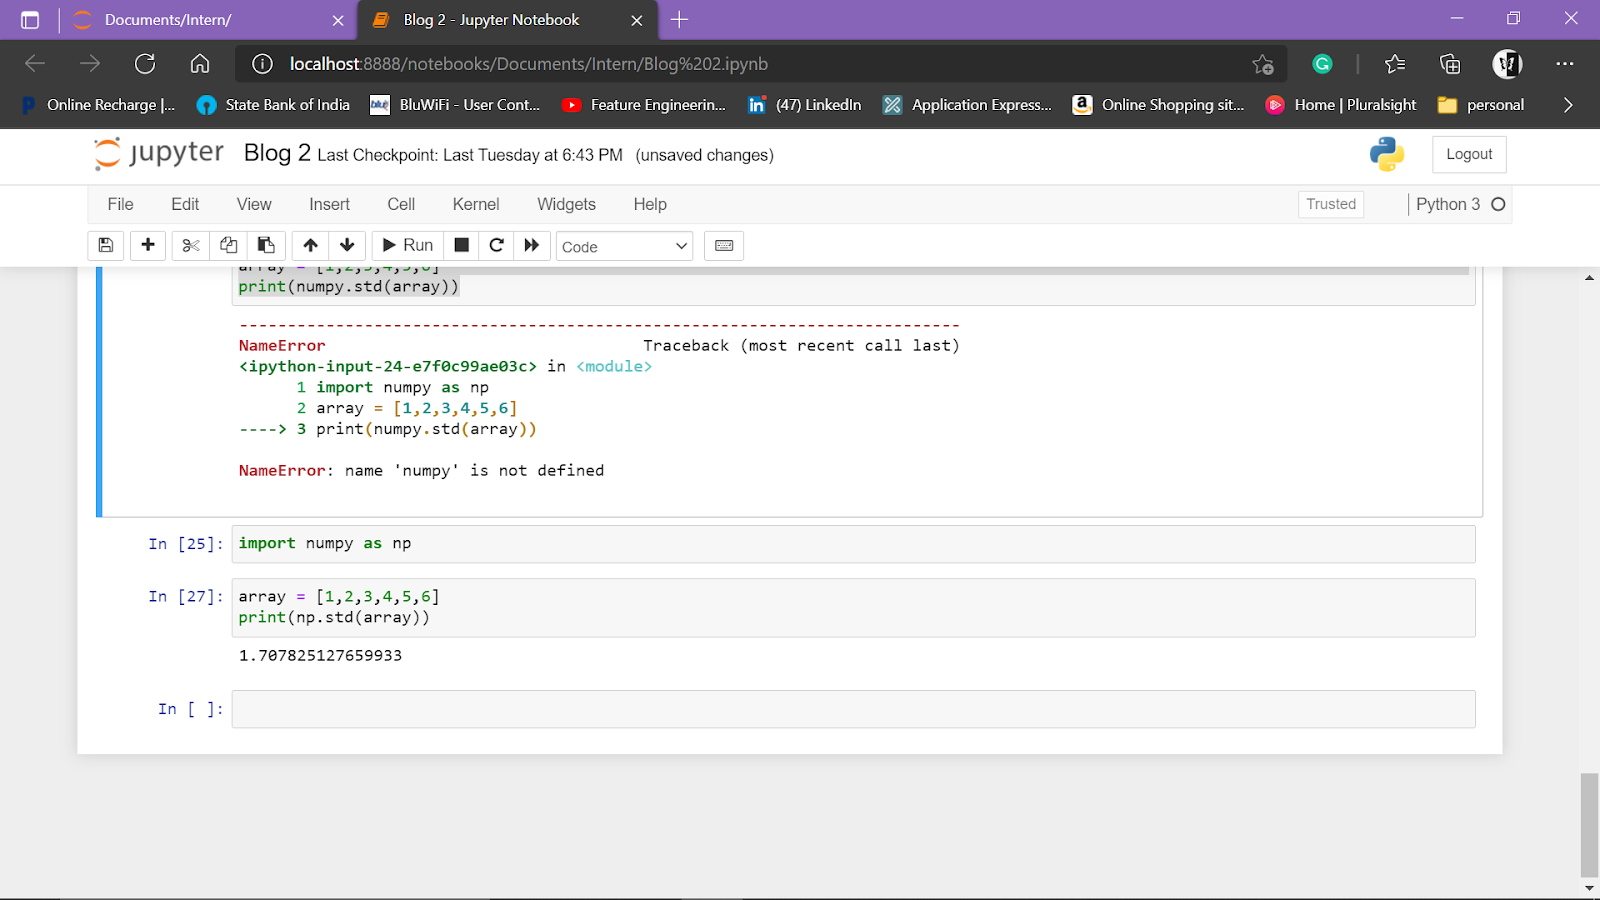
Standard Deviation
SD tells us the average difference between actual values and mean.
CASE(i) – High standard deviation indicates high dispersion
CASE(ii) – Low standard deviation indicates Low dispersion
| PROS | CONS |
| Consider all elements in the dataset. | Hard to calculate |
| Consider all the distribution | – |
Code:
import numpy as np
array = [1,2,3,4,5,6]
print(numpy.std(array))
Other measures
- Maximum & Minimum: Max and Min data in the dataset
- Count: Counts the total number of data points
- Mode: Indicates values with high frequency
- Range: Range is defined as the difference between Maximum and Minimum values in the data
- Outliers: Outlier is defined as the point that lies at an abnormal distance from other data points.
Bivariate Numerical Analysis
Bivariate Numerical Analysis is defined as the way to identify the relationship between 2 variables.
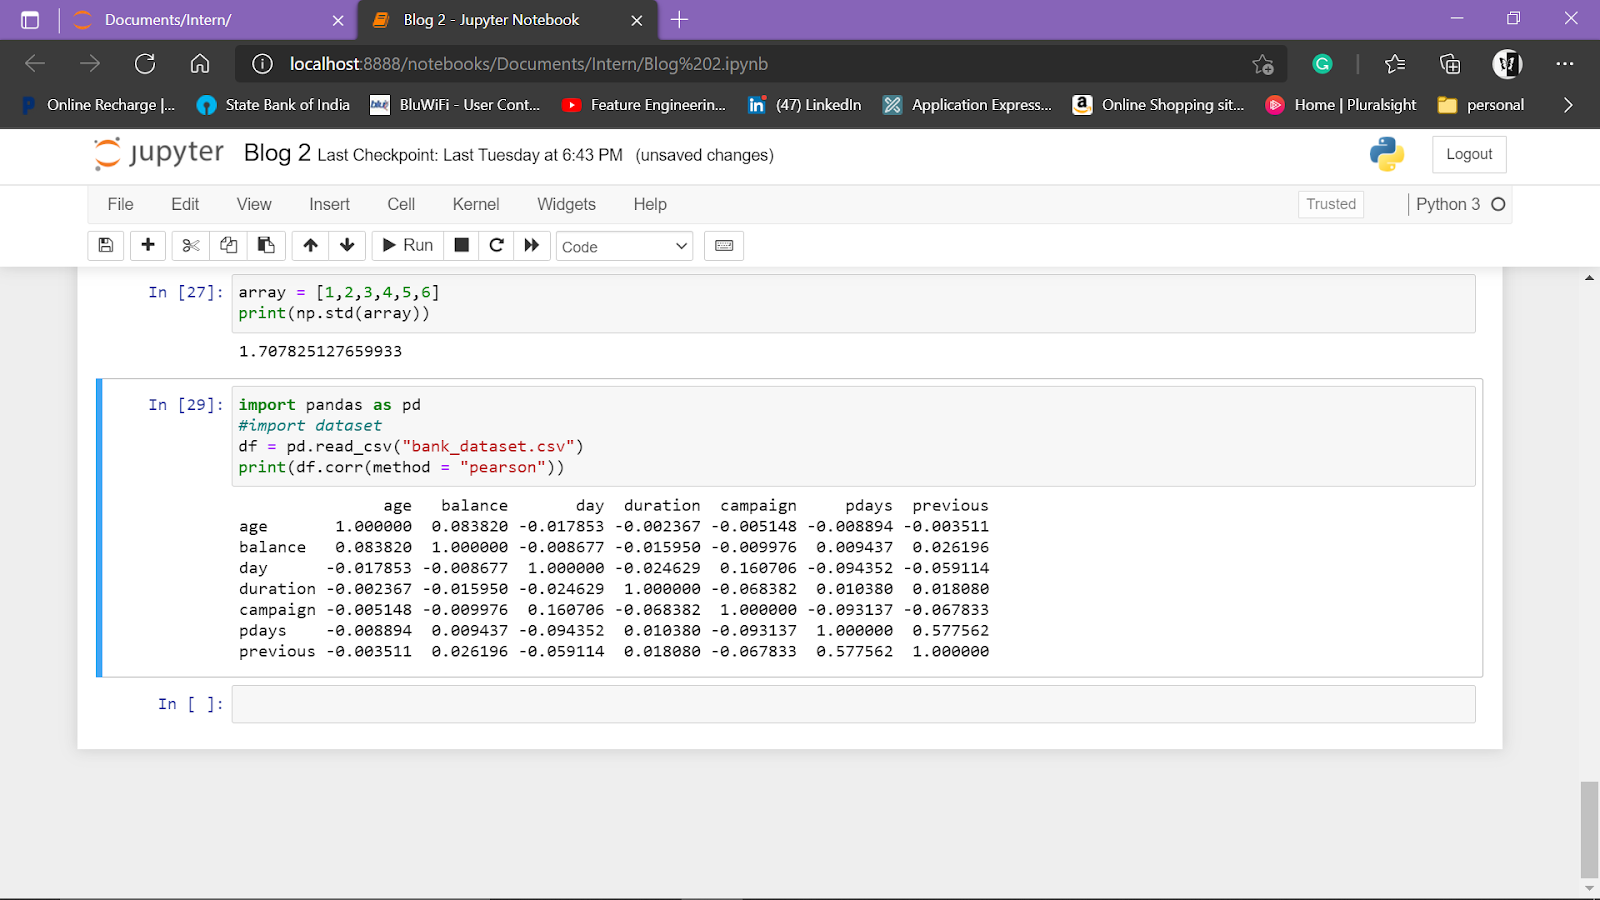
Correlation
- Correlation is the measure defining that “to what extent 2 or more variables are related”.
- It tells us the percentage of the linear relationship between x and y variables.
- It can be positive (strong) or negative or no correlation.
- If the value of correlation ranges,
- CASE(i)
– Between 0 & 1 : Positive correlation - CASE(ii)
– 0
: No correlation - CASE(iii)
– Between -1 & 0 : Negative correlation
- CASE(i)
Pearson Correlation
Among various methods of correlation, PEARSONS CORRELATION is mostly used for analysis.
Code:
import pandas as pd
#import dataset
df = pd.read_csv("filename.csv")
print(df.corr(method = "pearson"))
Note:
- The
correlation of a variable is always 1. - Machine
Learning models work only with numbers
Conclusion:
I hope you enjoyed my article and understood the essential statistical techniques for data analysis in Machine Learning!
If you have any doubts/suggestions please feel free to contact me on Linkedin / Email.
Once again, THANKS FOR READING 🙂
About Author:
Hello! This is Priyadharshini, I am currently pursuing M.Sc. in Decision and Computing Sciences. I am very much passionate about Data Science and Statistics. I love exploring and analyzing things!!
The media shown in this article are not owned by Analytics Vidhya and are used at the Author’s discretion.


if i am doing a ML project can you tell exactly what are the steps i have to look into the preprocessing of my dataset