Airbnb is a $75 Billion online marketplace for renting out homes/villas/ private rooms. The website charges a commission (3 to 20 percent, ) for every booking. Even though the prospects are sound, but there are critics who argue that this has driven up rent, and caused damage to the local communities living in the vicinity. However, Airbnb also utilizes Predictive Analysis on Airbnb Data to optimize its operations, including forecasting demand and setting dynamic pricing strategies, which can help manage supply and demand more effectively.
The data used in this analysis is the outcome of the quest to answer the question – How is Airbnb affecting the neighbourhoods? Insideairbnb is an activist project, which has curated this dataset, to measure the impact of rentals housing on neighbourhoods and communities.
A lot of articles focus more on the machine learning algorithm/model, data cleaning, feature extraction and fail to explain the purpose of the model. Understanding the business model can help identify challenges that can be solved using analytics and data science. Using a well-known process model called CRISP-DM, this article provides a framework for end-to-end predictive analytics on the open sources Airbnb listings dataset.
This article was published as a part of the Data Science Blogathon
Table of content
Table of contents
CRISP-DM
During the pandemic, online businesses grew in size and this led to an influx of new revenue and provided ample opportunities for growth and expansion. Machine learning and data science grew at a rapid pace, with the doubling of projects and personals. But not all DS projects meet the set expectations and according to one study12, only 15 to 20 percent of projects meet their desired expectations.
One cause is a lack of a clear standard for the development and maintenance of data science projects, and without an industry-standard process, every firm follows its own machine learning process flow. CRISP-DM( CRoss Industry Standard Process for Data Mining ) is one such method that can be followed. Variants of CRISP-DM, specific machine learning projects, have been suggested and adopted as well. According to a poll by KDnuggets, CRISP-DM is a widely used methodology to implement data science and analytics projects. Other popular methodologies are the KDD process, SEMMA.
CRISP-DM model has 6 steps:
- Business understanding – What’s the Airbnb business model?
- Data understanding – Is the data complete and reliable?
- Data preparation – Preprocessing data for EDA and predictive analytics.
- Modelling – What modelling techniques should we apply, multivariate regression, deep learning, tree-based models?
- Evaluation – What are the business objective and have they been sufficiently met, Eg: provide the best possible price for the top customer, match super hosts with super customers?
- Deployment – Adoption and compliance, and provide support for solution adoption.
- Monitor and maintenance – Data science-specific process, to track data-drift, evaluate long-term model performance, and model explainability.


Food For Thought: What is your organization doing differently? Answer in the comment section below.
Advice: Spend time to plan this project from beginning to end. Around 5-7 days should be ideal to complete it, ensuring about 10 EDA’s, a couple of modelling exercises, and finishing off with recommendations.
- Monday – Business Understanding
- Tuesday – Data understanding and Data cleaning
- Wednesday – EDA Day 001
- Thursday – EDA Day 002 and Modelling data preparation
- Friday – Modelling Day 001
- Saturday – Modelling Day 002
- Sunday – Recommendation
Insideairbnb Data
Would you be safe knowing 25% of your apartment dwellers are strangers and wouldn’t it warrant some kind of action? Does a tenant take as good care of the apartment/society as the owner? The purpose of this dataset is to answer these questions and many other questions raised by the residents of these cities, and help frame robust local laws to protect cities from short-term rentals. Murray Cox is the owner of the project
Some other questions that can be answered are:
- How many listings are available in the neighbourhood?
- When are the prices high and low?
- Which neighborhoods are considered safe for hosting?
- Long-term rentals instead of leasing?
- Presence of professional hosting service providers?
Seven different datasets available to download are:
- Detailed Listings data for Seattle
- Detailed Calendar Data for listings in Seattle
- Detailed Review Data for listings in Seattle
- Summary information and metrics for listings in Seattle (good for visualisations).
- Summary Review data and Listing ID (to facilitate time-based analytics and visualisations linked to a listing).
- Neighbourhood list for geo-filter. Sourced from the city or open-source GIS files.
- GeoJSON file of neighbourhoods of the city.
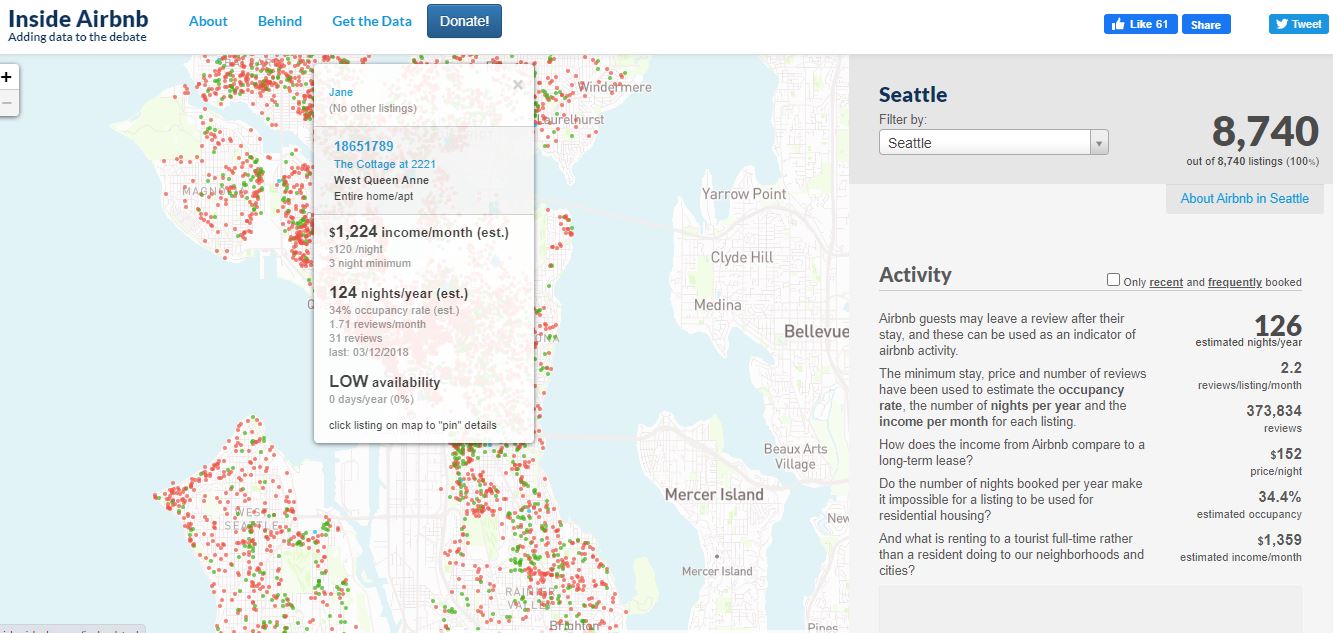
An online dashboard is also available which provides important information on the listing such as the name of the individual, location, type of room available, estimated income per month, estimated availability, availability grid(high, low etc), occupancy rate, number of reviews, etc.
Unfortunately, data for the Indian IT hub Bangalore isn’t available on the website.
The section falls under the Business Understanding process of CRISP-DM.
Seattle, USA
Seattle is on the west coast, with a population of 0.7M. The best time to visit is September to October when the temperature is pleasant 20 degrees Celsius. Summers are usually when tourists visit, which drives up hotel/renting prices and availability drops. Information on the tourist trends and weather helps better understand the underlying nuances of listing data.
Can this information help during the EDA? Let’s validate these findings in the later section of this article.
Food For Thought: What other metrics and hospitality industry-related data, open-source or otherwise could help us in this analysis? Answer in the comment section below.


The section falls under the Business Understanding process of CRISP-DM.
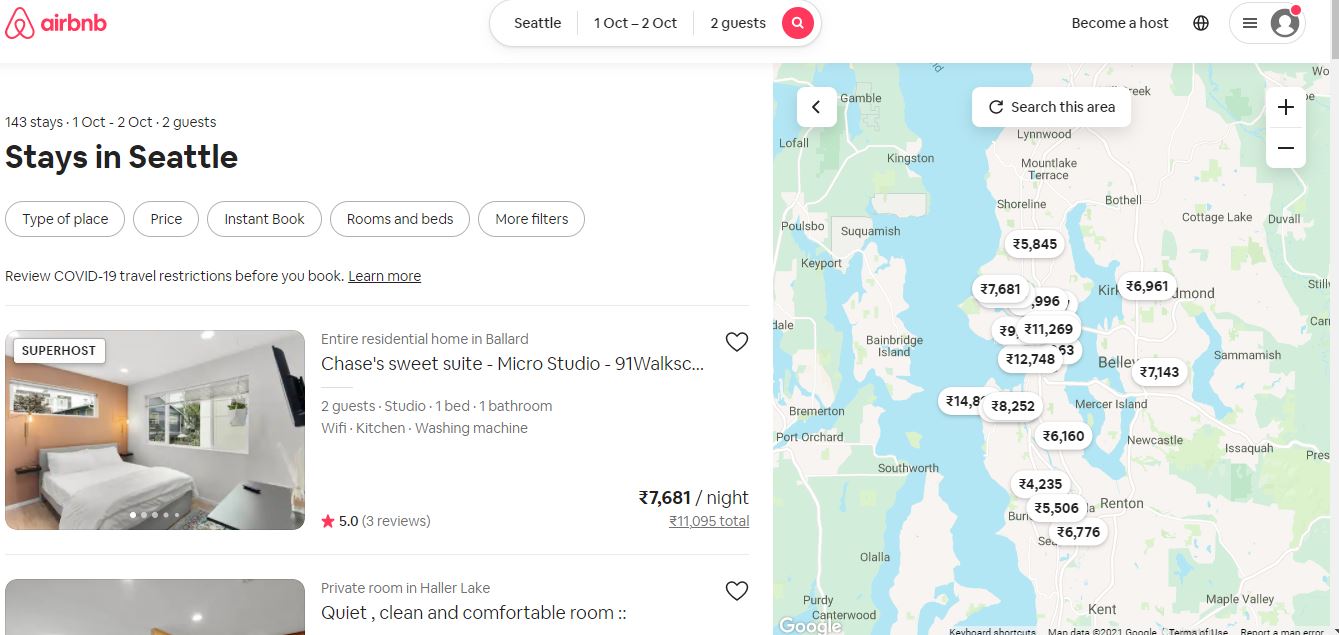
Airbnb
Airbnb provides various rental options for different customer segments. Based on customer budget, they can either opt for an entire house or just a room or even better share a room. With a range of prices as low as 700 to as high as 50,000, comes a range of amenities, such as selection on a number of beds, bedrooms, kitchen, air conditioning, heating washing machine, breakfast, beachfront, gym, pool etc to name a few.
There are 4 major types of places:
- Entire place
- Private room
- Hotel room
- Shared room
For the hosts, Airbnb has a superhost program providing exclusive benefits and higher visibility.
Hosts also have to comply with certain state/municipality rules and regulations to be listed on Airbnb. These rules are promulgated keeping in mind the safety of the residents living in the residential blocks, to prevent malpractices by individuals or a group. Airbnb has to comply with these rules as well to be able to operate in that city. For Seattle, some of the rules are given below.
- Short-term rental license.
- Bed and breakfast operator’s license.
- License to host more than 2 listings.
- List of all Seattle local laws.
Food For Thought: How can Airbnb identify illegal listings and what actions can be taken to prevent them? Answer in the comment section below.
How are rental prices decided?
- Airbnb service fee: Guest service fee charged by Airbnb—this helps Airbnb run smoothly and offer 24/7 community support
- Cleaning fee: Fee charged by some hosts to cover the cost of cleaning their space (applicable to all countries except China)
- Extra guest fee: Fee charged by some hosts for each guest beyond a set number
- Security deposit: Certain reservations may independently require a security deposit requested by the host or Airbnb
- Value Added Tax (VAT, JCT, and GST): Tax charged to guests who live in certain countries
- Local taxes: Taxes charged based on the location of the host’s listing
Food For Thought: What are the other determinants of the rental price? Eg: Neighbourhood, safety? Answer in the comment section below.
The section falls under the Business Understanding process of CRISP-DM.
Kaggle Notebooks
Kaggle is popular among data scientists since the beginning of competitive data science. Some use it to show off their skills, while others use it as a portfolio to lure potential recruiters. Kaggle has a variety of tools/products that can help data enthusiasts, it has numerous datasets across various domains, it hosts competitions, the community is mature and provide all-around support. But Kaggle kernel is probably their best product to date. With the available data, anyone can create a notebook and start exploring, and that’s exactly what we will do.
- Log in to Kaggle.
- Navigate to – https://www.kaggle.com/airbnb/seattle
- Click on New Notebook.
- Pre-existing code to import data
- Let your curious mind run free
# This Python 3 environment comes with many helpful analytics libraries installed
# It is defined by the kaggle/python Docker image: https://github.com/kaggle/docker-python
# For example, here's several helpful packages to load
import numpy as np # linear algebra
import pandas as pd # data processing, CSV file I/O (e.g. pd.read_csv)
# Input data files are available in the read-only "../input/" directory
# For example, running this (by clicking run or pressing Shift+Enter) will list all files under the input directory
import os
for dirname, _, filenames in os.walk('/kaggle/input'):
    for filename in filenames:
        print(os.path.join(dirname, filename))
# You can write up to 20GB to the current directory (/kaggle/working/) that gets preserved as output when you create a version using "Save & Run All"
# You can also write temporary files to /kaggle/temp/, but they won't be saved outside of the current session
Here’s an interesting article on Analytics Vidhya on how to create an awesome portfolio.
If I missed some other important Kaggle tricks and tips, let me know in the comment section below.
The section falls under the Data Understanding process of CRISP-DM.
Exploratory Data Analysis and Predictive Modelling
Data Cleaning/Wrangling:
As always the most important part of an analysis is the data, as this data is scraped, the chances of missing values, odd HTML characters, sparse columns, high cardinal columns are high. For the purpose of this analysis, the focus is on 3 datasets only, Calendar, Listings and Reviews.
Importing Data:
Importing using pandas read_csv. Calendar, listing, reviews are imported into df_calender, df_listings, df_reviews respectively.
#read the calendar.csv file to pandas dataframe named 'df_calendar'
df_calendar = pd.read_csv('../input/seattle/calendar.csv')
#read the listings.csv file to pandas dataframe named 'df_listings'
df_listings = pd.read_csv('../input/seattle/listings.csv')
#read the reviews.csv file to pandas dataframe named 'df_reviews'
df_reviews = pd.read_csv('../input/seattle/reviews.csv')
Pandas Profiling:
Writing code to print descriptive statistics, find missing values/ duplicates, memory usage, correlation is made easy using this library. Follow this article on Analytics Vidhya to know more about this awesome library. The profile provides a report on the below parameters:
- Type inference: detect the types of columns in a dataframe.
- Essentials: type, unique values, missing values
- Quantile statistics like minimum value, Q1, median, Q3, maximum, range, interquartile range
- Descriptive statistics like mean, mode, standard deviation, sum, median absolute deviation, coefficient of variation, kurtosis, skewness
- Most frequent values
- Histogram
- Correlations highlighting of highly correlated variables, Spearman, Pearson and Kendall matrices
- Missing values matrix, count, heatmap, and dendrogram of missing values
- Text analysis learns about categories (Uppercase, Space), scripts (Latin, Cyrillic), and blocks (ASCII) of text data.
- File and Image analysis extract file sizes, creation dates, and dimensions and scan for truncated images or those containing EXIF information.
Install pandas profiling
!pip install pandas-profilingGenerate profile report :
1. Calendar:
Code to generate the report
import pandas as pd
from pandas_profiling import ProfileReport

df_calendar = pd.read_csv('calendar.csv')
#We only use the first 10000 data points
prof_calendar = ProfileReport(df_calendar)
prof_calendar.to_file(output_file='output.html')
The report can be saved as an HTML as well
prof_calendar.to_file(output_file='output.html')
It can be downloaded from the Kaggle working directory, click on Data on the top, and select download.
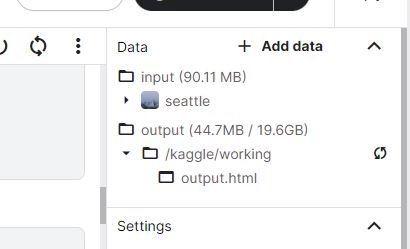
Download the calendar profile HTML file here.
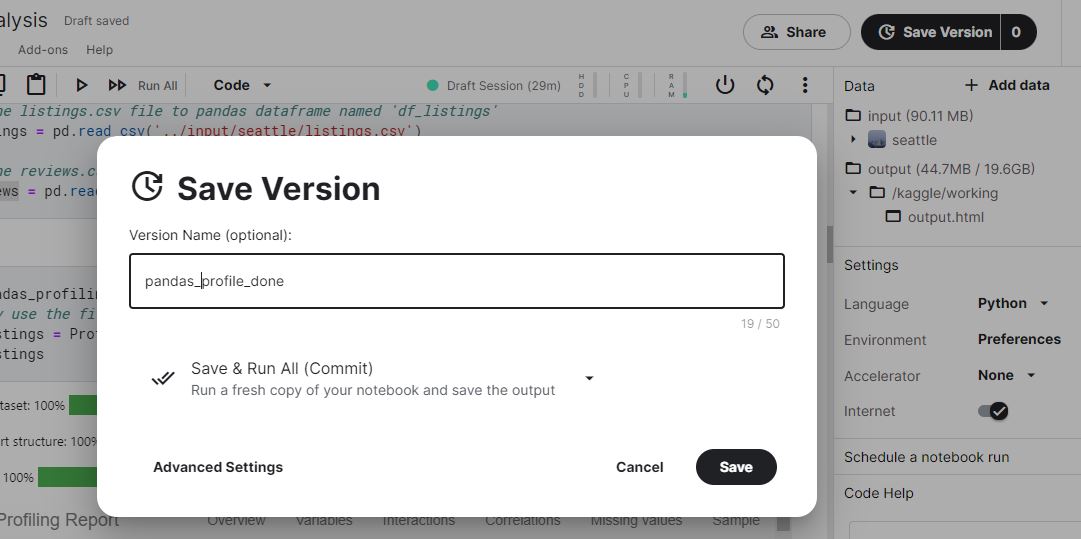
Kaggle also supports the versioning of the notebook, which is an important feature missing in several open-source tools. To version click on Save Version on the top right corner, a new pop up dialog appears, save it with a relevant version name.
2. Listings
Follow the same for Listings
from pandas_profiling import ProfileReport
#We only use the first 10000 data points
prof_listings = ProfileReport(df_listings)
prof_listings
Pandas Profile Screenshot

We see that there are 92 variables and 3818 observations for listing and exploring and cleaning all of them might take quite a bit of time but with the profiling library, statistical description and correlation is made available.
These columns are considered out of scope for in this analysis right way – calculated_host_listings_count, require_guest_phone_verification, require_guest_profile_picture, cancellation_policy, instant_bookable, jurisdiction_names, license, last_review, first_review, number_of_reviews, calendar_last_scraped, availability_365, availability_90, availability_60, availability_30, calendar_updated, extra_people, guests_included, street, host_has_profile_pic, host_picture_url, host_thumbnail_url, host_about, host_url, xl_picture_url, picture_url, medium_url, thumbnail_url, transit, notes, neighborhood_overview, description, space, summary, last_scraped, scrape_id, listing_url.
In industry, due to the humongous amount of data present, this is the current challenge, finding the right dataset and only using the important and necessary variables in that dataset.
For this analysis, we will mainly focus on about 10 to 15 variables.
3. Reviews
Follow the same for reviews
from pandas_profiling import ProfileReport
#We only use the first 10000 data points
prof_reviews = ProfileReport(df_reviews)
prof_reviews
EDA questions :
Having seen the profile/ descriptive stats/top rows, below are a few questions that can be answered using the given data. For this analysis, we will try to answer a few of the questions. Due to a large number of columns present, we will try to answer a few EDA questions one by one, in the process of cleaning the relevant and needed columns and not ending up cleaning all the columns present in the data,
- Which month has the highest and lowest availability? Availability is defined as the % of listings available.
- What is the busiest time to visit Seattle?
- How are prices varying based on the neighbourhood?
- What factors influence hosting prices?
- Can you predict prices?
- What’s the minimum score across different reviews, to accrue a decent price?
- Is short term rental profitable or long term?
- Can secondary homes and hotels be identified based on availability?
- What are the common room type, what information does it provide?
- Can you book an Airbnb and host a party for 10-15 people in Seattle?
- Are any professional hosts present?
- How can hosts earn more?
- How can hosts be segmented and what recommendations be provided to improve revenue?
- What useful information be provided to tourists?
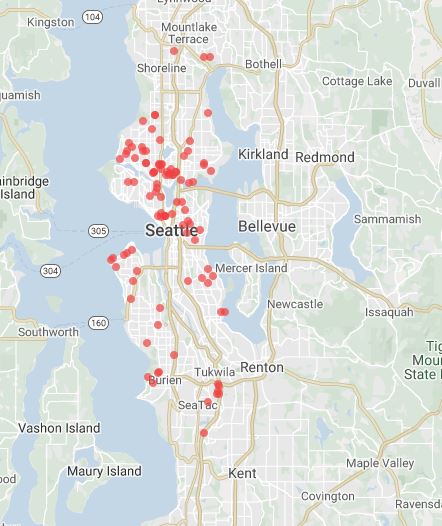
001. Which neighbourhood has the highest listing?
#Seeing which neighborhood has the highest number of listings
feq = df_listings['neighbourhood'].value_counts().sort_values(ascending=True)
feq = feq[-25:]
feq.plot.barh(figsize=(10,8), color ='b', width= 0.5)
plt.title('Number of listings by neighbourhood', fontsize=14)
plt.xlabel('Number of listings', fontsize = 12)
plt.show()
import seaborn as sns
import matplotlib.pyplot as plt
plt.figure(figsize=(10,6), dpi = 150)
sns.scatterplot(df_listings.longitude,df_listings.latitude,hue=df_listings.neighbourhood_group_cleansed
)
plt.ioff()

Capital Hill has the highest listing. It’s a tourist attraction hence the number of listings could be higher.
002. Type of properties available
df_listings.room_type.unique()output
array(['Entire home/apt', 'Private room', 'Shared room'], dtype=object)
#Histogram
freq = df_listings['room_type'].value_counts().sort_values(ascending=True)
freq.plot.barh(figsize =(15,3), width=1, color=['y','g','b','r'])
                                            #We give four different colours for our graphs
plt.title("Number of listings by roomtype in Seattle", fontsize=14)
plt.show()
- Room rentals per day are costlier than a month’s rent, so obviously renting out for a couple of days could help owners earn more.
- Also for hotels, it could be worth it if along with hotel listing they can also list on Airbnb could be an alternate revenue source.
- And few house owners with multiples houses can only rent and this could lead to an acute housing crisis. As people don’t find homes to live in but properties are available on Airbnb.
- More private rooms on Airbnb could mean that people are trying to make extra money, but the entire apartment means either hotel are listed as well or homeowners are not renting it out on but hosting on Airbnb.
- We can see that the entire property’s size is double that of private rooms, this can be further investigated.
003. Number of guests
feq = df_listings['accommodates'].value_counts().sort_index()
feq.plot.bar(figsize=(10,8), width=0.5, rot=0)
plt.title('Number of people per booking in Seattle', fontsize=14)
plt.ylabel('Number of listings', fontsize=12)
plt.xlabel('Accommodates', fontsize=12)
plt.show()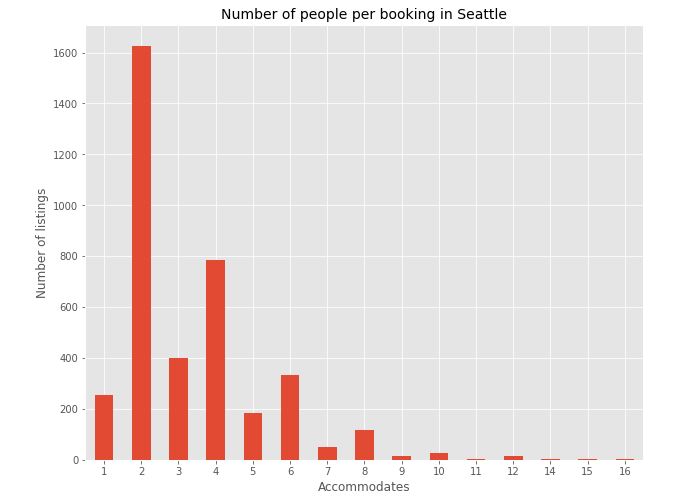
About 50% of bookings are under 2 guests per apartment, this could mean, it’s a single room apartment or a hotel. But if you want to party, it’s good to know there are options as well, which accommodate more than 10 people as well.
004. Price Prediction
a. Load dataset
#load the availablity per listing_id by date and its price
listing_calendar = pd.read_csv("../input/seattle/calendar.csv")
listing_calendar.head(10)
b. Clean pricing variable and aggregate values.
#remove $ sign on the price column and convert to numeric value
listing_calendar['price'] = listing_calendar['price'].apply(lambda x: str(x).replace('
#SET DATE AS INDEX
df_calendar2 = listing_calendar.set_index("date")
df_calendar2.index = pd.to_datetime(df_calendar2.index)
df_calendar2 = df_calendar2[['price']].resample('M').mean()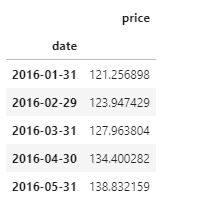
c. Plot average monthly prices
trace3 = go.Scatter(
    x = df_calendar2.index[:-1],
    y = df_calendar2.price[:-1]
)
layout3 = go.Layout(
    title = "Average Prices by Month",
    xaxis = dict(title = 'Month'),
    yaxis = dict(title = 'Price ($)')
)
data3 = [trace3]
figure3 = go.Figure(data = data3, layout = layout3)
offline.iplot(figure3)
d. Add Holiday list.
df_holiday = pd.read_csv('../input/us-holiday-dates-2004-2021/US Holiday Dates (2004-2021).csv')
df_holiday['Date'] = pd.to_datetime(df_holiday["Date"]).dt.strftime('%Y-%m-%d')
df_holiday[['ds', 'holiday']] = df_holiday[['Date', 'Holiday']]
df_holiday = df_holiday[['ds', 'holiday']]
df_holiday.head()
e. Fit Model
Facebook Prophet tutorial on Analytics Vidhya.
#instantiate Prophet Object
prophet = Prophet(
                  interval_width = 0.95,
                  weekly_seasonality = True,
                  yearly_seasonality = True,
                  changepoint_prior_scale = 0.095,
                  holidays = df_holiday)
#fit the model to training data , we try to use a whole of data as training data
prophet.fit(df_calendar)
future = prophet.make_future_dataframe(periods = 60, freq = 'd')
future['cap'] = 5.05
forecast = prophet.predict(future)
f. Plot predicted vs Actuals
#plot the predicted value and observed value
py.iplot([
    go.Scatter(x=df_calendar_copy['ds'], y=df_calendar_copy['y'], name='y'),
    go.Scatter(x=forecast['ds'], y=forecast['yhat'], name='yhat'),
    go.Scatter(x=forecast['ds'], y=forecast['yhat_upper'], fill='tonexty', mode='none', name='upper'),
    go.Scatter(x=forecast['ds'], y=forecast['yhat_lower'], fill='tonexty', mode='none', name='lower')
])
g. Evaluation
#print performance metrics
print("MAE yhatt: {}nMAE trendt: {}nMAE yhat_lower: {}nMAE yhat_upper: {}".format(
    mean_absolute_error(df_comparison['y'].values,df_comparison['yhat']),
    mean_absolute_error(df_comparison['y'].values,df_comparison['trend']),
    mean_absolute_error(df_comparison['y'].values,df_comparison['yhat_lower']),
    mean_absolute_error(df_comparison['y'].values,df_comparison['yhat_upper'])))
Output
MAE yhat : 0.005606220014658934
MAE trend	: 0.04659748642409588
MAE yhat_lower: 0.015172049476363447
MAE yhat_upper: 0.015286519651681653
h. Plot Components
prophet.plot_components(forecast)
prophet.plot_components(forecast).savefig('airbnb_006.png') 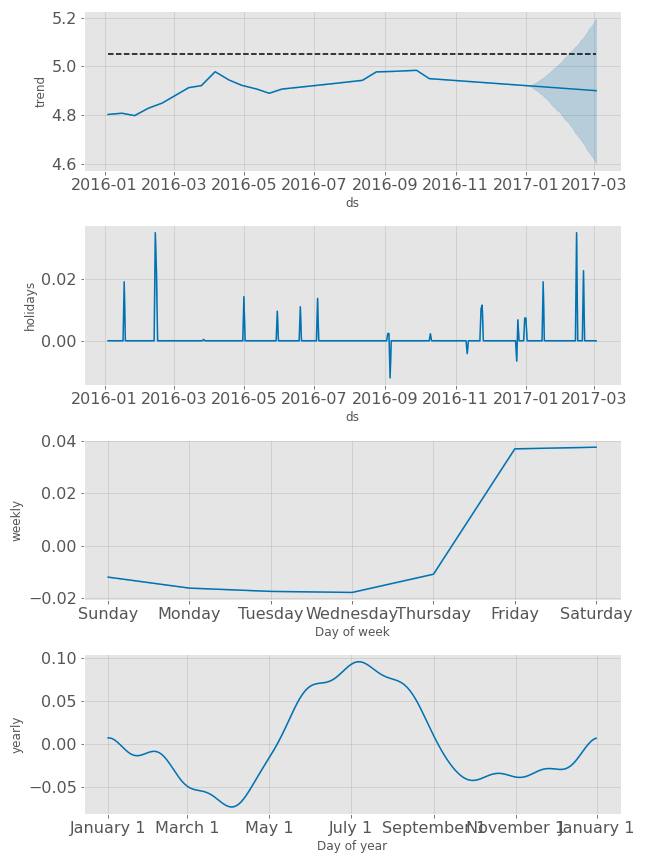
Code output image
The section falls under the Business Preparation and Modelling process of CRISP-DM. Evaluation, deployment, monitor and maintenance processes can be used for real-world projects and are not used in this article.
Practice – Communicate Results and Findings:
The findings from the EDA can be informative to either hosts or tourists or both. Write down a few findings from the EDA so that hosts can gain better ratings or higher prices. For tourists, findings can be around the best time to visit, or easy commute options, etc.
Another effective way to communicate results is to visualize data, histograms to visualize the spread, bar graphs to compare different neighbourhoods, and room types, line graphs to visualize price trends, seasonality, weekday weekend effects. Maps(Heat maps) can be used to highlight areas based on different attributes such as price, easiness to commute, bubble charts can provide availability information, etc. Visualizations provide an effective way to connect with the audience by the virtue of being appealing, vibrant, and easy to remember. Link to an easy to follow guide on Tableau.
For Hosts
- Higher rating …
- …
For Tourists
- The summer season has …
- …
The section falls under the Evaluation process of CRISP-DM.
Useful Resources and References
- Platform Failures: How Short-Term Rental Platforms like Airbnb fail to cooperate with cities
- Wiki – Airbnb
- Wiki – Seattle
- Insideairbnb
- Kaggle – Seattle Airbnb Open Data
- Data dictionary
- Seattle police department crime dashboard(on Tableau) download link
- Seattle – Hosting local laws.
- How is the price determined for reservation?
- Seattle approves new Airbnb regulations to limit short-term rentals to 2 units per hos
- Airbnb-(Python- Interactive Map, Natural Language Processing)
- CRISP-DM reference 001.
- Github Pandas profiling
- Time Series Forecasting Airbnb Data – FBProphet
- Kaggle US holiday list.
- Airbnb – Superhost.
Conclusion
Machine learning projects always throw new challenges and opportunities and if handled in the right manner can quickly become cash cows for any organization. There is always an optimal way to perform a task but until that method is developed for machine learning projects hope, this article provides a clear framework on how to approach any analysis of unseen data using CRISP-DM and a sneak peek into solving a business problem using analytics and machine learning.
Good luck! Here is my Linkedin profile in case you want to connect with me. I’ll be happy to be connected with you. Check out my other articles on data science and analytics here.
Image Source
- Image 1 – https://www.datascience-pm.com/crisp-dm-2/
- Image 2 – https://www.kdnuggets.com/2014/10/crisp-dm-top-methodology-analytics-data-mining-data-science-projects.html
- Image 3 – http://insideairbnb.com/seattle/#
- Image 4 – https://travel.usnews.com/Seattle_WA/When_To_Visit/ – Seattle temperature
- Image 5 – https://travel.usnews.com/Seattle_WA/When_To_Visit/
- Image 6 – https://www.seattle.gov/police/information-and-data/crime-dashboard
Data scientist. Extensively using data mining, data processing algorithms, visualization, statistics, and predictive modeling to solve challenging business problems and generate insights. My responsibilities as a Data Scientist include but are not limited to developing analytical models, data cleaning, explorations, feature engineering, feature selection, modeling, building prototype, documentation of an algorithm, and insights for projects such as pricing analytics for a craft retailer, promotion analytics for a fortune 500 wholesale club, inventory management/demand forecasting for a jewelry retailer and collaborating with on-site teams to deliver highly accurate results on time.


