Introduction
Founded in 2008 Zomato is a major food delivery aggregator with a markdown cap of 1 Trillion INR. It started as Foodiebay, a restaurant recommendation product, at its peak, it has 35000 menus and Rs 60 Lakh monthly revenue. Foodiebay.com reroutes to zomato.com now. It has 100,000,000+ downloads at the time of writing this article.
Swiggy is the major competitor in India, offering the same services as Zomato. But Zomato is ahead of Swiggy with respect to its AOV(Average Order Value) by Rs 35 according to a 2020 Goldman Sachs report. This gives Zomato a shot in the arm to break even and be profitable as the higher the AOV higher the margins. The importance of high AOV will be explained in the later section.
Zomato has either invested or acquired in quite a few startups internationally to help grow its business, the recent one being Grofers – Gurugran based online grocery firm. This helps Zomato focus mainly and food delivery and lets Grofers handle daily usage products. Swiggy its counterpart has Swiggy mart which handles grocery delivery. Zomato believes it can provide its shareholder better value by investing in another firm than building its own grocery product.
Zomato Hyperpure is another jewel in its crown, providing groceries to restaurants. For a B2C company, this is a new avenue and another vertical to make money. Zomato wants to be an end-to-end provider for the food industry. Restaurants need anywhere between 50-100 ingredients daily and even if Hyperpure can tap into 10% of the market it will be a huge gain in terms of revenue. FY20 Revenue stood at 14.7M compared to 1.8M in FY19 a multifold increase, as more and more restaurants adopt this new sourcing platform, net positive contribution from this vertical is bound to increase. Local mandi’s and traders are Zomato’s real competition in this space, and right now the traders are winning this race according to the latest reports from Inc42. Restaurants that buy from Hyperpure are recognized through a ‘Hyperpure Inside’ tag.
Zomato Pro is another vertical aimed at improving customer loyalty and retention. It provides an additional discount on dine-in, up to 40% off on the total bill, and no daily, weekly, or monthly limits. As of Aug 2021, it has 1.8M Pro members according to a recent tweet by Founder Deepinder Goyal. Zomato Pro Plus is an invite-only subscription launched in August 2021 providing free delivery and no surge fee, it costs Rs 900 for a 12-month plan and Rs 300 for 3 months plan.
Zomato for work is Zomato’s corporate catering vertical where it provides meals to corporate clients namely Infosys, Curefit, Nykaa, etc.
Zomato Kitchens under the banner of Zomato Infrastructure Services provides cloud kitchens to the best and reliable restaurants only. It provides kitchen equipment, tech stack, POS, and delivery, and tracking systems. Zomato earns a share of restaurants profit, thus making sure it’s a win-win situation.
App listings, Table Reservations, Advertisement and Events(Zomaland) as other ventures that Zomato owns and operates that supplement the major Online delivery segment. The major cash burn is due to the online delivery business, the current dataset explores a sneak peek into the Zomato restaurants data and might help answer a few important questions.
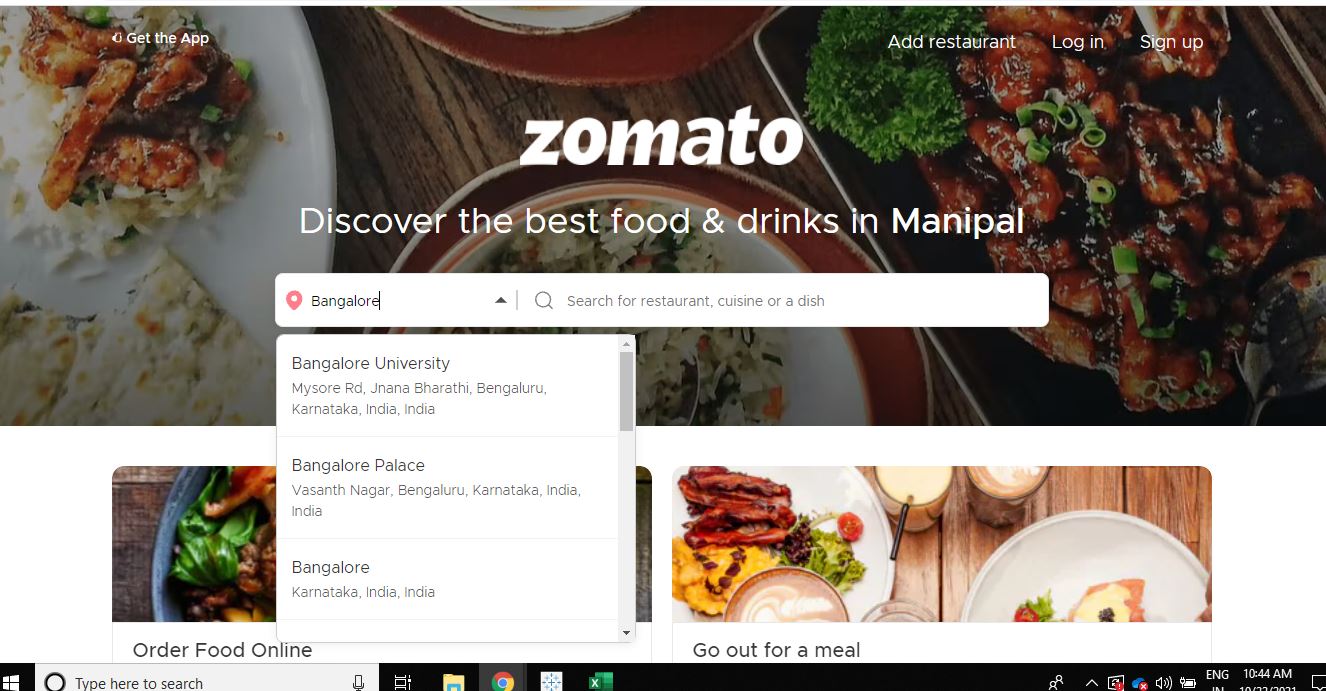
Image 1
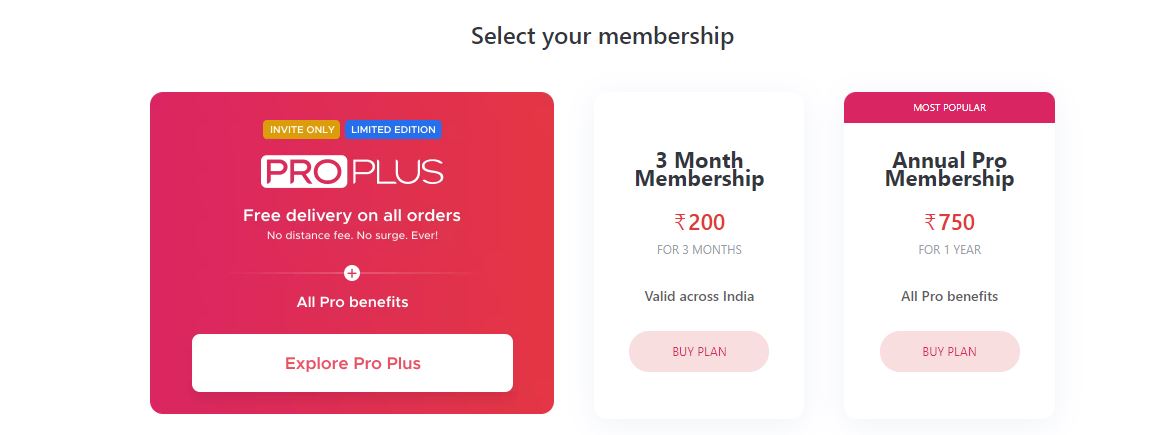 Image 2
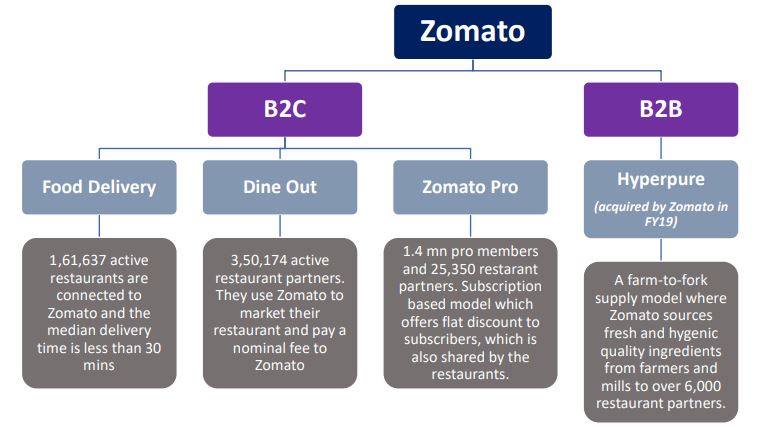
Table of content
- Zomato unit ecomonics
- Zomato restaurants data
- EDA and data visualization using Tableau
- Predictive Analytics
- Exercise
- Business case study
- Useful resources and references
- Endnotes
Zomato Unit Economics
It’s a known secret that most Indian start-ups are burning cash apart from quite a few namely Nykaa etc and for a business to sustain it’s imperative that its unit economics are strong and once scaled to a certain, it needs to profit from the business. Zomato is currently moving towards lowering its cash-burn by reducing discount and operating costs thereby improving new revenue. In simple terms, unit economics is the cost and revenue associated with a single online order.
Majorly there are two types of orders
- Type A – Zomato acts as an intermediary, receives the order, transmits the order to the restaurant and the restaurant delivers it. For eg – Dominos, Mojo Pizza, etc.
- Type B – Zomato receives, transmits, and believes the order. Eg – Local restaurants.
Metrics involved:
- AOV – Sometimes called the basket size is the average value of order over a period of time. It can be calculated pre-discount or post-discount. If calculated pre-discount the discount value needs to be deducted and can be called a promotional cost. For Type A it’s Rs 480 and for Type B it’s Rs 375.
- Commission – The percentage of AOV paid to Zomato, for example, if AOV is 1000 then 82 will be a commission charged by Zomato. All costs need to be under 82 if Zomato needs to make a profit.
- Delivery Fee – The charge is 10% of the AOV and applicable only to Type B orders. The average cost of each delivery is Rs 50, so to break even it needs AOV to be above Rs 500. Under 500 type B orders ruin its unit economics.
- Processing and support costs – SMS and call costs, support team costs – customer as well as a restaurant, equipment cost, payment gateway fee($0.25 for every $100), platform cost, etc. The cost of Type B is higher as it’s a three-way communication including the customer, restaurant, and delivery agent whereas for Type A it’s just the customer and restaurant.
- Customer acquisition cost –
- Fixed Cost – Salaries, sales and marketing teams, engineering and analytics team, electricity, pension funds, repair, and maintenance. A detailed account of it can be found in and P&L statement.
- Profit = AOV * commission – Delivery cost – processing cost – Fixed cost – customer acquisition cost.
- Net contribution margin per order = AOV * commission – Delivery cost – processing cost
The majority of the cost remains constant, the commission, delivery fee, even fixed costs per month remain more or less the same, so the metric that is very crucial to its profitability is AOV. Aggregating both types of orders, if the AOV can be above Rs 500, Zomato will be profitable, it’s as simple as that. That’s why even though the # orders per month is important, average AOV define profitability, hence in their blogs and elsewhere Mr Goyal focussed on AOV and keeps this metric close to his heart. Most of his efforts revolve around increasing AOV, that’s another reason threshold coupons, eg – 10% of above order 400 (commonly seen with credit card orders) dominant.
Covid has helped the cause as well as more premium restaurants onboarded to the platform, this resulted in 1. increased AOV, 2. affluent customers started ordering from Zomato, resulting in higher AOV.
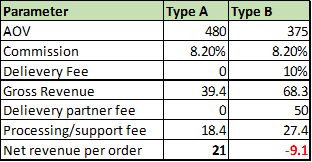
Image 4
Zomato Restaurants Data for Predictive Analytics
The Kaggle dataset was downloaded using the Zomato API. It contains dimensional information of restaurants listed on the platform. The columns available are listed below.
- Restaurant Id: Unique id of every restaurant across various cities of the world
- Restaurant Name: Name of the restaurant
- Country Code: Country in which restaurant is located
- City: City in which restaurant is located
- Address: Address of the restaurant
- Locality: Location in the city
- Locality Verbose: Detailed description of the locality
- Longitude: Longitude coordinate of the restaurant’s location
- Latitude: Latitude coordinate of the restaurant’s location
- Cuisines: Cuisines offered by the restaurant
- Average Cost for two: Cost for two people in different currencies (local currency)
- Currency: Currency of the country
- Has Table booking: yes/no
- Has Online delivery: yes/ no
- Is delivering: yes/ no
- Switch to order menu: yes/no
- Price range: range of price of food
- Aggregate Rating: Average rating out of 5
- Rating color: depending upon the average rating color
- Rating text: text on the basis of rating of rating
- Votes: Number of ratings given
Switch to order menu is NO for all observations, hence it’s of no value.
Price range ranges from one to four, with four being premium-priced restaurants.
Local currency to dollar conversion as of 20211022. This helps to normalize prices across territories.
.png)
Based on whether the restaurant has online delivery, and reservation a new tag is used to help segregate restaurants.
.png)
EDA and Data visualization using Tableau
With the present dataset, interesting insights pertaining to geography, restaurant type, and rating can be generated. Tableau is an easy drag and drop tool and is quite helpful in EDA’s. We will be using the same to answer some basic questions. A quick introduction to Tableau can be found here.
- Distribution of restaurants across countries?
- Distribution of ratings, price range, the average cost for two, voters
- Which cuisine has a higher rating?
- Which country has the cheapest food prices?
- How do votes and ratings vary across services(delivery/reservation) provided?
Distribution of # restaurants across geographies
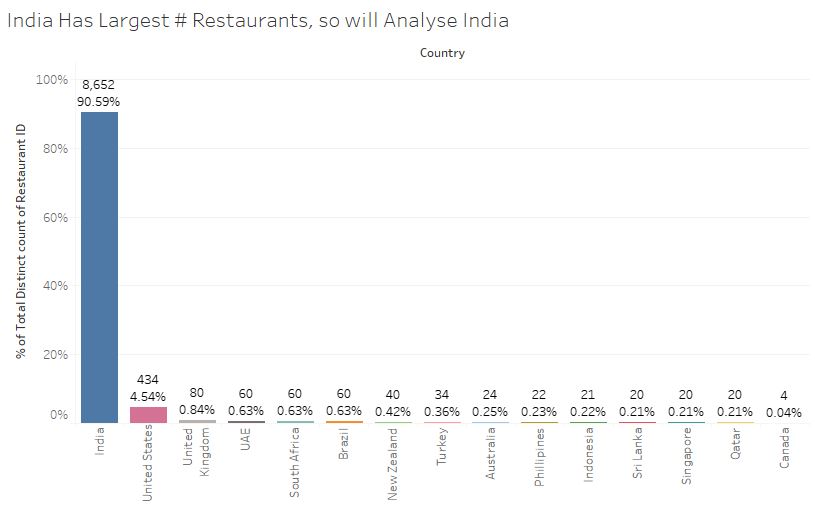
The current dataset has restaurants across 15 countries with about 90% and 5% observation for Indian and 5% USA respectively. So comparing the Indian subcontinent with the USA could be an ideal analysis.
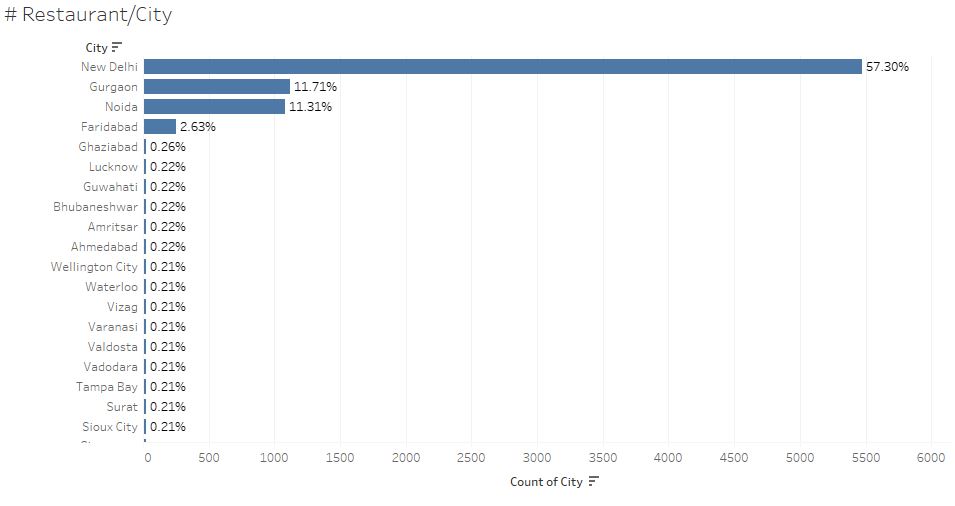
Penetration across cities
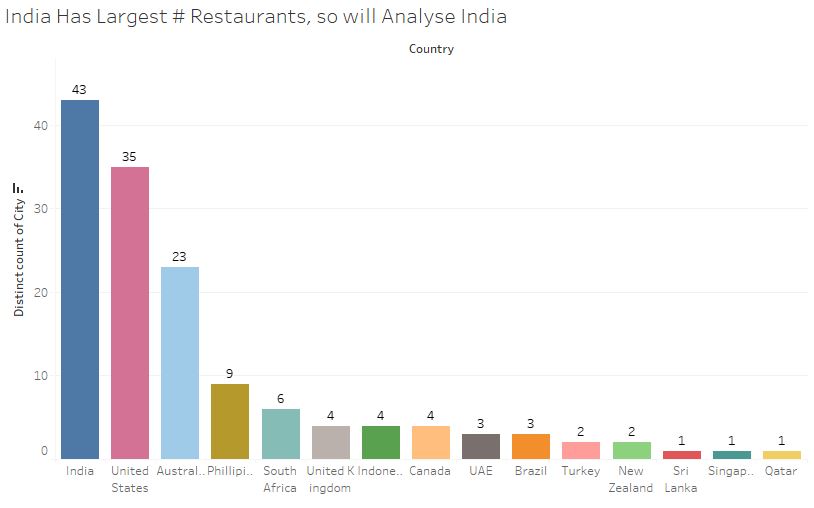
Zomato is present in 43 cities in India and 35 in the USA and 23 in Australia and the rest 12 cities are in single digits. So it validates the previous assumption that India and USA can be compared.
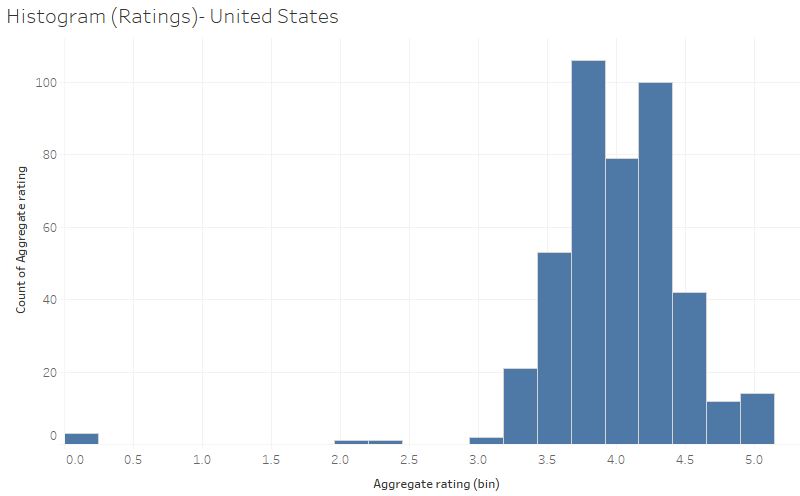
Distribution of Ratings
USA Ratings
Indian Restaurants Ratings
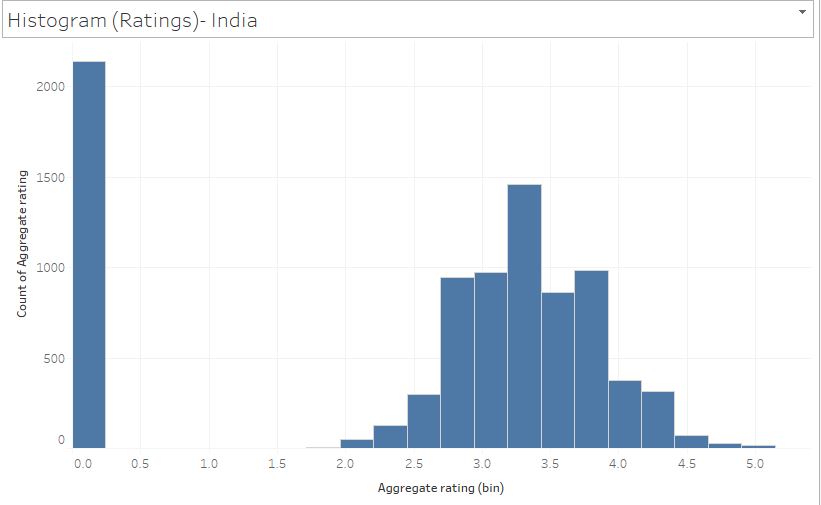
USA restaurants have higher ratings compared with Indian restaurants, this could indicate a better service in the US. A major of Indian restaurant ratings are zero.
Question: Could the 0 ratings be due to a high number of low-priced restaurants in India?
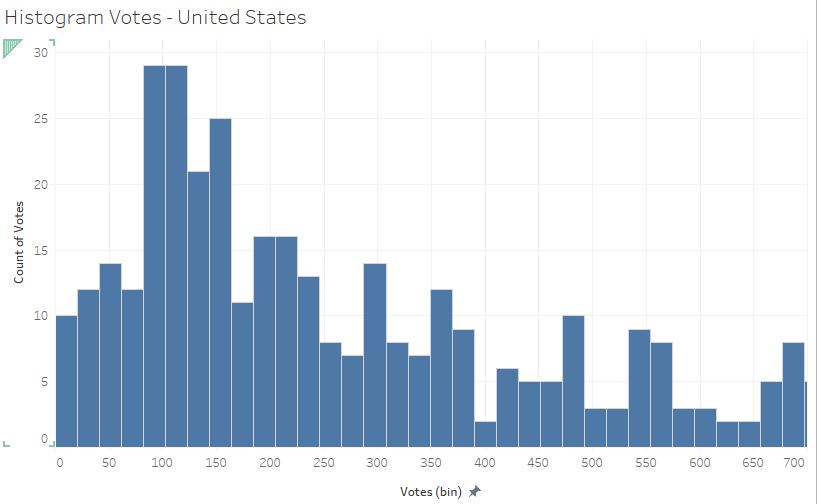
Distribution of Votes
USA
India
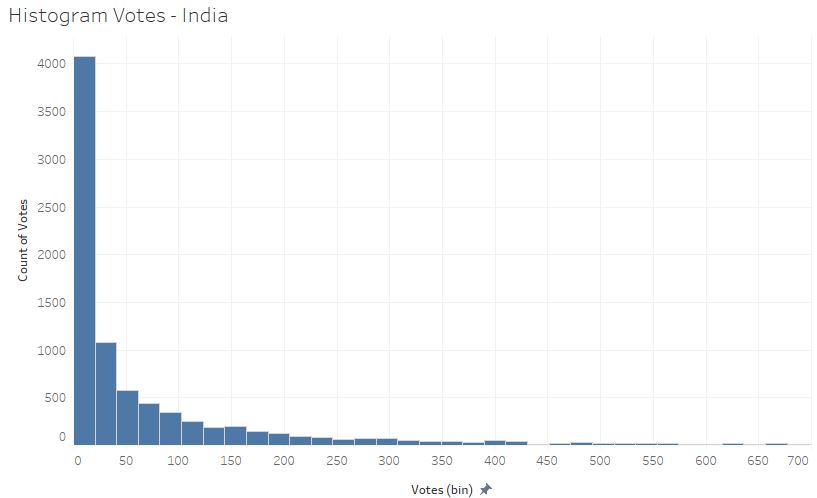
We check the rating count in the Indian subcontinent vs the US. US customers have a higher vote count than Indians, reiterating the previous finding of ratings.
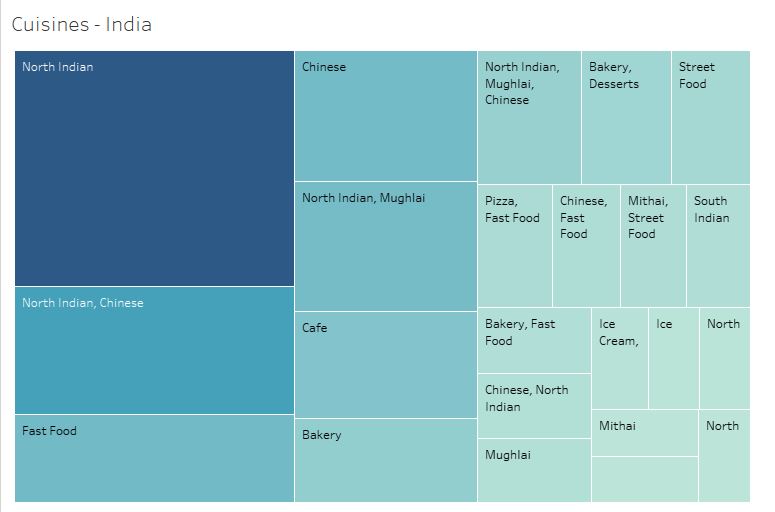
Cuisines
India
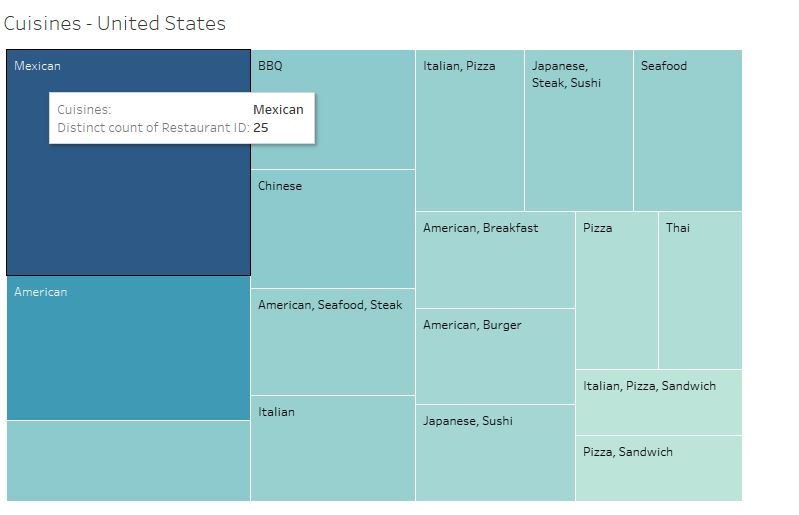
USA
North Indian, Chinese, Fast food, Mughlai are a few popular cuisines in India, so new restaurants opening up in this space can face stiff competition from established restaurants. The potential for growth in south Indian cuisines seems good due to the lack of competition and variety of vegetarian dishes.
Americans love everything American – steak, seafood, burgers, BBQ apart from Mexican and Chinese food.
Question: North Indian food dominates the Indian taste buds, could this be because the major of the restaurants are based out of north India?
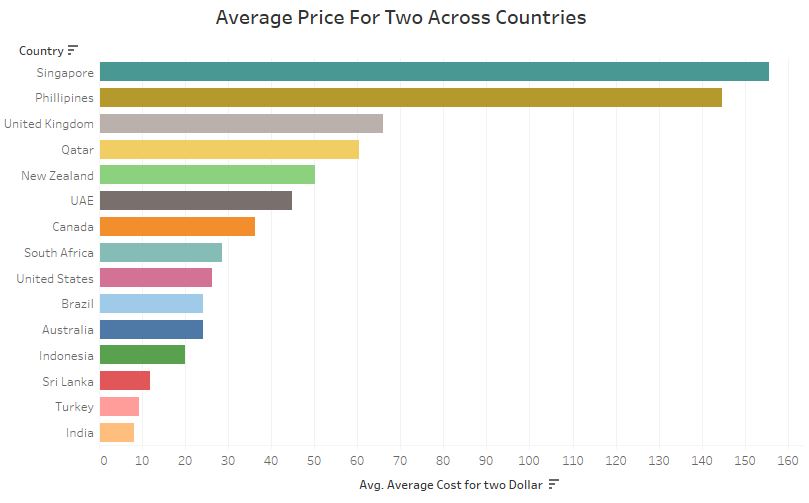
Which country has the cheaper food?
It seems that India has the lowest price for two amongst the 15 restaurants. Could it be due to the higher number of price range 1 restaurants in India? Let’s break it down based on the Price range.
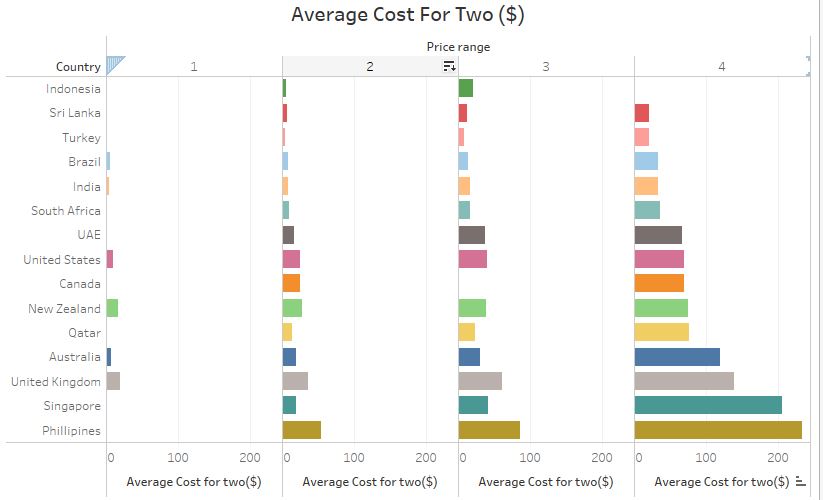
40% of restaurants across geographies fall into the cheaper price range of 1, with 32%, 14%, 6% of restaurants falling into 2,3,4 respectively, this is because Indian price range 1 restaurants are dominating the dataset. Similar distribution can be found for Indian restaurants as well.
For the US about 40% belong to price range 2, with 31, 25, and 5 belonging to 1,3,4 respectively.
Overall Philippines($233), the UK($138), and Singapore($206) have higher food prices(Price range 4) and Indonesia($5.3), Turkey($4.8) and Sri Lanka($6.3) (price range 2) have lower prices.
Distribution of Average cost for in India based on Price Range
- Blue – Price Range 1
- Orange – Price Range 2
- Red – Price Range 3
- Teal – Price Range 4
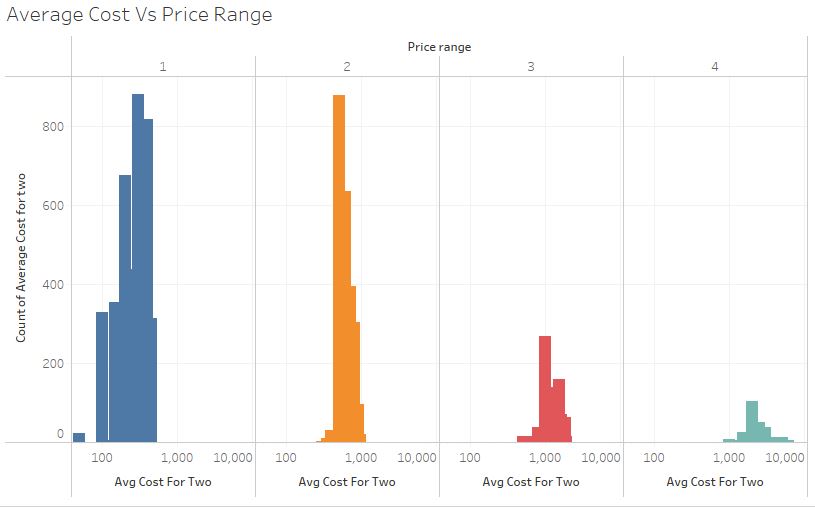
In India, for the Price ranges 1, 2, 3, 4 the average price is Rs 284, 620, 1258, 2583 respectively. The distribution is shifting from 200 on the left to about 2500 on the right.
Question: Are Price Range 1 restaurants providing value to Zomato? Justify. If no what could be done to increase the AOV of price range 1 restaurants?
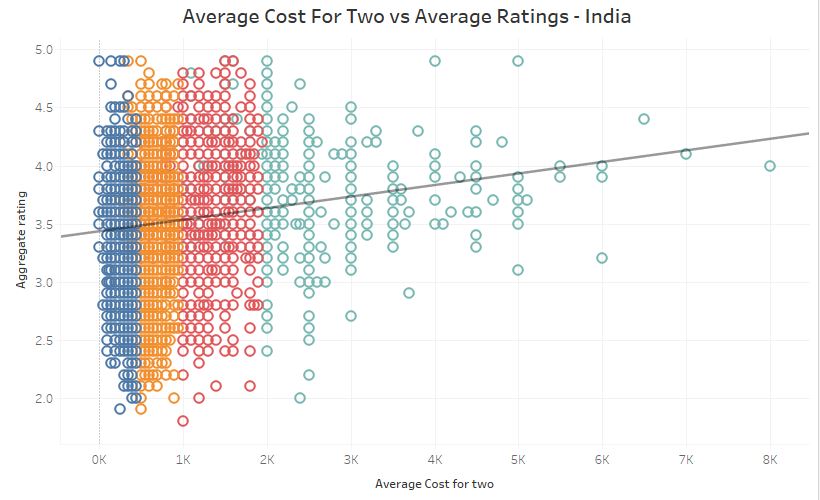
Distribution of ratings across average cost for two in India
- Blue – Price Range 1
- Orange – Price Range 2
- Red – Price Range 3
- Teal – Price Range 4
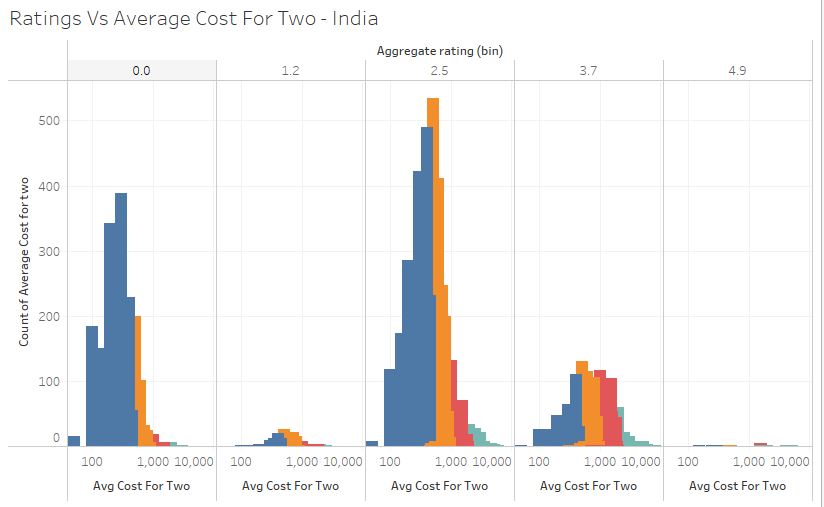
The majority of ratings are between 2.5 to 3.7, and the rests are 0. As the rating increases, there is a slight shift in average cost for two as well. For ratings 0, the average cost is at about Rs 300-400 range but for rating 3.7 the average cost moves up to Rs 1000. There is a positive relationship between the two. This can be explored using a scatter plot as well.
Question: Devise an A/B to analyze the impact of segregating ratings such that there are separate ratings for online delivery and dine-in. As these two are very different experiences, the rating system needs to be robust to provide holistic information yet be able to differentiate the two experiences.
Analysis of Ratings, Votes and Costs for two across price range and new tag in India
- Blue – Reservation and online ordering available
- Orange – No reservation and no delivery (Zomato listing, advertisements)
- Red – No reservation and only delivery
- Teal – Reservation and no delivery
Using Tableau Calculated Field to obtain the new column
IF     [Has Table booking] = "No"  and [Has Online delivery] = "No"  then "No_Reservation_No_Delievery"
elseif [Has Table booking] = "No"  and [Has Online delivery] = "Yes" then "No_Reservation_Only_Delievery"
ELSEIF [Has Table booking] = "Yes" and [Has Online delivery] = "No"  then "Reservation_No_Delievery"
else  "Both_Available" end
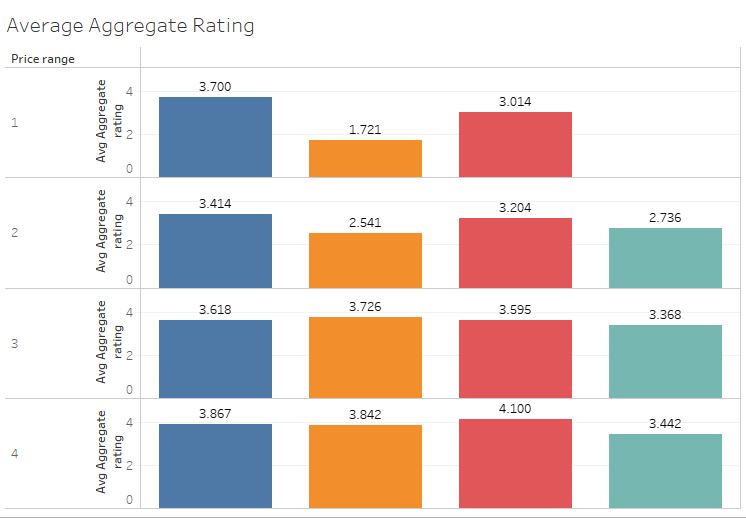
As the price range increases from 1 to 4, the ratings gradually increase as well, in line with the previous scatter plot. Higher ratings are for restaurants with online delivery(Red) and delivery+reservations(Blue). As people provide ratings on the app right after ordering food or before the next order this could explain the higher ratings.
Ratings of Dine-in restaurants without reservations or online delivery increase drastically with a price range from 1.7(local dine-in) to 3.8(premium dine-in chains), the highest increase across the 4 categories.
One intriguing observation – price range 1 with both facilities has an average rating of 3.7, and this fails to follow the overall trend observed previously. More data could help explain this outlier.
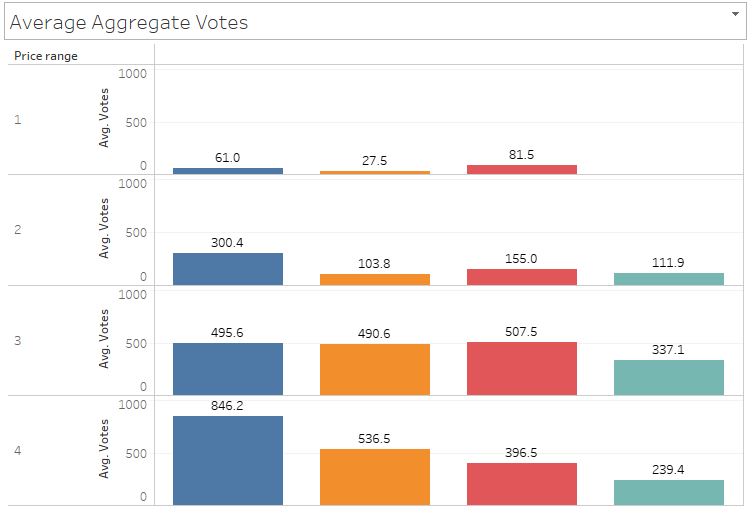
It’s a known fact that premium restaurants with delivery get higher share ratings and this is true for vote count as well.
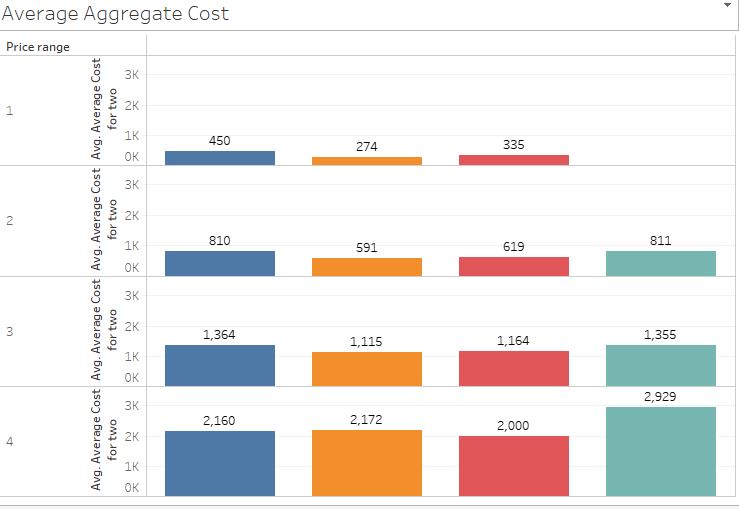
For Price range 4 with reservation and no delivery, the average cost for two is Rs 2900, this is an exception, whereas, for the rest of the price ranges, the cost is more or else the same. Whereas for price range 4 dine-in costlier, this could happen because customers want to enjoy higher-priced cuisines at the restaurants and only deliver lower prices items on the menu.
Summary/Recommendations
- 90% of observations belong to India.
- USA(4) has higher ratings than India(3.5) and a majority of Indian restaurants have 0 ratings. Either Zomato should nudge customers to rate or these are newly onboarded restaurants.
- US customers provide ratings more frequently and consistently than Indians.
- Popular Indian cuisine is North Indian owing to4 major North Indian cities and for the USA it’s all Americana food.
- India and US have moderate food prices as compared to the rest of the countries.
- Better affordability has led to restaurants offering in price range 1 but this could affect Zomato’s unit economics. The average price range 1 is Rs 284, except this, all the rest price ranges provide positive returns based on previous analysis on unit economics.
- Positive relation exists between ratings and the average cost for two, this could be because of the assumed notion that premium restaurants have good ambiance or better service, whereas regular restaurants cannot provide such an experience which could lead to lower ratings.
- Provide reservations and online delivery to receive valuable customer feedback and rating.
- Nudge price range 1 and 2 restaurant’s customers to vote more number of time.
- Dine-in without reservation is cheaper for price range 1,2,3 restaurants, as no commission is charged.
Predictive Analysis on Zomato Data
At Zomato machine learning is used to answer some basic questions, so that customer experience can be enriched, also to reduce cost or increase revenue. The aim could be to improve the OTR(order through rate), GMV(gross merchandising value), AOV(average order value), reduce EDT (estimated delivery time), estimate FPT (food preparation time), etc.
Zomato touched a peak order per minute (OPM) rate of 4,254 on Dec 31, 2021, and for the month of May 2021, the total orders were about 750K, could models predict this accurately? If so this would help the operations team prepare well for such an onslaught of orders.
Some of the common questions that come to mind are –
- When will this food order get delivered?
- How much time will the restaurant take to prepare this food order?
- Who should be the delivery partner (DP) for this food order?
- Is this photo a food shot?
- Is the DP properly groomed?
- Is the DP wearing a mask?
- Is this review a fake review?
We will use the CRISP-DM methodology here. A quick intro to CRISP-DM can be found here.
- Business understanding – EDA on Tableau(refer to the previous section)
- Data understanding – EDA on Tableau(refer to the previous section)
- Data preparation – Drop unnecessary columns, Filter for 4 major Indian cities as 85% of the observations are for these cities, Use encoders for categorical values, Drop columns based on high correlation.
- Modelling – Using linear regression to predict ratings.
- Evaluation – Use R2_score or MAPE to evaluate the model
- Deployment – Not applicable
- Monitor and maintenance – Not applicable
Average Cost Prediction
1. Read data
df=pd.read_csv('/kaggle/input/zomato-restaurants-data/zomato.csv',encoding='latin-1')
2. Drop unnecessary columns –
df.drop(columns=['Restaurant ID','Restaurant Name','Is delivering now','Switch to order menu','Price range','Rating color'],axis=1,inplace=True)
df.drop(columns=['Address','Locality','Locality Verbose'],axis=1,inplace=True)
3. Filter for India and 4 large cities
df[df['Country Code']==1]
df=df[df['City'].isin(['New Delhi','Gurgaon','Noida','Faridabad'])]
# Drop country code
df.drop(columns=['Country Code','Currency'],axis=1,inplace=True)
4. Feature Engineering – Encode city, ‘Has Table Booking’, ‘Has Online Delivery’ and ‘Rating text’ using label encoder.
from sklearn.preprocessing import LabelEncoder
encoder= LabelEncoder()
df['City']=encoder.fit_transform(df['City'])
df['Has Table booking']=encoder.fit_transform(df['Has Table booking'])
df['Has Online delivery']=encoder.fit_transform(df['Has Online delivery'])
df['Rating text']=encoder.fit_transform(df['Rating text'])
#to solve multi encoding problem so 3 is not given more weightage than..say 1 or delhi
#so just change them to columns from rows
# one hot encoding is what this is called
# then reomve multi-collinearity using get dummies
df=pd.<a onclick="parent.postMessage({'referent':'.pandas.get_dummies'}, '*')">get_dummies(df, columns=['City','Rating text'],drop_first=True)
df.head()
Hit run for output:
Add cuisine features as well using proxy column ‘Average Cost for two’
cuisine=df.groupby('Cuisines').mean()['Average Cost for two'].reset_index()
df=df.merge(cuisine,on='Cuisines')
#mean value of cuisines we got so dropping original cuisines
df.drop(columns=['Cuisines'],axis=1,inplace=True)
df.rename(columns={'Average Cost for two_y':'Cuisines'},inplace=True)
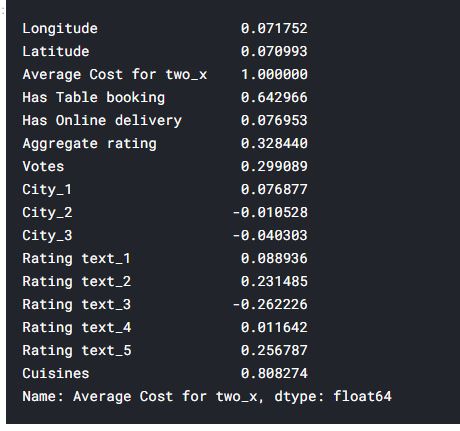
Remove Highly Correlated columns
df.corr()
df.corr()['Average Cost for two_x']
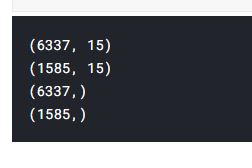
5. Train Test Split and Model Training
X=df.drop(columns=['Average Cost for two_x']).values
Y=df['Average Cost for two_x'].values
from sklearn.model_selection import train_test_split
X_train,X_test,Y_train,Y_test=train_test_split(X,Y,test_size=0.2,random_state=0)
print(X_train.shape)
print(X_test.shape)
print(Y_train.shape)
print(Y_test.shape)
from sklearn.linear_model import LinearRegression
reg=LinearRegression()
reg.fit(X_train,Y_train)
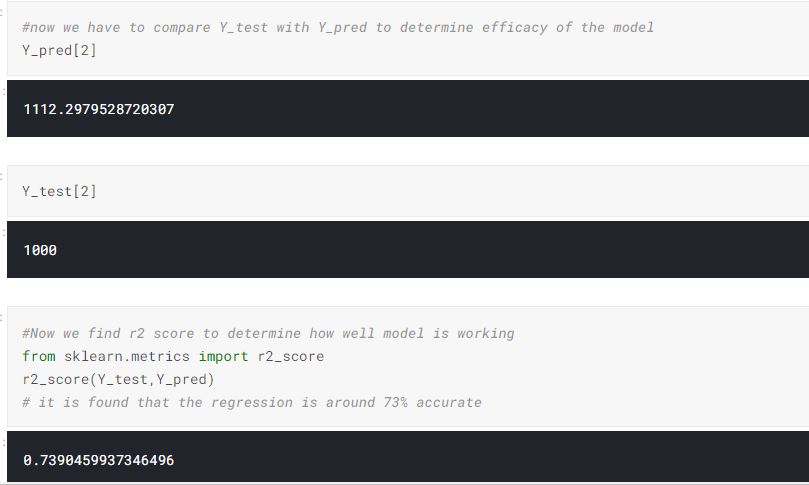
6. Prediction and Evaluation
Y_pred=reg.predict(X_test)
## Evaluations
from sklearn.metrics import r2_score
r2_score(Y_test,Y_pred)
output - 0.7390459937346496
Exercise w.r.t. Predictive Analysis on Zomato
Problem statement – Segment restaurants into suitable tiers, such the Zomato can charge commission rates based on these segments.
Example – Tier 1 to 4 with Tier 1 restaurant charged a lower commission for reliable and stable service as compared to Tier 4 restaurants, whose services need improvement. Moving to the lower commission by providing better service is the driving force for Tier 4 restaurants.
Business Case Study Questions
Data scientist interviews usually have at least one business case study round. The ability to understand the problem, frame problem statements, generate hypotheses, define key metrics and provide tangible solutions is integral to any analyst’s job. Below are a few questions that could be asked.
- How to increase AOV(average order value)?
- How to reduce delivery costs?
- Is it feasible to deliver multiple orders during single delivery and which cuisines or restaurants can be targeted for a POC(proof of concept)?
- For a particular month, say December the # ice and desert orders reduced. What’s the root cause?
- For a fixed budget of $10M, to provide 10X growth on Hyperpure should Tier 1 or 2 or 3 cities be targeted?
- For a city, Pune, the overall delivery ratings are low. What could be the reasons?
- Which restaurants should be used for customer acquisitions?
- Yearly about 25% of restaurants in India shut down. How can Zomato prevent such a situation on its platform?
- What metrics can be to measure customer retention and customer satisfaction apart from rating and reviews?
- What factors need to be considered while looking for an apt location to open a cloud kitchen in a Tier 1 city vs Tier 2?
- What factors should determine the restaurant commission rate? (Reliable ones provided lower rates etc)
Useful Resources and References
- Zomato – Wiki
- Kaggle Zomato dataset
- Zomato technology blogs – Be updated with the latest in delivery tech.
- Further Analysis – Kaggle Restaurant Recommendation Challenge
- Tableau public EDA dashboard to download
- Foodiebay
- How Foodiebay became Zomato
- Zomato Pro Plus
- P&L statement
EndNotes
Data science has a direct impact on unit economics and in Zomato’s case, it’s more true than ever. The not-so-hyped aspects of data science are the ones that drive business growth and provide stability. This article tries to connect the dots between them and provide an initial framework for budding analysts.
Good luck! Here is my Linkedin profile in case you want to connect with me. I’ll be happy to be connected with you. Check out my other articles on data science and analytics here.
Image Sources for Predictive Analysis on Zomato
- Image 1 – https://www.zomato.com/
- Image 2 – https://www.zomato.com/ncr/pro
- Image 3 – https://ventura1.com/calltracking/TechnicalCalls/stockideas/637615013439869405_Zomato%20Ltd%20-%209th%20July%202021.pdf
- Image 4 – https://www.zomato.com/blog/our-unit-economics-for-food-delivery-in-india
Data scientist. Extensively using data mining, data processing algorithms, visualization, statistics, and predictive modeling to solve challenging business problems and generate insights. My responsibilities as a Data Scientist include but are not limited to developing analytical models, data cleaning, explorations, feature engineering, feature selection, modeling, building prototype, documentation of an algorithm, and insights for projects such as pricing analytics for a craft retailer, promotion analytics for a fortune 500 wholesale club, inventory management/demand forecasting for a jewelry retailer and collaborating with on-site teams to deliver highly accurate results on time.


