This article was published as a part of the Data Science Blogathon
Background
In the current times, stress has become one of the prominent portions of our lives. Detecting stress is one of the key elements towards improving a person’s health. In this article, we will study how stress detection can be done using AutoML by using FEDOT Framework.
Dataset
Philip Schmidt and his team, in their work [3], introduced a dataset for wearable stress and affect detection (WESAD). This dataset contains sample data collected from 15 persons which contain details acquired from devices on the wrist and chest. Dataset and the dataset description can be found at the UCI dataset for WESAD [6].
WESAD is a multivariate time series dataset and detecting different affective states is one of the key machine learning classification focus areas. The above paper trained five different models (KNN, Linear Discriminant Analysis, RandomForest, DecisionTree, AdaBoost DT) towards detecting the affective states.
The UCI WESAD dataset does not have gaps or missing values in the data entries. However, it is likely that due to sensor failure, there could be a possibility to have missing portions in the dataset. Imputation in multivariate time series data is an ongoing research topic which and has multiple algorithms and solutions aimed towards addressing this.
AutoML for Stress Detection
Enter AutoML that helps in both the above requirements (time series classification and time series imputation). What is AutoML? It is an automated mechanism of Machine Learning which provides methods and processes to make Machine Learning available for non-Machine Learning experts [1]. FEDOT is one of the recent open-source AutoML frameworks [2], that helps address this.
Related work
Mikhail Sarafanov & team in their work described in [5], have explained the FEDOT usage for multivariate time series datasets and used the time series of sea surface height from the satellite altimetry data.
FEDOT for UCI WESAD dataset
FEDOT is an open-source framework used for automated modelling and machine learning [2], which helps in the construction of custom-built pipelines in an automated way. FEDOT open-source framework assists in classification (binary and multiclass), regression, clustering, and time series prediction tasks.
In this article, we will explore the usage of FEDOT for the UCI WESAD dataset to (1) simulate missing data and impute the same (2) detection of affective states.
We notice that the accuracy of the automated way of FEDOT is commensurate to Simple Linear Regression (SLR) although the results of SLR are higher. However, the results of using the pipeline mechanism of AutoML provide the best results comparatively. In this article, we will explore the usage of FEDOT for the UCI WESAD dataset [6] to (1) simulate missing data and impute the same (2) detection of affective states.
Automated mechanisms can be used in situations wherein we are looking for rapid and cost-effective results without compromising on performance.
FEDOT installation
1. pip install fedot
pip install fedot==0.4.1
This is the current version of fedot available. Recommendation to use the latest per [2]
Libraries installation
2. Install necessary libraries
# Pipeline and nodes
from fedot.core.pipelines.pipeline import Pipeline
from fedot.core.pipelines.node import PrimaryNode, SecondaryNode
# Data
from fedot.core.data.data import InputData
from fedot.core.data.data_split import train_test_data_setup
from fedot.core.repository.dataset_types import DataTypesEnum
# Tasks
from fedot.core.repository.tasks import Task, TaskTypesEnum, TsForecastingParams
from fedot.utilities.ts_gapfilling import ModelGapFiller, SimpleGapFiller
Loading the data
3. Load the data from google colab
from google.colab import drive
drive.mount(“/content/drive”, force_remount=True)
data_set = "/content/drive/MyDrive/Colab Notebooks/Masters_WESAD/WESAD/S2"
s2_path = data_set + '/S2.pkl'
Read the data
4. Read the data
c_ax=s2_data['signal']['chest']['ACC'][0:,0]#[baseline_to_plot]
c_ay=s2_data['signal']['chest']['ACC'][0:,1]#[baseline_to_plot]#[0:100] # hundred values
c_az=s2_data['signal']['chest']['ACC'][0:,2]#[baseline_to_plot]
c_ecg=s2_data['signal']['chest']['ECG'][:,0]#[baseline_to_plot]
c_emg=s2_data['signal']['chest']['EMG'][:,0]#[baseline_to_plot]
c_eda=s2_data['signal']['chest']['EDA'][:,0]#[baseline_to_plot]
c_temp=s2_data['signal']['chest']['Temp'][:,0]#[baseline_to_plot]
c_resp=s2_data['signal']['chest']['Resp'][:,0]#[baseline_to_plot]
w_ax=s2_data['signal']['wrist']['ACC'][0:,0]#[stress_to_plot]
w_ay=s2_data['signal']['wrist']['ACC'][0:,1]#[stress_to_plot]
w_az=s2_data['signal']['wrist']['ACC'][0:,2]#[stress_to_plot]
w_bvp=s2_data['signal']['wrist']['BVP'][:,0]#[stress_to_plot]
w_eda=s2_data['signal']['wrist']['EDA'][:,0]#[stress_to_plot]
w_temp=s2_data['signal']['wrist']['TEMP'][:,0]#[stress_to_plot]
w_label=s2_data['label']
Data Pre-Processing
5. Normalize the data
numpy_data=np.array([c_ax, c_ay, c_az,c_ecg,c_emg,c_eda,c_temp,c_resp,w_label])
numpy_data=numpy_data.T
df = pd.DataFrame(data=numpy_data, columns=["c_ax", "c_ay", "c_az","c_ecg","c_emg","c_eda","c_temp","c_resp","w_label"])
display(df.shape)
(4255300, 9)
Size of the dataset
Q1 = df.quantile(0.25)
Q3 = df.quantile(0.75)
IQR = Q3 – Q1
print(“IQR isn”, IQR)
IQR is
c_ax       0.271200
c_ay       0.054000
c_az       0.507400
c_ecg      0.112335
c_emg      0.012314
c_eda      0.746918
c_temp     1.240173
c_resp     3.100586
w_label    2.000000
dtype: float64
Calculate the Interquartile range
df_out = df[~((df (Q3 + 1.5 * IQR))).any(axis=1)]
norm_df_out=(df_out-df_out.mean())/df_out.std()
norm_y = norm_df_out.w_label #keep original labels Dont normalize labels
norm_x = norm_df_out.drop(‘w_label’,axis=1)
FEDOT simulation of data gaps
6. Simulate data gaps in timeseries
def generate_gaps_in_ts(array_without_gaps, gap_dict, gap_value):
  array_with_gaps = np.copy(array_without_gaps)
  keys = list(gap_dict.keys())
  for key in keys:
      gap_size = gap_dict.get(key)
      if gap_size == -1:            # Generating a gap to the end of an array
          array_with_gaps[key:] = gap_value
      else:
          array_with_gaps[key:(key + gap_size)] = gap_value
return array_with_gaps
Function for generating the gaps in the Time Series in the desired indices
of a one-dimensional array.
parameters: array_without_gaps – array without gaps
gap_dict – dictionary with omissions, where the key is the index in the time series. Key-value is the length of the gap.
gap_value – value indicating a gap in the array
7. Define gaps dictionary
gap_dict = {1350: 150,
2600: 250,
             3800: 300,
             4500: 380,
             5400: 500,
             6200: 700,
             8000: 900}
Define the simulation gaps or breaks as per the real time scenario
8. Generate gaps
array_with_gaps = generate_gaps_in_ts(array_without_gaps=norm_df_out.c_ecg,
                                       gap_dict=gap_dict,
                                       gap_value=-100.0) #use gap value of -100
Imputation of the missing data using FEDOT
9. Imputation using FEDOT
def get_simple_ridge_pipeline():
    node_lagged = PrimaryNode('lagged')
    node_lagged.custom_params = {'window_size': 250}
    node_final = SecondaryNode('ridge', nodes_from=[node_lagged])
    pipeline = Pipeline(node_final)
return pipeline
pipeline = get_simple_ridge_pipeline()
model_gapfiller = ModelGapFiller(gap_value=-100.0,
pipeline=pipeline)
without_gap_forward = model_gapfiller.forward_filling(array_with_gaps)
norm_x.c_ecg=without_gap_forward
WESAD dataset classification
10. Train Test data split
x_train,x_test,y_train,y_test=train_test_split(norm_x_train,norm_y_train,test_size=0.2)
Split the normalized dataset to train and test with split criteria defined
11. Build the pipeline
node_first = PrimaryNode(‘logit’)
node_second= PrimaryNode(‘xgboost’)
node_final = SecondaryNode(‘knn’, nodes_from = [node_first, node_second])
pipeline = Pipeline(node_final)
Build the pipeline with the models that are needed. In this case, we have chosen logit, XGBoost and KNN
12. Classification using FEDOT
from fedot.api.main import Fedot
auto_model = Fedot(problem='classification')
auto_model.fit(features=x_train, target=y_train, predefined_model=pipeline)
prediction = auto_model.predict(features=x_test)
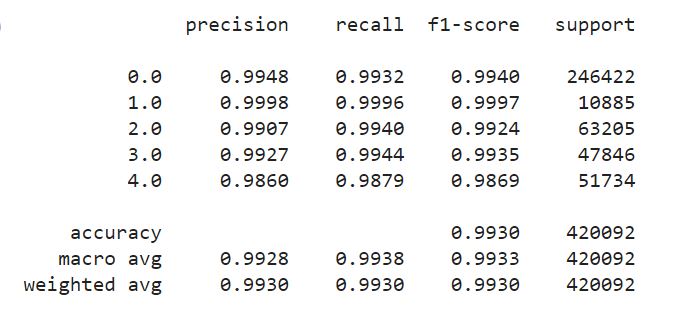
Define the FEDOT model with problem='classification'.
Fit the model with the features and the pipeline model that was chosen
Predict with the test data.
13. Classification using automated way
from fedot.api.main import Fedot
auto_model = Fedot(problem='classification')
pipeline = auto_model.fit(features=norm_x_train, target=norm_y_train)
prediction = auto_model.predict(features=norm_x_test)
The same can also be predicted using the automated way without the need to specify the pipeline.
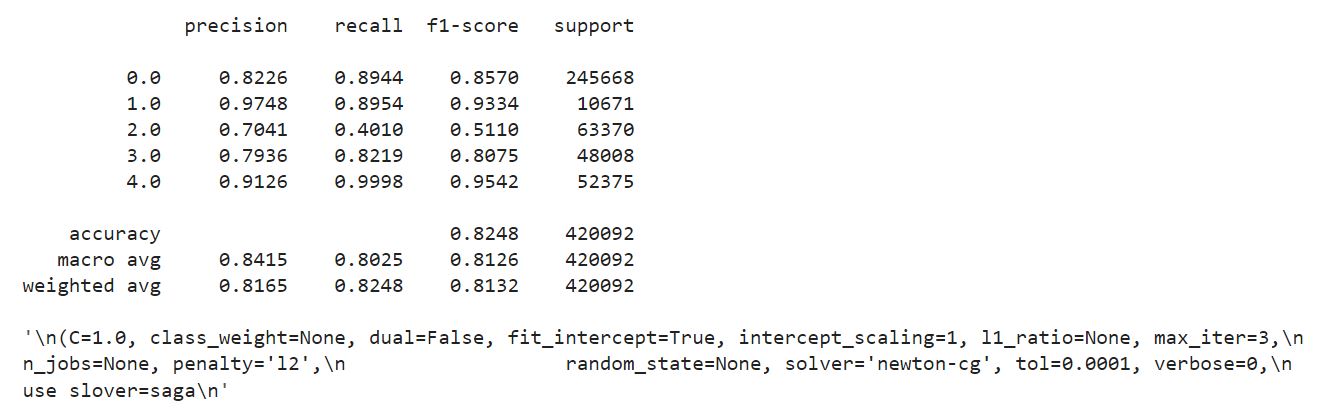
The automated mechanism is having performance comparable to Simple Logistic Regression.
Sample code and reference for SLR below
clf = skl_lm.LogisticRegression(solver='newton-cg',penalty='none')
clf.fit(norm_x_train,norm_y_train)
y_out = clf.predict(norm_x_test)
Conclusion
We notice that the accuracy of the automated way of FEDOT is commensurable with Simple Linear Regression (SLR) although the results of SLR are higher. However, the results of using the pipeline mechanism of stress detection using AutoML provide the best results comparatively.
Automated mechanisms can be used in situations wherein we are looking for rapid and cost-effective results without compromising on performance.
References
1. https://www.automl.org/automl/
2. https://fedot.readthedocs.io/en/latest/index.html
3. Huynh, L., Nguyen, T., Nguyen, T., Pirttikangas, S. and Siirtola, P., (2021) StressNAS: Affect
State and Stress Detection Using Neural Architecture Search. In: Adjunct Proceedings of the
2021 ACM International Joint Conference on Pervasive and Ubiquitous Computing and
Proceedings of the 2021 ACM International Symposium on Wearable Computers
4. Behinaein, B., Bhatti, A., Rodenburg, D., Hungler, P. and Etemad, A., (2021) A Transformer
Architecture for Stress Detection from ECG. In: 2021 International Symposium on Wearable
Computers. pp.132–134
5. Sarafanov, M., Nikitin, N.O. and Kalyuzhnaya, A. V, (2021) Automated data-driven approach
for gap filling in the time series using evolutionary learning. arXiv preprint arXiv:2103.01124.
6. https://archive.ics.uci.edu/ml/datasets/WESAD+%28Wearable+Stress+and+Affect+Detection%29


