Introduction
In this article, our focus will be on learning how to solve a time series problem. Before we take up a time series problem, we must familiarise ourselves with the concept of forecasting. So now the question is, what is a time series?
Time series analysis is a statistical technique used to analyze data collected over time to understand patterns and trends and to make predictions about future events. It uses mathematical models and statistical methods to extract insights from time-ordered data. Time series analysis aims to identify patterns in the data, model these patterns, and use the model to make accurate predictions about future values.
The process of time series analysis involves several steps, including data cleaning, trend analysis, seasonal analysis, and modeling and forecasting. Each step builds upon the previous one to form a complete understanding of the time series data and make predictions about future values.
Learning Objectives
A time series is a set of data for a definite period of time. In other words, we can say that a time series is a set of numerical measurements of the same entity taken at equally spaced intervals over time. Time series data can be collected yearly, quarterly, monthly, weekly, daily, or even hourly. Time series data has four aspects of behavior: trend, seasonality, cycles, and unexplained variation. The objectives of time series analysis are:
- To understand the past behavior of data and to forecast future behavior.
- To compare the actual performance with the expected performance and analyze causes of variation.
- Planning future operations.
- Evaluate current accomplishments and performance to ascertain the causes of poor performance.
- Useful in planning, administration, business, social science, and other areas of human knowledge.
This article was published as a part of the Data Science Blogathon.
Table of Contents
What is Time Series Forecasting?
Forecasting is simply predicting future values based on historical observations or past data.
datasets here
For example:-
1) We can use the past data of the stock to forecast the closing price of the stock for the coming month.

2) We can forecast the number of bookings for an airline based on past values or the past number of bookings observed.

3) Similarly, we can forecast the sales in the coming months based on the sales observed in the past few months.

Now I have a question for you: how will you select the duration for forecasting?
Selecting the Forecasting Duration
In this section, we can forecast sales or stock prices for the next week, month, or year.
Let’s take a few examples to understand this better.
Suppose you want to forecast the demand for dairy products to stock them in a supermarket. Now, given this scenario, what do you think? I will explain to you the right forecasting duration. Should we make the forecasts for the coming weeks, for the next few months, or for the next year?

The obvious answer here is for the next two to three weeks. Because the shelf life of dairy products is very short. Hence, making a prediction for demand in the next month or even the next year makes no sense because you won’t be able to stock up for the next year.
Here’s another example: Suppose you want to forecast the demand for soft drinks so that you have enough in stock when needed again.
In this case, we want to stock these soft drinks in the supermarket. What would be your answer? Would you still be forecasting for the next two weeks, or should we forecast for the next two months or the next year?

In this example, we know that we can stop restocking for the next two months. While stalking and restocking every two weeks would be tedious, what if the scenario is slightly changed?
Let’s say you are asked to forecast the demand for cold drinks. so that the manufacturing company can optimize its manufacturing process. This is to set up more machines if required, and so on. In this case, in order to pre-plan the manufacturing processes for production and optimize the same, making forecasts for the week or for the month does not make sense. As a result, the forecast should be for at least the next six months or a year.

Now you might wonder, “How do we decide the forecasting duration for a problem?”
So there are no predefined rules for selecting the duration for which you want to forecast the values. It will completely depend on factors like:
- What exactly is the problem statement?
- What is the purpose of forecasting?
For example, the duration of forecasting would differ for different domains, such as,
- Dairy products or
- The cold drinks
- Stock Market
- Weather Forecast
- Airlines Booking
Similarly, the duration would also vary based on the purpose that you have in mind for forecasting, like:
- Are you trying to manage the inventory?
- Are you trying to prepare the stocks for the supermarket?
- Are you trying to optimize or pre-plan the manufacturing process?
So in different scenarios for different purposes, the forecasting duration will be different. To decide the right duration, you must understand the basics, such as:
- what is the business objective and
- what is the business problem
That means you’re trying to solve the problem. You must always discuss their business problems and expected outcomes with the stakeholders. So now that we are familiar with the forecasting concept let us look at the steps involved in forecasting.
Steps Involved in Time Series Forecasting
So here we will follow a few steps for forecasting tasks:
- Problem Statement Definition
- Data Exploration
- Data Preprocessing
- Selecting Evaluation Metrics
- Model construction and evaluation
Let’s discuss these steps in a few words. I’ll explain in detail later with examples.
Defining the Problem Statement: First, we need to define our problem statement based on the business objective or the business problem. After that, we’ll define the problem, select the right forecasting duration, discuss it with stakeholders, and so on.
So that should be our first step.
Data Exploration: Now that you have the problem statement, you will take the data from the stakeholders and explore the data. And find out if there are any missing values, outliers, important patterns, or valuable insights in the data that you can use in order to make the forecasts.
Data Preprocessing: After that, you will perform any data preprocessing required for the model-building stage. So if any inconsistencies or missing values are present in your data, you would be handling such cases before jumping to the model-building process.
Selecting an Evaluation Metric: This step would be to choose the evaluation metric that will be used to determine how accurate the model is. So before the model-building step, we’ll be looking at the different evaluation metrics we can use for the time series problem. And then, we’ll select the evaluation metric we’ll use for the problem. So the selection of evaluation metrics will completely depend on the problem and the data you have.
Building and Evaluating Models: Finally, once we have a good understanding of the problem statement and the data set, and the evaluation metric, we are going to build the model on the historical data and use this model for making the forecasts.

So these are the steps involved in any forecasting task. Now in the next section, we’ll take up a problem statement, and we’ll be going through each of these steps in detail.
Defining the Problem Statement
In the above section, We already discussed time series forecasting and the steps involved in Time series forecasting.
In this section, we will look at the first step of time series forecasting, which is defining the problem statement. Now we’ll be working with jet Rail.
The Jet rail is a new company that uses jet propulsion technology to run the rails. Basically, he is providing transportation services. It means to transport people from one place to another like we have trains like local trains and metros. So over the year, the number of passengers who are traveling using the jet rails has increased, and this has resulted in various problems like:-
- Limited resources
- Limited Manpower
- Did not expect the traffic
- To increase the count of people
So managing this increasing traffic has been a very challenging task for them. For the same reason, jetrail wants to know the expected traffic in the coming months. Another way we can say, they want to forecast the expected traffic on jet rails for the coming months.
This will help them in optimizing the process. It may be to schedule more jet rails per day or increases the capacity and manage the Manpower Accordingly. Finally, the conclusion is below:-
Business Problem: “Maintaining the traffic count with limited manpower and resources is challenging.”
Business Objective: “Forecasting the count of passengers expected to travel on jetrail.”
We have a dataset dating back to the inception of jet rail. Based on this historical data, we need to forecast the coming months.
Now, this is your turn. What do you think about the forecast duration? I will tell you. In this case, we need to optimize the resources and manpower that make up the forecasts for the next two quarters, which is the expected traffic on jetrail for the next two quarters.
Problem Statement: “Forecasts the number of passengers who will board the jetrail in the next two quarters.”
Importing Required Libraries
import pandas as pd

import numpy as np

import seaborn as sns

import matplotlib.pyplot as plt

%matplotlib inlinefrom sklearn.metrics import mean_squared_error

from math import sqrt

from statistics import mean import warnings

warnings.filterwarnings("ignore")

data = pd.read_csv("data/train_data_complete.csv")

print(data.shape)
data.head()
data.dtypes
data['Date'] = pd.to_datetime(data['Date'],format='%Y-%m-%d')data.index = data['Date']Exploring the Forecasted Data
data.shape

plt.figure(figsize=(12,8))

plt.plot(data.Date, data['count'], label='train data')

plt.legend(loc='best')
plt.title("Train Data")
plt.show()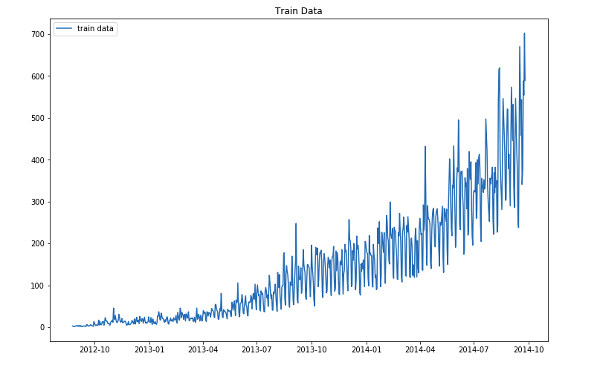
Check for Missing Values
data.shape
data['Date'].min(), data['Date'].max()

data['Date'].max() - data['Date'].min()
-
No missing values in the data
Finally, we can say, No missing values in the data. Now We have the daily level data. Let us find out if there is any pattern in the data like:-
- Is the count high on any particular day of the week?
- Will the weekend have any effect on the count?
- Is the count higher/ lower on the particular month of the year?
- How is the count changed over the years?
- Is it increasing or decreasing, or constant?
Adding Features to the Time Series Forecasted Data
data_feat = pd.DataFrame({"year": data['Date'].dt.year,
                          "month": data['Date'].dt.month,
                          "day": data['Date'].dt.day,
                          "dayofyear": data['Date'].dt.dayofyear,
                          "week": data['Date'].dt.week,
                          "weekday": data['Date'].dt.dayofweek,
                          "quarter": data['Date'].dt.quarter,
                         })
data_feat.head()
complete_data = pd.concat([data_feat, data['count']], axis=1)
complete_data.head()
# boxplot for week's count
plt.figure(figsize=(10,6))
sns.boxplot(x=complete_data['weekday'], y=complete_data['count'], )
plt.title('Week Trend')
plt.show()
- The count is lower on the weekends (Saturday and Sunday)
- The average count is higher on the weekdays
# boxplot for month's count
plt.figure(figsize=(10,6))
sns.boxplot(x=complete_data['month'], y=complete_data['count'], )
plt.title('Montly Trend')
plt.show()
- The first and the last months have observed a significantly lower average count.
Let us check the average for each quarter.
quarter_average = pd.DataFrame(complete_data.groupby('quarter')['count'].mean())
quarter_average
yearly_average = pd.DataFrame(complete_data.groupby('year')['count'].mean())
yearly_average
yearly_average.plot(kind='bar')
Time Series Cross Validation
from sklearn.model_selection import TimeSeriesSplit
time_series_cv = TimeSeriesSplit(n_splits=5)
for train_index, test_index in time_series_cv.split(data):
    print('----- ----- ----')
    print("TRAIN:", train_index[0], 'to', train_index[-1])
    print("TEST:", test_index[0], 'to', test_index[-1])
plt.figure(figsize=(6,4))for train_index, test_index in time_series_cv.split(data):
plt.plot(data.index, data['count'], label='complete data', color='green') plt.plot(data[train_index[0]:train_index[-1]].index,data['count'][train_index[0]:train_index[-1]],label='train')
plt.plot(data[test_index[0]:test_index[-1]].index,data['count'][test_index[0]:test_index[-1]],label='valid')
plt.legend(loc='best')
plt.show()


Linear Regression
Creating Train and Valid Sets
from sklearn.linear_model import LinearRegressionmodel = LinearRegression(normalize=True)i = 0
for train_index, test_index in time_series_cv.split(data):
print('----- ----- ----')
print("TRAIN:", train_index[0], 'to', train_index[-1])
print("TEST:", test_index[0], 'to', test_index[-1])
x_train = (complete_data[train_index[0]:train_index[-1]]).drop('count', axis=1)
y_train = (complete_data[train_index[0]:train_index[-1]]['count'])
x_valid = (complete_data[test_index[0]:test_index[-1]]).drop('count', axis=1)
y_valid = (complete_data[test_index[0]:test_index[-1]]['count'])
print('Model training on set', i+1)
model.fit(x_train,y_train)
preds_valid = model.predict(x_valid)
rmse = sqrt(mean_squared_error(y_valid, preds_valid))
print('The RMSE value is', rmse)
i=i+1
Conclusion
These days, time series analysis is a very trendy and important topic of data analytics for any organization. It aids in comprehending seasonality, trends, cyclicality, randomness, and other aspects of sales and distribution. These factors help companies make well-informed decisions, which are crucial for business.
- Time Series Model is a statistical approach to analyze and forecast data collected over time.
- It considers historical patterns, trends, and seasonality in the data.
- It can be univariate (one variable) or multivariate (multiple variables).
- Common models include ARIMA, SARIMA, SARIMAX, Exponential Smoothing, and Prophet.
- Used in finance, economics, engineering, and decision-making.
- It helps make predictions about future values.
- It helps businesses make data-driven decisions.
- It helps identify and mitigate potential risks and challenges.
- A valuable tool for understanding and forecasting data over time.
In this article, I discussed defining the problem statement. The next article will discuss the remaining topics, such as data exploration, data processing, selecting evaluation metrics, and building and evaluating models.
I hope that you have enjoyed the article. If you like it, share it with your friends also. Please feel free to comment if you have any thoughts on improving my article writing.
If you want to read my previous blogs, you can read Previous Data Science Blog posts from here.
Here is my Linkedin profile if you want to connect with me.
The media shown in this article is not owned by Analytics Vidhya and is used at the Author’s discretion.
Hi, I am Kajal Kumari. have completed my Master’s from IIT(ISM) Dhanbad in Computer Science & Engineering. As of now, I am working as Machine Learning Engineer in Hyderabad.
hope that you have enjoyed the article. If you like it, share it with your friends also. Please feel free to comment if you have any thoughts that can improve my article writing.
If you want to read my previous blogs, you can read Previous Data Science Blog posts here. Connect with me


