Introduction
GraphLab came as an unexpected breakthrough on my learning plan. After all, ‘ Good Things Happen When You Expect Them Least To Happen’. It all started with the end of Black Friday Data Hack. Out of 1200 participants, we got our winners and their interesting solutions.
I read and analyzed them. I realized that I had missed on an incredible machine learning tool. A quick exploration told me that this tool has immense potential to reduce our machine learning modeling pains. So, I decided to explore it further. I now have dedicated a few days to understand its science and logical methods of usage. To my surprise, it wasn’t difficult to understand.
Were you trying to improve your Machine Learning model ? But failed mostly? Try this advanced machine learning tool. A month trial is free and 1 year subscription is available for FREE for academic use. Then, you can purchase subscription for following years.
To get you started quickly, here is a beginners guide on GraphLab in Python. For ease of understanding, I’ve tried to explain these concepts in simplest possible manner.
Topics Covered
- How it all started ?
- What is GraphLab ?
- Benefits and Limitations of GraphLab
- How to install GraphLab ?
- Getting started with GraphLab
How it all started ?
GraphLab has an interesting story of its inception. Let me tell you in brief.
GraphLab, known as Dato is founded by Carlos Guestrin. Carlos holds Ph.D in Computer Science from Stanford University. It happened around 7 years back. Carlos was a professor at Carnegie Mellon University. Two of his students were working on large scale distributed machine learning algorithms. They ran their model on top of Hadoop and found it took quite long to compute. Situations didn’t even improve after using MPI (high performance computing library).
So, they decided to build a system to write more papers quickly. With this, GraphLab came into existence.
P.S – GraphLab Create is a commercial software by GraphLab. GraphLab Create is accessed in python using “graphlab” library. Hence, in this article, ‘GraphLab’ connotes GraphLab Create. Don’t get confused.
What is GraphLab?
GraphLab is a new parallel framework for machine learning written in C++. It is an open source project and has been designed considering the scale, variety and complexity of real world data. It incorporates various high level algorithms such as Stochastic Gradient Descent (SGD), Gradient Descent & Locking to deliver high performance experience. It helps data scientists and developers easily create and install applications at large scale.
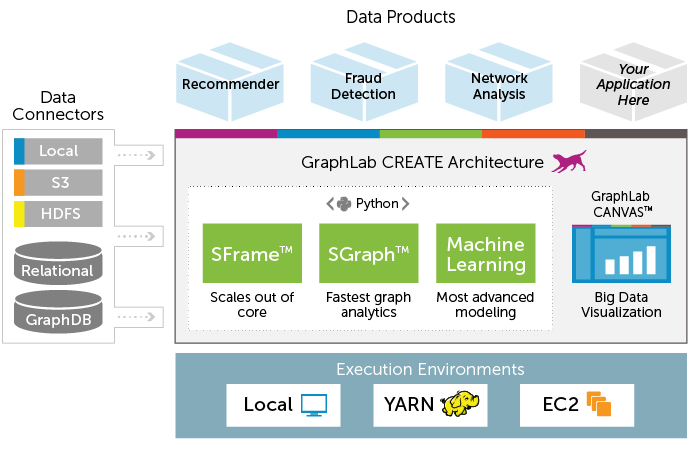
But, what makes it amazing? It’s the presence of neat libraries for data transformation, manipulation and model visualization. In addition, it comprises of scalable machine learning toolkits which has everything (almost) required to improve machine learning models. The toolkit includes implementation for deep learning, factor machines, topic modeling, clustering, nearest neighbors and more.
Here is the complete architecture of GraphLab Create.
What are the Benefits of using GraphLab ?
There are multiple benefits of using GraphLab as described below:
- Handles Large Data: Data structure of GraphLab can handle large data sets which result into scalable machine learning. Let’s look at the data structure of Graph Lab:
-
- SFrame: It is an efficient disk-based tabular data structure which is not limited by RAM. It helps to scale analysis and data processing to handle large data set (Tera byte), even on your laptop. It has similar syntax like pandas or R data frames. Each column is an SArray, which is a series of elements stored on disk. This makes SFrames disk based. I have discussed the methods to work with “SFrames” in following sections.
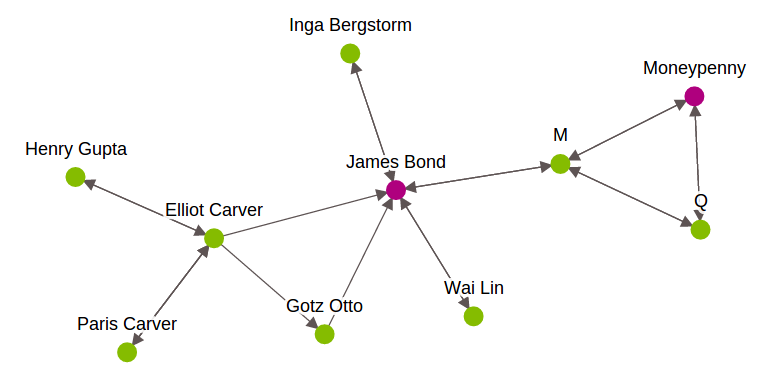
- SGraph: Graph helps us to understand networks by analyzing relationships between pair of items. Each item is represented by a vertex in the graph. Relationship between items is represented by edges. In GraphLab, to perform a graph-oriented data analysis, it uses SGraph object. It is a scalable graph data structure which store vertices and edges in SFrames. To know more about this, please refer this link. Below is graph representation of James Bond characters.
-
- Integration with various data sources: GraphLab supports various data sources like S3, ODBC, JSON, CSV, HDFS and many more.
- Data exploration and visualization with GraphLab Canvas. GraphLab Canvas is a browser-based interactive GUI which allows you to explore tabular data, summary statistics and bi-variate plots. Using this feature, you spend less time coding for data exploration. This will help you to focus more on understanding the relationship and distribution of variables. I have discussed this part following sections.
- Feature Engineering: GraphLab has an inbuilt option to create new useful features to enhance model performance. It comprises of various options like transformation, binning, imputation, One hot encoding, tf-idf etc.
- Modeling: GraphLab has various toolkits to deliver easy and fast solution for ML problems. It allows you to perform various modeling exercise (regression, classification, clustering) in fewer lines of code. You can work on problems like recommendation system, churn prediction, sentiment analysis, image analysis and many more.
- Production automation: Data pipelines allow you to assemble reusable code task into jobs. Then, automatically run them on common execution environments (e.g. Amazon Web Services, Hadoop).
- GraphLab Create SDK: Advance users can extend the capabilities of GraphLab Create using GraphLab Creat SDK. You can define new machine learning models/ programs and integrate them with the rest of the package. See the GitHub repository here.
- License: It has limitation to use. You can go for 30 days free trial period or one year license for academic edition. To extend your subscription you;ll be charged (see subscription structure here).
How to Install GraphLab?
You can also use GraphLab once you have availed its license. However, you can also get started with free trial or the academic edition with 1 year subscription. So, prior to installation, your machine must fulfill the system requirement to run GraphLab.
System Requirement for GraphLab:
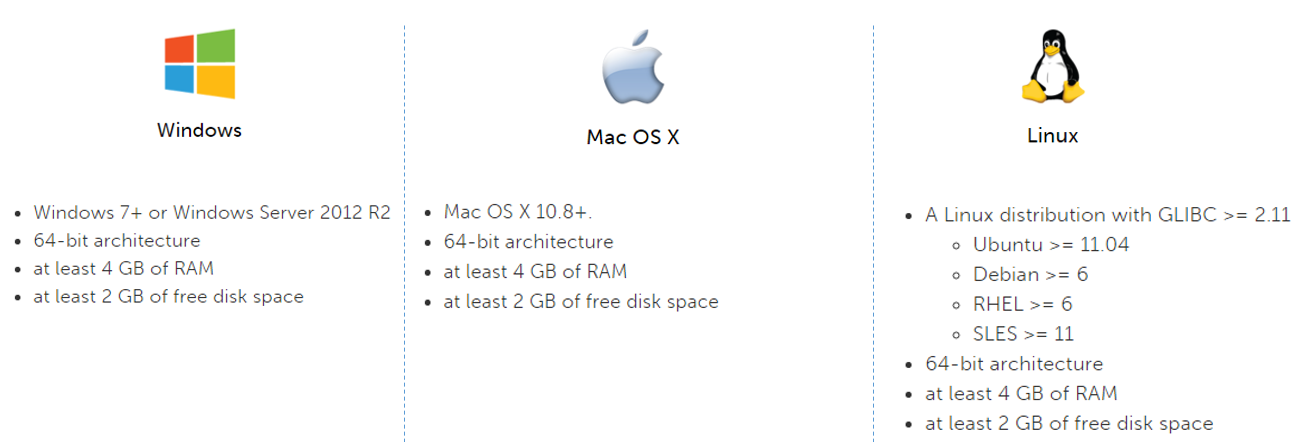
If your system fails to meet above requirement, you can use GraphLab Create on the AWS Free Tier also.
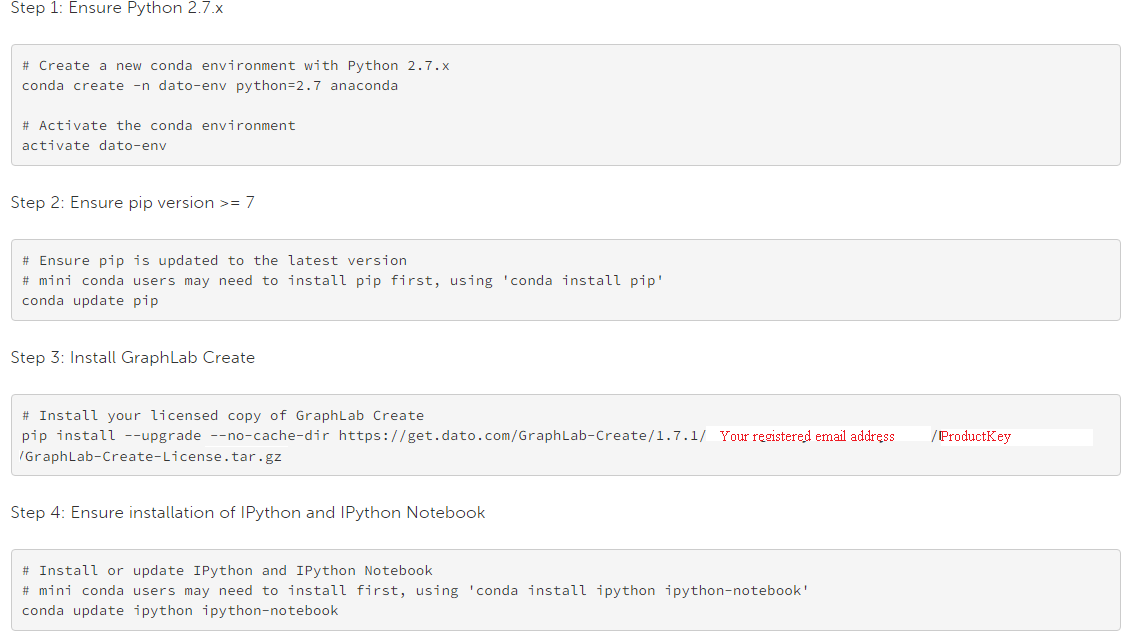
Steps for Installation:
- Register for free trail. After registration, you will receive a product key
- Select your operating system (Auto selection is on) and follow the given instructions
- Below is the command line installation instruction (For “Anaconda Python Environment”).
Getting started with Graphlab
After you’ve installed GraphLab successfully, you can access it using “import <library_name>”.
import graphlab
or
import graphlab as gl
Here, I’ll demonstrate the use of GraphLab by solving a data science challenge. I have the taken data set from Black Friday Data Hack.
-
- Load Data Set: As discussed, SFrame is the tabular data structure available in GraphLab. SFrames can import data in various formats (CSV, JSON, Apache Avro, ODBC ..). A common data format is comma separated value (csv) file. In this example, I’ll use csv files. Now, I load test and train data sets:
sf_train=graphlab.SFrame('C:/Users/Analytics Vidhya/Desktop/DataSets/Black_Friday/train.csv') sf_test=graphlab.SFrame('C:/Users/Analytics Vidhya/Desktop/DataSets/Black_Friday/test.csv') - Data Exploration and Visualization: This is a crucial stage of data modeling exercise. It require lots of code to infer relationships, outliers, missing values. But not in GraphLab. Here, they’ve reduced the coding element (almost minimize) and allows you to focus on decision making. Let’s explore the data set:
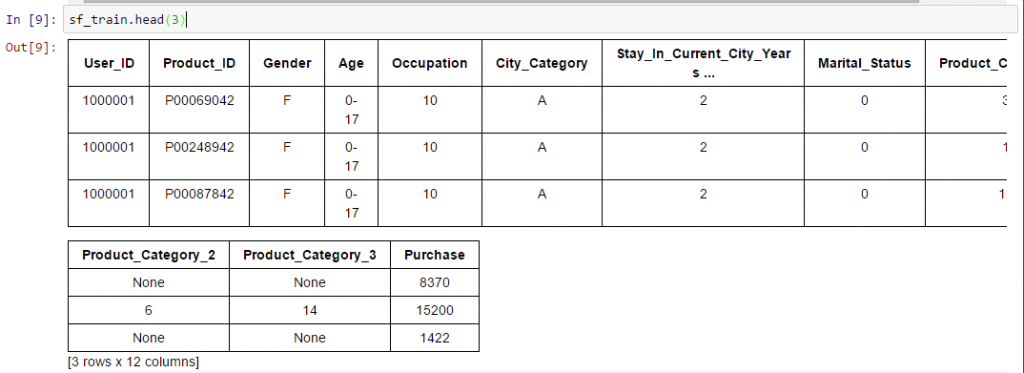
- See top/ bottom x records: We can look at the top x records of the data set like we do in pandas.sf_train.head(3)
 Unique values of a variable: Again, we have similar commands as pandas to look at the unique values in a variable.
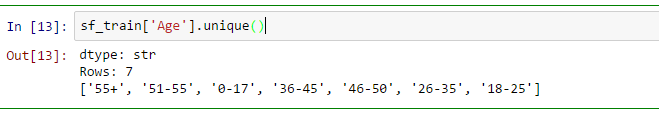
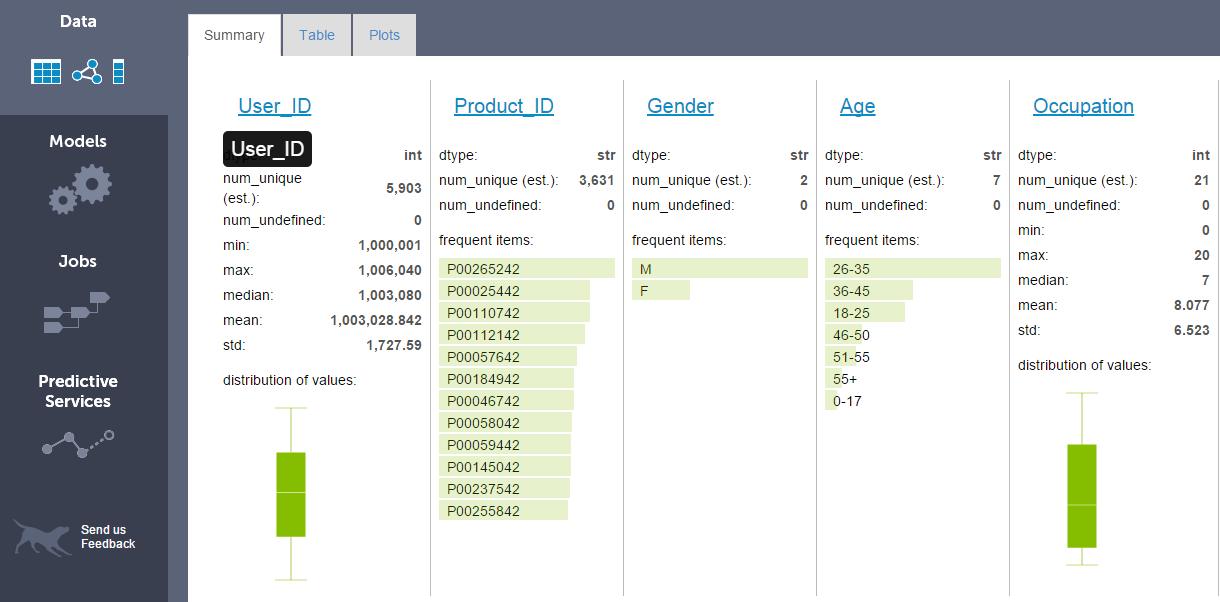
- Distribution and relationship of variables: You can visualize relationships and distribution with just one command for all variables. I have already discussed about Canvas (Web based interactive visualization platform to explore data). Data in an SFrame can be visualized with SFrame.show(). When we run command SFrame.show(), it returns a URL which redirects to GraphLab Canvas. By default, the data section remains active and has three tabs namely:
- Summary: It shows number of columns available in SFrame with summary of data. Numeric columns (
intandfloat) show a basic summary statistics (num_unique, missing values as num_undefined, min, max, median, mean, std) with box plot. string columns show number of unique values, missing values and table of most frequent items in the column.

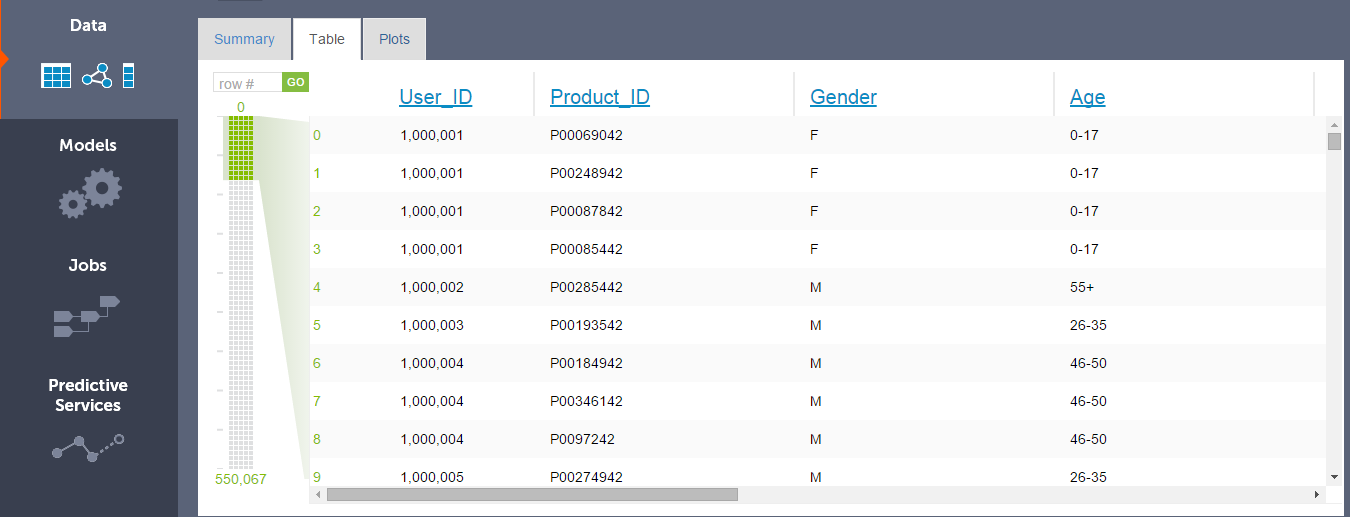
- Tables: It provide interactive tabular view of the data inside SFrame. The paging controls on the left side (image below) allows you to move quickly through the SFrame.
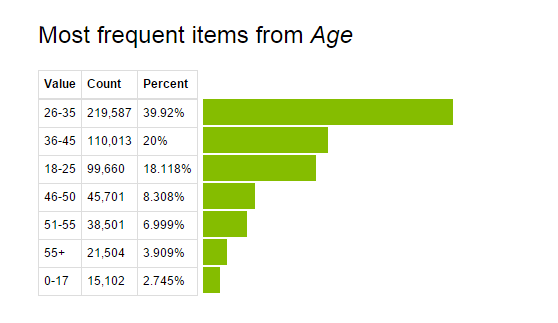
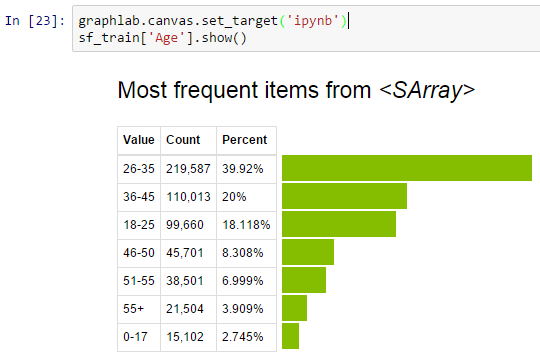
 Click on variable name to look its distribution. Below, you can see the frequency table and bar graph for variable Age.
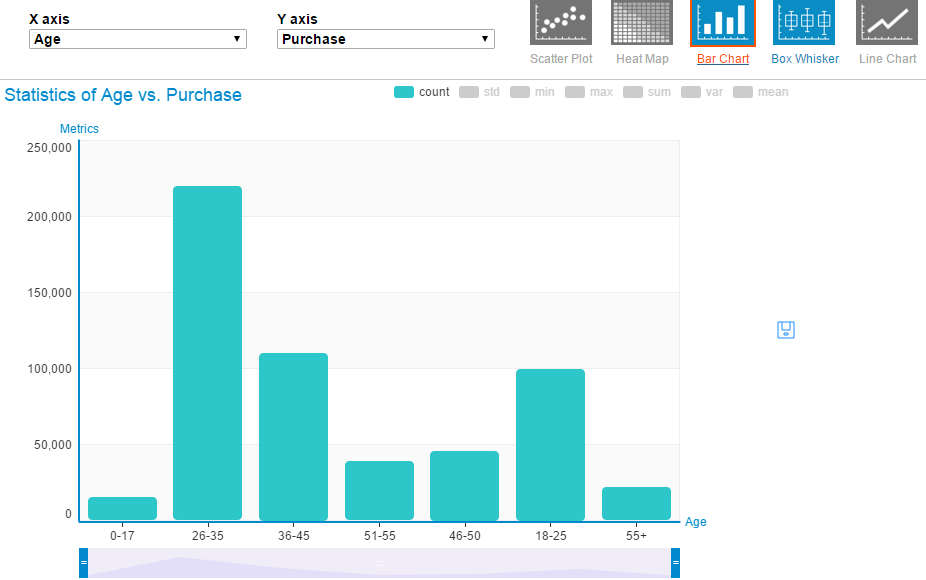
- Plot: It helps to create bi-variate plots. Currently, it supports Scatter plot, Heatmap, Bar chart, Box plot, and line chart. Here, you select variables for X and Y axis. Then, based on data type of variables, it activates the relevant chart option(s). For example: if both x and y-axis variables are numeric, it activates scatter plot. In the bar chart, you have options to add other metrics like standard deviation, min, max, sum, mean and others.
 Above, we learnt the steps to create visualization in a browser. But, you can also visualize these information in you IPython Notebook. This can be done by, first setting target to ipython notebook then visualize information.
- Summary: It shows number of columns available in SFrame with summary of data. Numeric columns (
- Load Data Set: As discussed, SFrame is the tabular data structure available in GraphLab. SFrames can import data in various formats (CSV, JSON, Apache Avro, ODBC ..). A common data format is comma separated value (csv) file. In this example, I’ll use csv files. Now, I load test and train data sets:

-
-
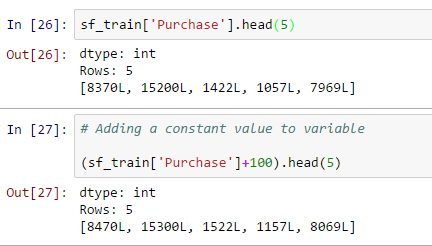
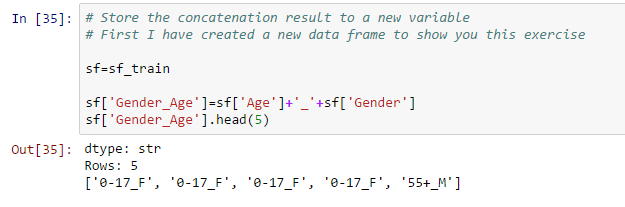
- Data Manipulation: You can also perform data manipulation operation with SFrame such as adding a constant value to all values, concatenating two or more variables, create a new variable based exiting variable(s) as shown below:
- Add a constant value to variable:
- Concatenate two strings and store it to a new variable:
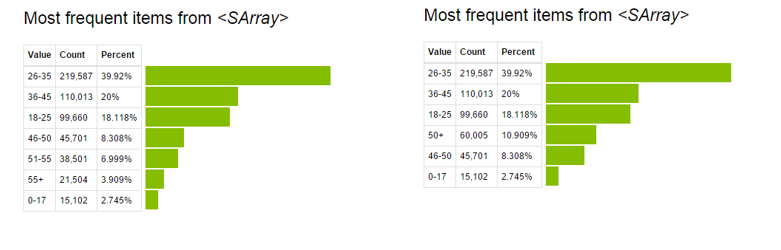
- Update values of existing variables: This can be done using apply function. In this data set, I have combined age buckets greater than 50 using code below:
# Make a change to existing variable
# Combine all bins of age greater than 50
def combine_age(age):
 if age=='51-55':
 return '50+'
 elif age=='55+':
 return '50+'
 else:
 return age
sf['Age']=sf['Age'].apply(combine_age)
Now, look at the pre and post visualization of variable “Age”.
 For more details on Data Manipulation using GraphLab, please refer this link.
- Add a constant value to variable:
- Feature Engineering: Feature engineering is an efficient method to improve model performance. Using this technique, we can create new variable(s) after transformation or manipulation of existing existing variable(s). In fact, GraphLab has automated this process. They have various transformation options for numerical, categorical, text and image features. Also, you’ll find direct options for feature binning, imputation, one hot encoding, Count threshold, TF-IDF, Hasher, Tokenzing and others. Let’s look at the imputation of categorical feature “Product_Category_2” based on “Age” and “Gender” of “Black Friday” data set.
# Create the data
# Variables based on which we want to perform imputation and variable to impute
# You can look at the algorithms behind the imputation here.

sf_impute = sf_train['Age','Gender','Product_Category_2']
imputer = graphlab.feature_engineering.CategoricalImputer(feature='Product_Category_2')
# Fit and transform on the same data
transformed_sf = imputer.fit_transform(sf_impute)
#Retrieve the imputed values
transformed_sf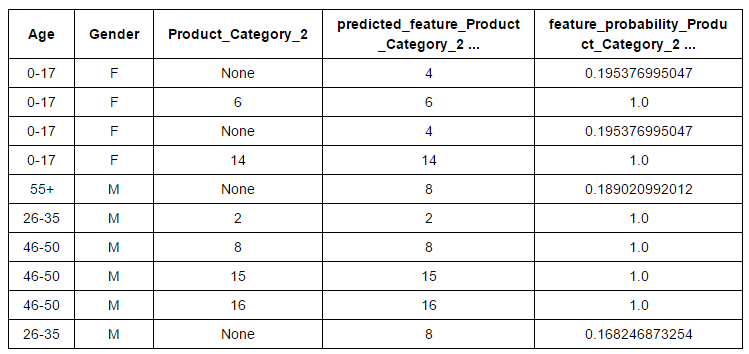
Finally, you can take this input variable to original data set.
sf_train['Predicted_Product_Category_2']=transformed_sf['predicted_feature_Product_Category_2']
Similarly, you can apply other feature engineering operations to the data set based on your requirement. You can refer this link for more details.
- Modeling: At this stage, we do predictions from the past data. GraphLab easily create models for common tasks, such as:
A) Predicting Numeric Quantities
B) Building Recommendation Systems
C) Clustering Data and Documents
D) Analyzing Graphs
- Data Manipulation: You can also perform data manipulation operation with SFrame such as adding a constant value to all values, concatenating two or more variables, create a new variable based exiting variable(s) as shown below:
-
In Black Friday challenge, we are required predict the numeric quantities “Purchase” i.e. we need a regression model to predict the “Purchase”.
In GraphLab, we have three type of regression models:
A) Linear Regression
B) Random Forest Regression
C) Gradient Boosted Regression
If you have any confusion in algorithm selection, GraphLab takes care of that. Don’t worry. It selects the right regression model automatically.
# Make a train-test split
train_data, validate_data = sf_train.random_split(0.8)
# Automatically picks the right model based on your data.
model = graphlab.regression.create(train_data, target='Purchase', features = ['Gender','Age','Occupation','City_Category','Stay_In_Current_City_Years',
 'Marital_Status','Product_Category_1'])
# Save predictions to an SArray
predictions = model.predict(validate_data)
# Evaluate the model and save the results into a dictionary
results = model.evaluate(validate_data)
results
Output:
{'max_error': 13377.561969523947, 'rmse': 3007.1225949345117}
#Do prediction on test data set
final_predictions = model.predict(sf_test)
To know more about other modeling techniques like clustering, classification, recommendation system, Text analysis, Graph Analysis, Recommendation Systems you can refer this link. Alternatively, here is the complete user guide by Dato.
End Notes
In this article, we learnt about “GraphLab Create” which helps to handle large data set while building machine learning models. We also looked at the data structure of Graphlab which enables it to handle large data set like “SFrame” and “SGraph”. I’d recommend you to use GraphLab. You’d love its automated features like data exploration (Canvas, interactive web data exploration tool), feature engineering, selecting the right models and deployment.
For better understanding, I’ve also demonstrated a modeling exercise using GraphLab. In my next article on GraphLab, I will focus on Graph Analysis and Recommendation System.
Did you find this article helpful ? Share with us your experience with GraphLab.
If you like what you just read & want to continue your analytics learning, subscribe to our emails, follow us on twitter or like our facebook page.
Sunil Ray is Chief Content Officer at Analytics Vidhya, India's largest Analytics community. I am deeply passionate about understanding and explaining concepts from first principles. In my current role, I am responsible for creating top notch content for Analytics Vidhya including its courses, conferences, blogs and Competitions.
I thrive in fast paced environment and love building and scaling products which unleash huge value for customers using data and technology. Over the last 6 years, I have built the content team and created multiple data products at Analytics Vidhya.
Prior to Analytics Vidhya, I have 7+ years of experience working with several insurance companies like Max Life, Max Bupa, Birla Sun Life & Aviva Life Insurance in different data roles.
Industry exposure: Insurance, and EdTech
Major capabilities: Content Development, Product Management, Analytics, Growth Strategy.


%202.jpg)
Hi Sunil, Very good write up, just wanted to add that currently Carlos Guestrin is offering a Machine Learning specialization on Coursera and they are using Graphlab for all the exercises. Just in case if any one is interested. Also, I wish to highlight that Graphlab has its own issues like no 32-bit OS support etc.
Carlos Guestrin along with Emily Fox conducts the Machine Learning Specialization MOOC on Coursera. Both are currently Professors at University of Washington in Seattle. I just completed the first course - getting ready to start the course on Regression Analysis. Enrolling in the course gives you one-year access to Graphlab.
Very useful. Would be great to see something similar on other ML and data science tools and platforms, and also some comparison between them. There are so many options available these days its difficult to separate wheat from the chaff, and also to know which ones will still be around in 5y time and hence are worth investing (both time and money) in. Thanks!