Overview
- Here’s a unique data science challenge we don’t come across often – a marketing analytics hackathon!
- We bring you the top 3 inspiring winners’ approaches and code from the WNS Analytics Wizard 2019 hackathon
Introduction
Hackathons have shaped my data science career in a huge way. They helped me understand the importance of structured thinking and how to use it when working with tight deadlines. This idea is actually the essence that drives the role of a successful data scientist.
I get a lot of questions from aspiring data science professionals wondering how to stand out from the competition and land a role in this field. This is a multi-layered question but one of the common elements I always point out – start participating in hackathons and gauge where you stand.

And if you can climb up the leaderboard, even better!
In this article, I am excited to share the top three winning approaches (and code!) from the WNS Analytics Wizard 2019 hackathon. This was Analytics Vidhya’s biggest hackathon yet and there is a LOT to learn from these winners’ solutions.
So bring out a pen and paper, take notes and don’t miss out on any other hackathons! Head straight to the DataHack platform and enroll in the upcoming competitions today.
About the WNS Analytics Wizard 2019 Hackathon
The WNS Analytics Wizard 2019 was the biggest hackathon ever hosted by Analytics Vidhya. Here’s a summary of the numbers behind this historic hackathon:
- Total Registrations: 6,456
- Total Submissions: 11,564
- Prize Money: Worth INR 4 Lacs (and interview opportunities with WNS)
It was a memorable 9-day hackathon with a wide range of data scientists participating from all over the globe.

Problem Statement for the WNS Analytics Wizard 2019 Hackathon
Let’s check out the problem statement for this hackathon.
Zbay is an e-commerce website that sells a variety of products on its online platform. Zbay records the user behavior of its customers and stores it in log form. However, most of the time users do not buy the products instantly and there is a time gap during which the customer might surf the internet and perhaps visit competitor websites.
Now, to improve the sales of products, Zbay has hired Adiza, an Adtech company that built a system where advertisements are shown for Zbay’s products on its partner websites.
If a user comes to Zbay’s website and searches for a product, and then visits these partner websites or apps, his/her previously viewed items or their similar items are shown as an advertisement (ad). If the user clicks this ad, he/she will be redirected to Zbay’s website and might buy the product.
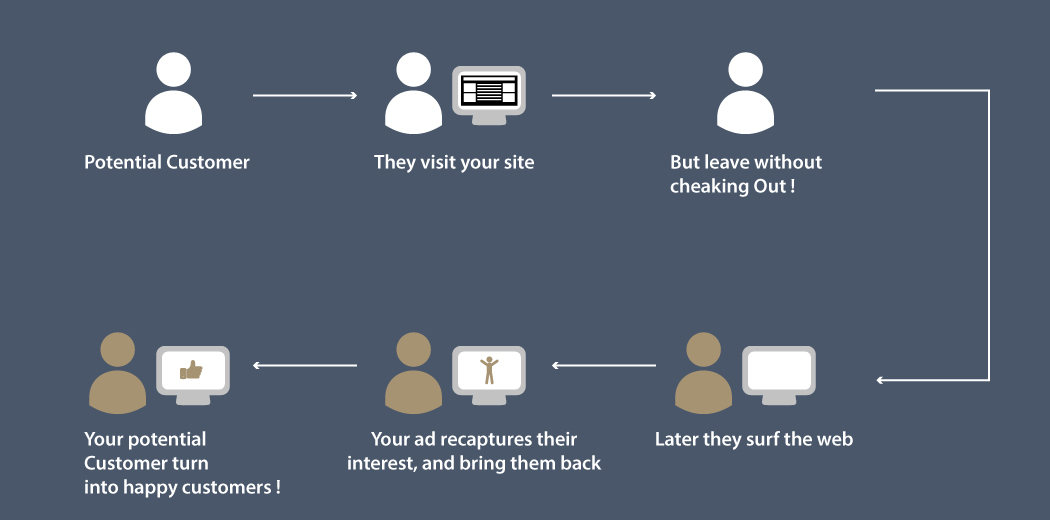
In this problem, the task is to predict click probability, i.e., the probability of a user clicking the ad which is shown to them on the partner websites for the next 7 days on the basis of historical view log data, ad impression data and user data.
The participants were provided with:
- View log of users (2018/10/15 – 2018/12/11)
- Product description collected from the Zbay website
- Training data and test data containing details for ad impressions at the partner websites (Train + Test)
The training data contains the impression logs during 2018/11/15 – 2018/12/13 along with the label which specifies whether the ad is clicked or not. The final model was evaluated on the test data which has impression logs during 2018/12/12 – 2018/12/18 without the labels.
Late Submission – Get Your Rank Now !!
The contest is over but you can still make submissions to this contest and get your rank. Download the dataset from here and see if you can beat the top score.
Dataset Description
The participants were provided with the below files:
- train.zip: This contained 3 files and I have provided a description of each file below
- test.csv: The test file contained the impressions for which the participants needed to predict the click rate
train.csv:
| Variable | Definition |
| impression_id | AD impression id |
| impression_time | Time of the impression at partner website |
| user_id | user id |
| app_code | Application Code for a partner website where the ad was shown |
| os_version | Version of operating system |
| is_4G | 1-Using 4G, 0-No 4G |
| is_click | (target) Whether user clicked the AD (1-click, 0-no click) |
view_log.csv:
| Variable | Definition |
| server_time | Timestamp of the log |
| device_type | Device type of the user |
| session_id | Browser session id |
| user_id | user id |
| item_id | Item id |
item_data.csv:
| Variable | Definition |
| item_id | Item id |
| item_price | Price of the item |
| category_1 | Category depth 1 |
| category_2 | Category depth 2 |
| category_3 | Category depth 3 |
| product_type | anonymized item type |
Winners of the WNS Analytics Wizard 2019 Hackathon
Winning a hackathon is a remarkably challenging task. There are a lot of obstacles to overcome, not to mention the sheer amount of competition from the top data scientists in the world.
I loved going through these top solutions and approaches provided by our winners. First, let’s look at who won and congratulate them:
- Rank 1: Roman Pyankov
- Rank 2: Sergey Arefiev
- Rank 3: Team AK (predictt.ai)
You can check out the final rankings of all the participants on the Leaderboard.
The top three winners have shared their detailed approach from the competition. I am sure you are eager to know their secrets so let’s begin.
Rank 3: Team AK (predictt.ai) (Aakash Kerawat & Akshay Karangale)
Here’s what Team AK shared with us.
Approach
Our final solution was an ensemble of LightGBM, Neural Networks and CatBoost models.
Taking a cursory look at the datasets, it seemed that the features generated from view_logs would play a significant role in improving the score. But soon we discovered that most of the features generated from view_logs were overfitting the training set.
This was because a higher percentage of training data had recent view_logs than in the test set. So, we focused more on feature engineering on the training set.
The features that worked for us were percentage_clicks_tilldate per user/app_code/user_app_code. These features alone helped us reach 0.73xx on the public leaderboard. Along with these, we used some time-based features and a couple of features from view_logs.
We both had slightly different approaches giving similar public leaderboard scores of around 0.75xx.
Apart from these common features, we used a few different techniques/features in our individual approaches giving scores of around 0.75xx. Our final submission was ranking the average of our best individual models.
Aakash’s approach:
- My most powerful features were target-based, i.e, mean of previous clicks for user_id, for app_code and for user_id/app_code combined. A weighted average of the above also proved to be important (giving higher weights to more recent records). Other features I created were:
- time_since_prev_ad
- number_of_impressions (for user)
- sum_of_prev_clicks
- impression_time_hour, etc.
- I engineered features for view_logs separately and then joined them based on the most recent server_time. However, only one feature – number of views – was helpful while others were overfitting
- A strong validation strategy was important for this problem as there was an intersection in the train and view_logs data. I designed the validation set replicating the test set (no intersection between the validation set and view_logs)
- Finally, I trained 20 LightGBM models and 20 fully-connected neural networks (all models having a random state as the only difference), took the arithmetic mean for the LightGBM models and the neural network models. And finally, I took the harmonic mean of the two outputs. This gave a public leaderboard score of 0.754x
Akshay’s approach
My validation strategy was a simple time-based split:
- Since view_logs features were overfitting on the training set, I created an extra dataset from view_logs dataset: train_view_logs (a subset of the original data without overlap on train dataset)
- I used train_view_logs for creating features for the training dataset and used original view_logs for creating features for the test dataset
- The app_code feature was very important so I decided to encode it in a way so as to capture the hidden relationships between them. I used a word2vec model to convert app_codes to 100-dimensional vectors and used them instead of the original app_codes variable
- Apart from these, I created features like:
- time_since_prev_impression
- time_to_next_impression
- last_impression_app_code
- peak_to_peak_server_time (per user), etc.
- Using these features, I trained 15 LightGBM models with different seeds and a single CatBoost model. I took a simple average of these models to reach 0.754xx on the public leaderboard.
You can check out the full code for this approach here.
Rank 2: Arefev Sergei
Here’s what Arefev shared with us.
Overall Approach
-
- Using gradient boosting as the main algorithm
- Stratified cross-validation
- User standard for click prediction problems features (value counts and mean encoding by ids, the difference between click times, group by id, and length of unique items)
- Feature selection and fine-tuning parameters of the model
Let’s look at Arafev’s step-by-step approach now.
Data-preprocessing and Feature Engineering
- Standard features from train.csv:
-
- ‘os_version’
- ‘is_4G’
- ‘value_counts_app_code’: Frequency encoding for app code feature
- ‘mean_target_user_id’: mean value of target for every user_id in the past
-
- User_id time features:
- Time from last and from next impression by user_id
- Minimum time between impressions by user_Ids
- User_id numbers features:
- Number of unique app_code for every user_id
- Difference between the number of unique app_code and value_counts for every user_id
- Number of unique items frow view_log.csv which the user was looking for time over a week ago ( impression_time – 7 days)
- Number of user impressions in the past and value_counts by user_ids in view_log
- Group by app_code: For every app_code, calculate the mean value by these features:
- ‘mean_target_user_id’
- ‘value_counts_user_id’
- Time from next impression by user_id
My final model
-
- My final model is a mean rank (sort predictions from one model and give them rank from 0 to the length of the test dataset) of predictions from 5 models. These are trained on different train sets by stratified validation
- Changing validation from time series to stratified gave me a ~0.01 jump in the score. Also, I dropped features like app_code and user_id, although they gave a better score on validation
- Now, I had about 50 features. I calculated the feature importance of gradient boosting for the full set of features, sorted them from high to low, and started dropping features one by one. In the end, I got the final subset of the features described above
Key Takeaways
-
- Use stratified cross-validation if the distribution of the target variable does not change in time
- Use time and number statistics by ids
- Group by main ids
- Drop features if you think they will overfit your model
Things a participant must focus on while solving such problems
-
- Choose the right validation
- Start with a small set of features
- Start Using Gradient Boosting
- Do feature selection
Here’s the full code for Arefev’s approach.
Rank 1: Roman Pyankov
Here’s what Roman shared with us.
Approach
My solution consists mainly of feature engineering.
I generated features based on user id and app code characteristics. This is described in more detail below. I trained a LightGBM model on 10 different subsamples. As a final prediction, I averaged these models by rank.
Validation Scheme
For validation, I used StratifiedKFold (from sklearn.model selection) with the below parameters:
- n_splits = 10
- random-state = 228
- shuffle = True
Feature Engineering
- I encoded the string values of the ‘os version‘ columns to integer values (category number)
- From the column ‘impression time’, I made two new features – ‘hour’ and ‘minute’
- user_id: I calculated the number of unique values from the column ‘app_code’(‘cnt unique app’). Calculated the difference and ratio between number of unique values and the number of all values for the user_id (’gg 1 diff’, ’gg 1 ratio’)-
- app_code: I calculated the number of unique values from the user_id column. Calculated the difference and ratio between the number of unique values and the number of all values for app code id (’gg 2 diff’, ’gg 2 ratio’)
- For each ‘user_id’ I calculated the mean, min, and max difference between two consecutive ‘impression_time’ (’diff time mean’, ’diff time max’, ’diff time min’)
For each user_id and impression_time, I calculated:
- The time from the current impression time to the previous and next user action. Calculated the average number of actions which a user clicked for a previous time (‘diff time user id last’, ’diff time user id next’, ’value mean user id’)
- The time from the current impression time to the previous and next app code action for each app_code and impression_time. The calculated average number of activities which users with this app_code clicked for previous time (’diff time app code last’, ’diff time app code next’, ’value mean app code’)
- Number of activities in view log for previous time (’value cnt view user id’)
- The mean, min, and max difference between two consecutive ‘server time’ in view log for previous time (’value diff time view user id ’value diff time view user id max’, ’value diff time view user id min’)
- Number of unique values of the columns from view_log with item data: [‘session id’, ‘item id’, ‘cate- gory 1’, ‘category 2’, ‘category 3’, ‘product type’](’user id unique session id’, ’user id unique item id’, ’user id unique category 1’, ’user id unique category 2’, ’user id unique category 3’, ’user id unique product type’)
- The mode of the values of the columns from view_log with item data: [‘item id’, ‘category 1’, ‘category 2’, ‘category 3’, ‘product type’]( ’user id mode item id’, ’user id mode category 1’, ’user id mode category 2’, ’user id mode category 3’, ’user id mode product type’)
Final Model
I used LightGBM as my final model with the below parameters:
- bagging fraction = 0.8
- bagging freq = 1
- boost = gbdt
- feature fraction = 0.8
- learning rate = 0.01
- metric = ‘AUC’
- num leaves = 31
- objective = binary
I used a StratifiedKFold with 10 folds, so I got 10 models that were used to make predictions on the test data. Rank averaging among these 10 predictions was used as the final prediction. On local validation, I got the following average ROC-AUC value: 0.7383677000.
For such problems, a participant must focus on:
- Feature engineering
- Building competent validation
- Competent work with categorical features
- Setting model parameters
- Overfit control
And here is the full code for Roman’s winning solution!
End Notes
Phew – take a deep breath. Those were some mind-blowing frameworks that won this hackathon. As I mentioned earlier, it is quite a task winning a hackathon and our three winners really stood out with their thought process.
I encourage you to head over to the DataHack platform TODAY and participate in the ongoing and upcoming hackathons. It will be an invaluable learning experience (not to mention a good addition to your budding resume!).
If you have any questions, feel free to post them below.
IIT Bombay Graduate with a Masters and Bachelors in Electrical Engineering. I have previously worked as a lead decision scientist for Indian National Congress deploying statistical models (Segmentation, K-Nearest Neighbours) to help party leadership/Team make data-driven decisions. My interest lies in putting data in heart of business for data-driven decision making.


Congratulations to all the winners and thank you for sharing the Winner's approach and codes. This is why Analytics Vidhya is the best place to learn Machine Learning.
Many many congratulation to all winners. I really appreciate your article. Thank You Sir
Where can I get the original dataset?