This article was published as a part of the Data Science Blogathon.
Introduction
The key step in solving any machine learning problem is knowing the underlying data. You need to know what to do more than how to do, isn’t it? Data exploration includes visualizing your data, cleaning it, more often than not helps you to make an initial level strategy for the problem at hand.
In this article, we would be exploring suicides in India. We would be using Matplotlib and Seaborn libraries to graphically represent the data and note down our observations.
Order of content:-
1) About the data
2) Data preprocessing
3) Data exploration and visualization
About the data
The dataset for this assignment is available on Kaggle
Context This data set contains yearly suicide details of all the states/u.t of India by various parameters from 2001 to 2012.
Parameters:
a) Suicide causes b) Education status c) By means adopted d) Professional profile e) Social status
Data preprocessing
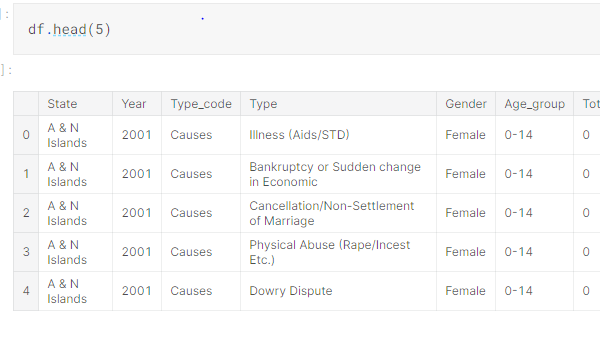
After importing standard libraries and loading the data in a pandas DataFrame, we have a look at the data
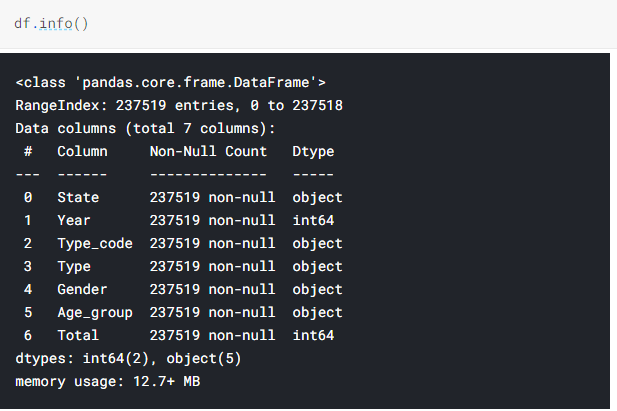
The data does not contain any NULL values.
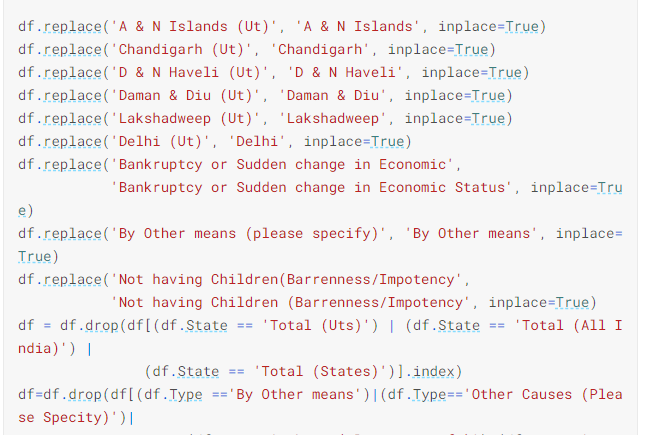
As part of data cleaning, we replace some states which are mentioned separately in the dataset like A & N Islands (Ut), A & N Islands, as both these entries are for Andaman and Nicobar Islands and there is no point in having separate entries for them. Similarly, other multiple entries for states and type codes have been replaced as in the below screenshot.
Data exploration and visualization
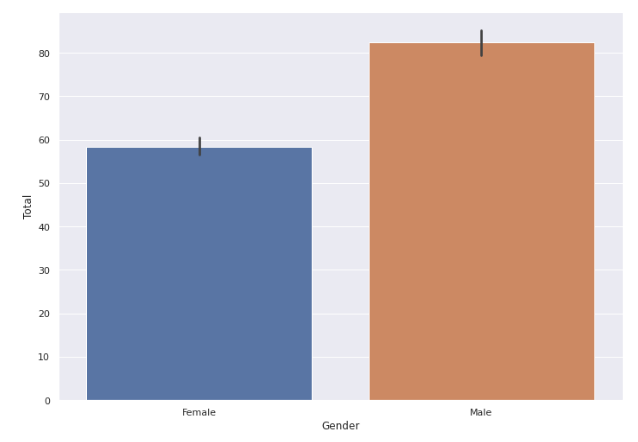
A quick look at the gender-wise distribution of people committing suicide tells us that we have more males committing suicide than women.

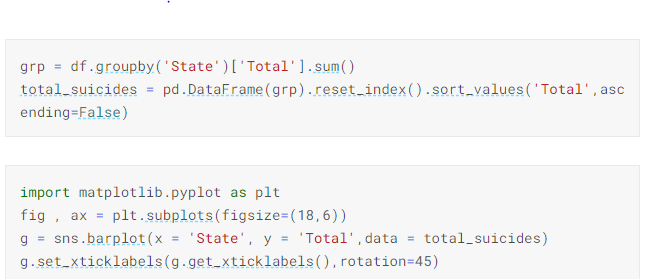
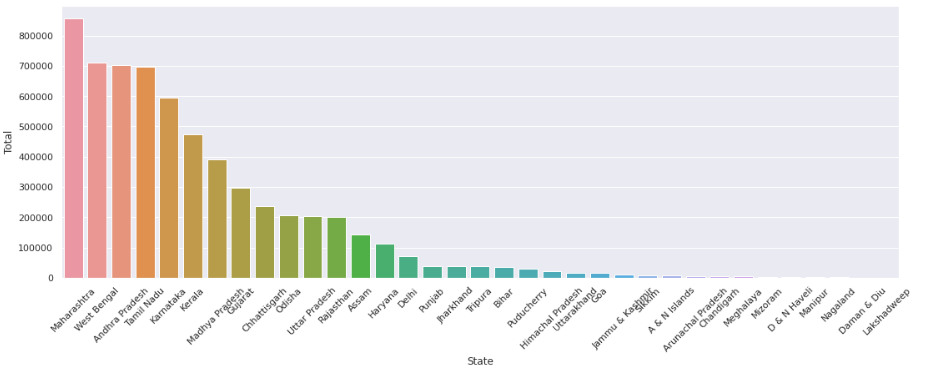
Next, we look at the state-wise suicide numbers to find out that the states with the highest number of suicides are Maharashtra, West Bengal, Andhra Pradesh, Tamil Nadu, and Karnataka.
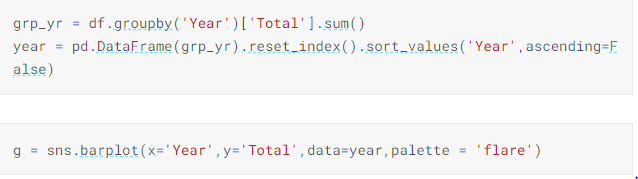
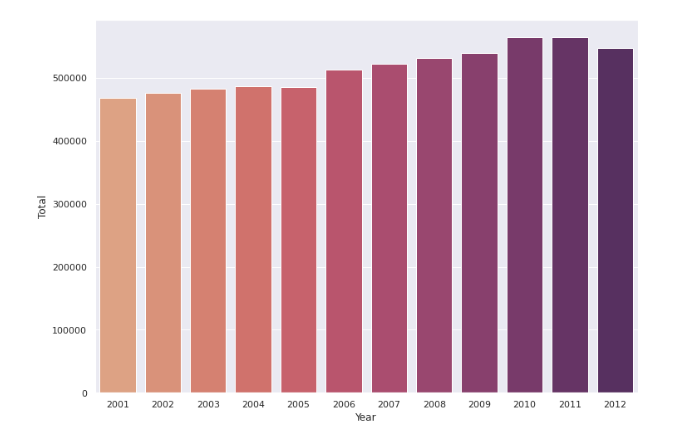
We see a gradual increase in the number of suicides every year, however, in 2012 we have a dip in the numbers as compared to 2011.
Exploring the type code feature gives us the below graph
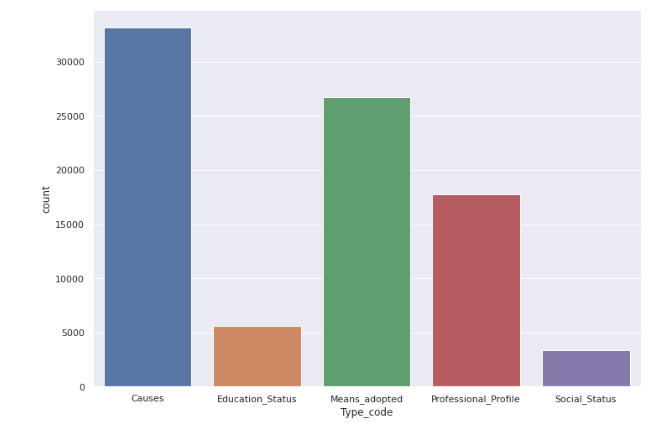
The type code gives us information on the basis of
a) Suicide causes b) Education status c) By means adopted d) Professional profile e) Social status
Let’s look at each of them one by one.
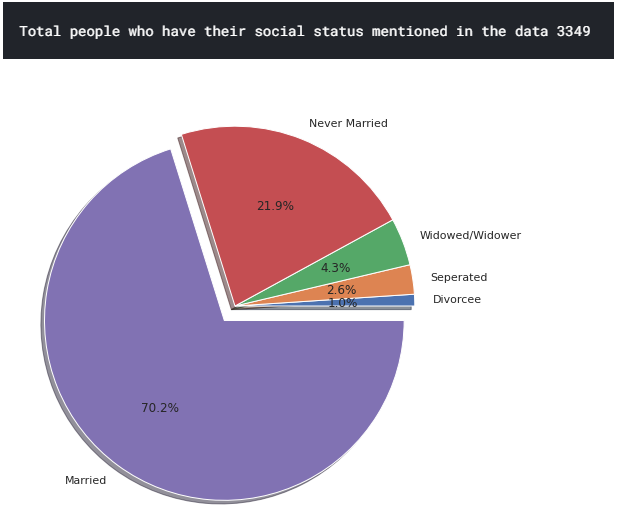
Social Status
We have 3349 people in the data who have their social status mentioned out of which 70.2%(highest) suicides are of people who were married and 1%(lowest) suicides of divorcees.
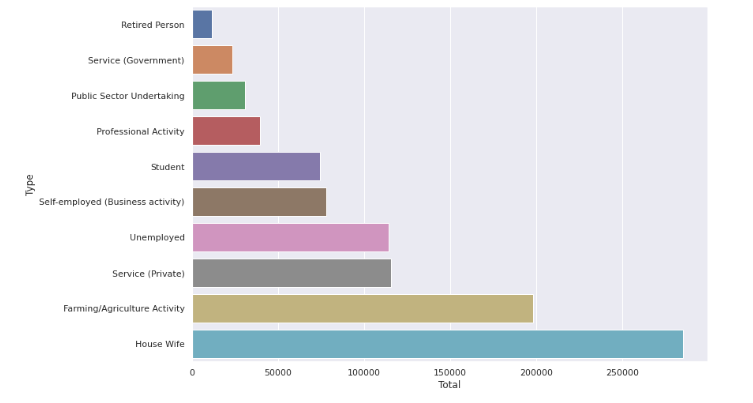
On visualizing the professional profile type code we see the following results.
Out of the 17782 people whose profession is known to us through the data housewives, people involved in farming and agricultural activities, private service employees are the majority of people to suicide.
We next look at the means that are adopted by people to commit suicide.
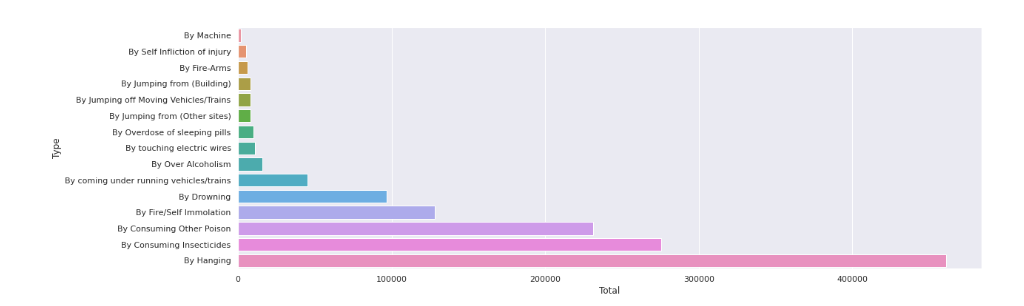
Observation
Hanging, Consuming Insecticides and poison, self-immolation are the top means adopted by people who suicide.
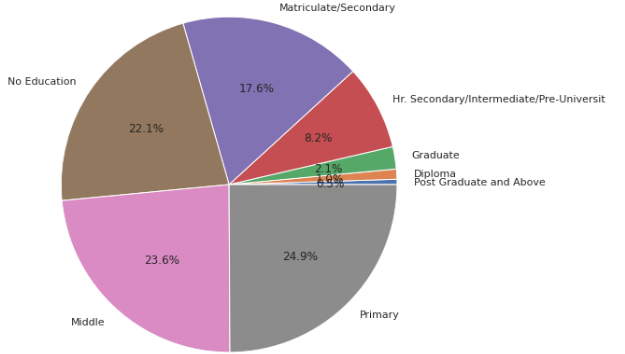
Looking at the education type code, a trend that can be observed is with higher education there is a fall in the number of suicides.
Now let us understand the top causes of people who suicide by looking at the causes type code.
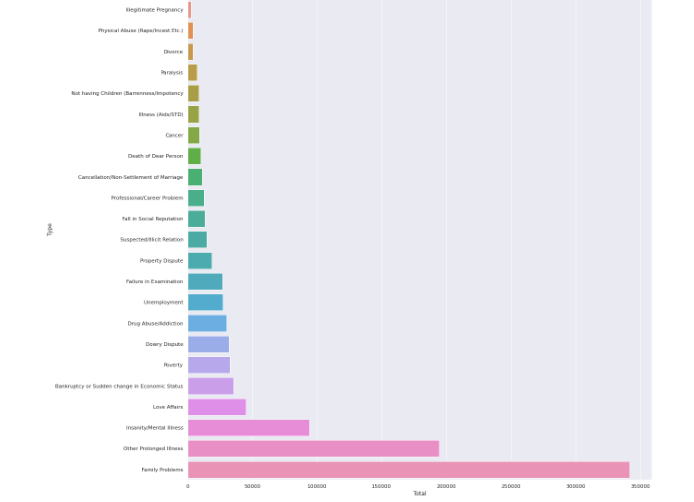
The top causes of suicide that data reveals are-
1) Family Problems 2) Prolonged Illness 3) Mental Illness 4) Love affairs 5) Bankruptcy or sudden change in economic status.
I personally enjoyed this visualization and exploration assignment on a real-world dataset, let me know if you did too in the comments. The full code for my work can be found here.
A tiny bit about myself:-
I am Alifia Ghantiwala, a computer engineer who likes finding insights from data. Currently, I work as a Software Engineer with BNP Paribas India Solutions, you can connect with me on LinkedIn
The media shown in this article are not owned by Analytics Vidhya and is used at the Author’s discretion.


