This article was published as a part of the Data Science Blogathon.
Introduction
Phonepe, Google Pay (Tez) are ubiquitous names in the Indian payment ecosystem and the top two players in the area. According to Phonepe pulse report, it has133 million monthly active users as of July’21. For the Q3-21 quarter, the total transactions were 526.8 Cr and total transaction of 9 Lakh Cr and an average transaction value of Rs1,751. Another payment major who recently launched its IPO of Rs 18300 Cr is Paytm, a huge player, a unicorn, like its counterpart Phonepe. It has 337M registered customers 21.8M merchants, and in FY21, its GMV was Rs 4 Trillion, of which revenue was 28.02 B. All this has been made possible by three major changes 1. NPCI-UPI, 2. Smartphone penetration and 3. High-speed internet. The pilot launch UPI project was on 11th April 2016 by Dr Raghuram G Rajan, then Governor, RBI at Mumbai. Banks started uploading their UPI enabled Apps on the Google Play store from 25th August 2016 onwards.
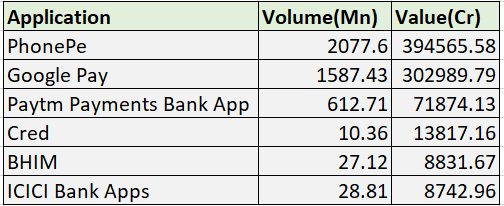
In the last quarter(Dec-21), the top 5 UPI applications based on volume are:
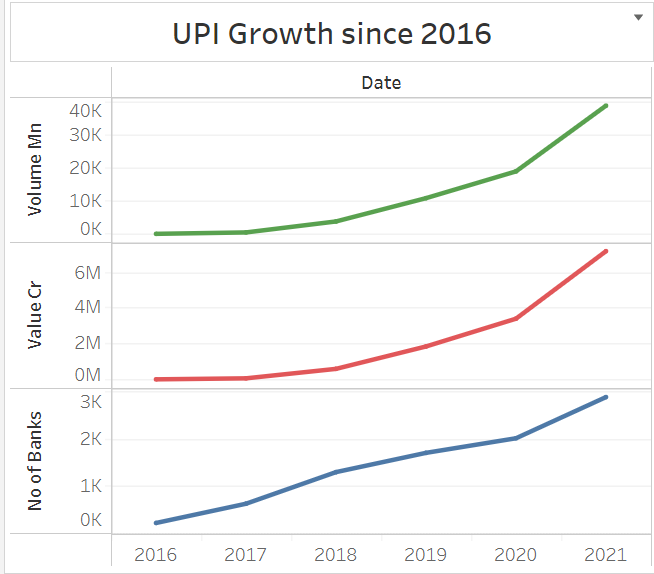
UPI has seen phenomenal growth since 2016 – from 2M transactions in 2016 to over 4500M transactions in 2021. All this data is readily available on the NPCI website.
The backbone of this growth has been adoption in Tier1 and 2/3 cities, customer retention efforts, faster transaction (some with 2 seconds), exploiting new areas of growth(Cred as successfully done with credit cards). Data science has played its part in this growth, be it customer churn modelling, pricing models, growth models, fraud detection models, optimization models, risk analysis etc.
This article explores the world of customer churn prediction and recommendation. Just predicting churn has little value; the actions that need to be taken to arrest that churn personalize those actions and derive value; this is a major part that many churn prediction articles do not focus on. The below image depicts the complexity that comes after churn prediction. There are eight possible combinations in a simplistic view; the model predicts a customer is going to churn in the next six months(depending on how the model is trained), personalised coupon(refer to Amazon pay coupon below) or promotion is sent, the user retains, this adds value, the opposite of this is even with retention efforts the user churns, and customers are lost causes. While churn prediction models cannot differentiate between these users, the Uplift modelling technique helps identify these use cases and target only customers who provide an uplift.
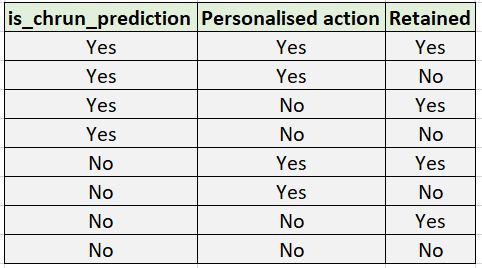

Table of Content
- Problem statement
- Explore dataset
- Data preprocessing
- Exploratory data analysis
- Data visualization
- Clustering using heuristics
- Clustering using Kmeans
- Clustering using Deep learning
- Churn prediction using machine learning models
- Churn prediction using deep learning models
- Retention strategy and recommendation
- Additional data sources
Problem Statement
Customer segmentation to reduce churn, churn prediction, and recommendation to arrest churn are the three board areas that modern B2C firms tackle using data science. A few firms are exploring uplift modelling and means to save costs. Uplift models can predict if a customer churns and is given an action, which customers have a high probability of retention, and only those customers will be targeted. Finding the right segment to target when there are millions of active customers is a tedious task and a resource-intensive, cost-intensive activity; uplift modelling can help mitigate the risks of targeting customers who aren’t going to buy. Thus reducing irritating marketing messages and notifications.
This article will focus on
- Customer segmentation with an eye for retention.
- Churn prediction
- Recommendation to reduce churn and increase retention.
Explore Dataset
Data can be downloaded here.
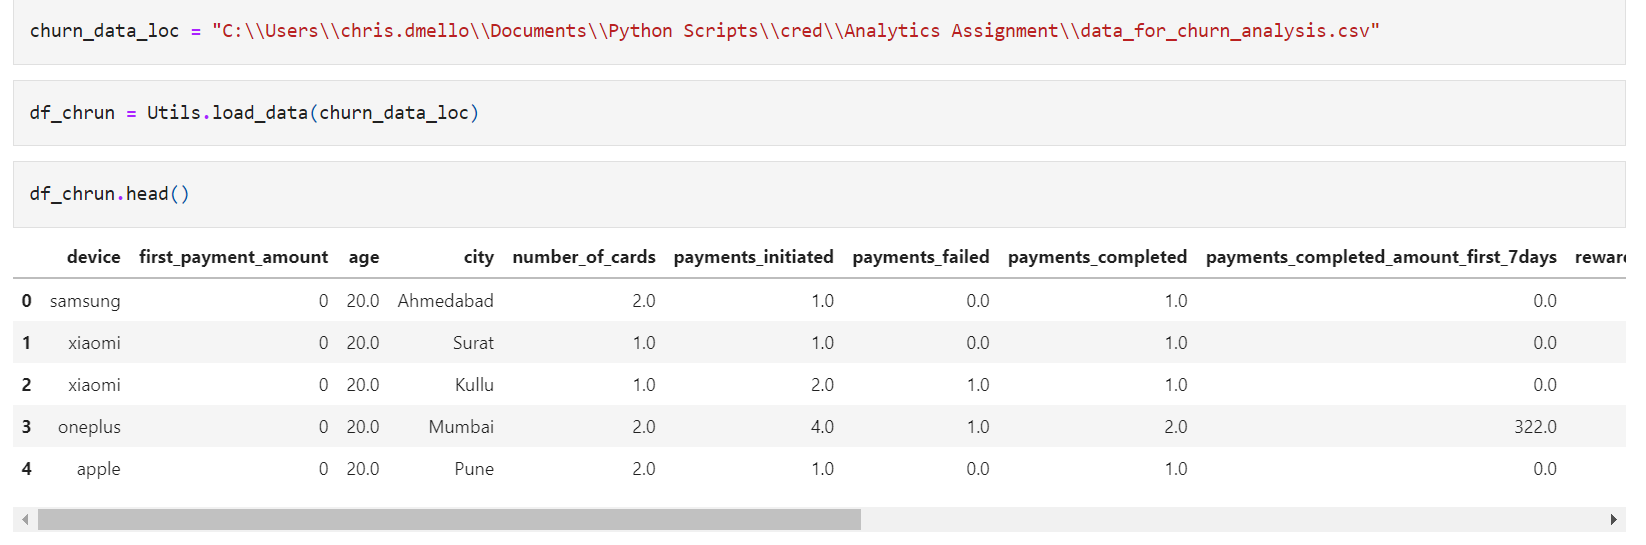
The dataset has 18 columns:
- device user’s – device brand (Categorical)
- first_payment_amount – user’s first payment amount(Numeric)
- age – user’s age(Numeric or categorical?)
- city – user’s city(Categorical)
- number_of_cards – #of cards user owns
- payments_initiated – #of payments initiated by user
- payments_failed – #of payments failed
- payments_completed – #of payments completed
- payments_completed_amount_first_7days – amt of payment completed in first 7 days of joining
- reward_purchase_count_first_7days – #of rewards claimed in first 7 days
- coins_redeemed_first_7days – coins redeemed in first 7 days
- is_referral – is user a referred user
- visits_feature_1 – #of visits made by user to product feature 1
- visits_feature_2 – #of visits made by user to product feature 2
- given_permission_1 – has user given permission 1
- given_permission_2 – has user given permission 2
- user_id – user identifier
- is_churned – whether user churned
Data Pre-Processing
Apart from a few variables – device, age, city, is_referral, all NA’s can be filled with 0.
df_chrun.fillna(0, inplace = True)
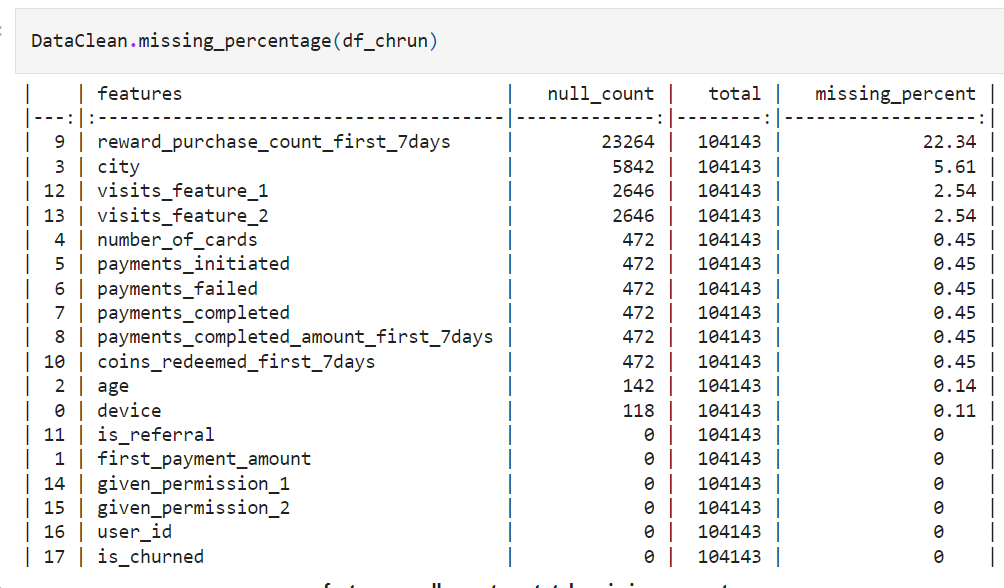
Percentage of NULL values for rewards_puchase_count_first_7days is very high @ 22%. One option is to leave this column and proceed with the analysis.
City variable has 5% NULL; the city is important as it provides geographical information that can serve as a proxy for income elasticity of the customer or basically serve as a proxy for internet penetration etc. Cities can be Tiered into 3 to 5 and used as a categorical variable; hence fixing NULL’s here serves an important purpose.
    @staticmethod
    def missing_percentage(df_insurance_train, other_dict = {}):
        '''
        input is a dataframe

        returns : the percentage of missing values
        '''

        missing_df = df_insurance_train.isnull().sum().reset_index()
        missing_df["total"] = len(df_insurance_train)
        missing_df.columns = ["features", "null_count", "total"]
        missing_df["missing_percent"] = round(missing_df["null_count"]/missing_df.total*100, 2)
        missing_df.sort_values("missing_percent", ascending = False, inplace = True)

        print(missing_df.to_markdown())
        return missing_df
Should age be used as a continuous variable or as a bucket?
Exploratory Data Analysis
Simplifying data questions to business questions and vice versa-
- Which users have higher retention – organic or inorganic?
- What effect do devices have on churn? Is it an important variable?
- Does first payment play an important role in retaining users?
- Do inorganic users download the app for monetary benefit, or do they intend to use it?
- Can higher payment/conversion translate to retention?
- What is the impact of age on customer churn? Is it is linear relationship quadratic?
- What is the impact of rewards and discoverability?
Tableau has been used for EDA.
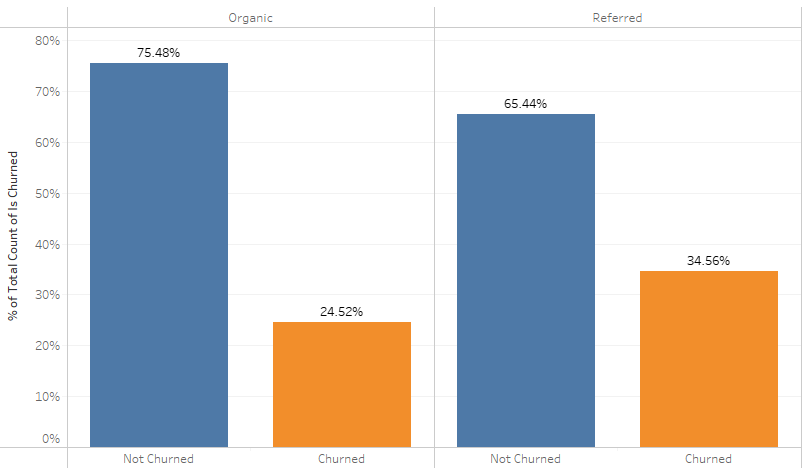
Which users have higher retention – organic or inorganic?
- Referred users have to engage more with rewards/notifications to avoid higher churn.
- 35% of referred users churned compared to 25% of organic, switch to more engaging referrals, such as staggered coupons based on payments to keep them hooked.
% Users churned vs retained (screenshot)
# Users based on referrals (screenshot)
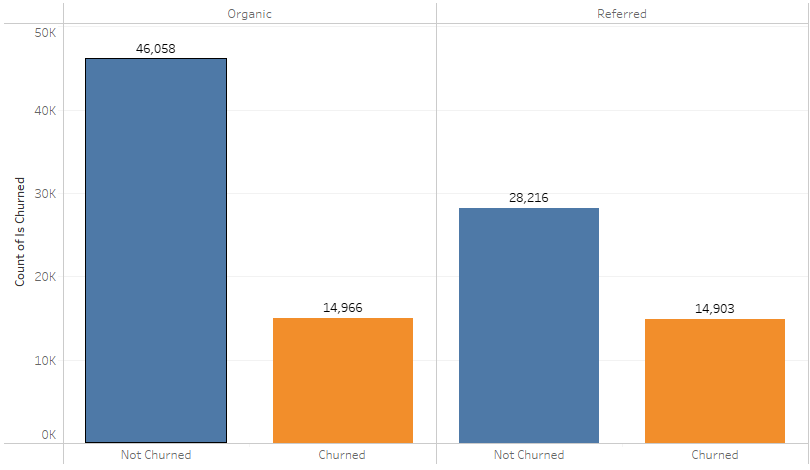
Legend used :
- Blue – Not Churned
- Orange – Churned
What effect do devices have on churn? Is it an important variable?
- High-end device users have churned less as compared to budget phone users.
- Churned users have half the bills paid and amount transacted compared to retained. Incentivize or push to double the # of payments and amount paid in the first seven days to reduce churn.
% Churned vs Retained users based on devices (screenshot)

# of payments and amount paid based on churned vs retained(screenshot)

Does first payment play an important role in retaining users?
- Users need to be nudged to complete the first payment, ensuring retention.
- Referred users amount paid is 50% less compared to organic users.
- Ensure more than four payments to reduce churn.
The total amount paid and % of total users of 0 First payment vs greater than 0 users(screenshot)

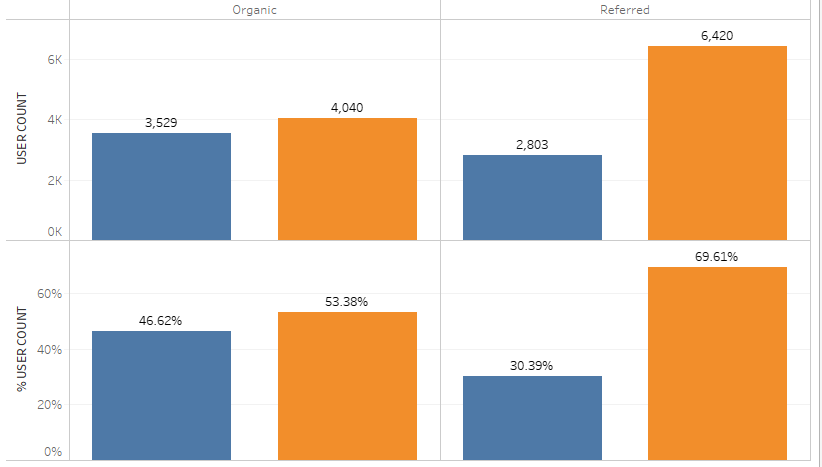
Do inorganic users download the app for monetary benefit, or do they intend to use it?
- Referred users with 0 First payment churned higher than organic users.
- Nudge referred users to make immediate first payment – Mobile recharge, electricity bill etc.
Total users and % of total users of 0 First payment – Organic vs Referral (screenshot)
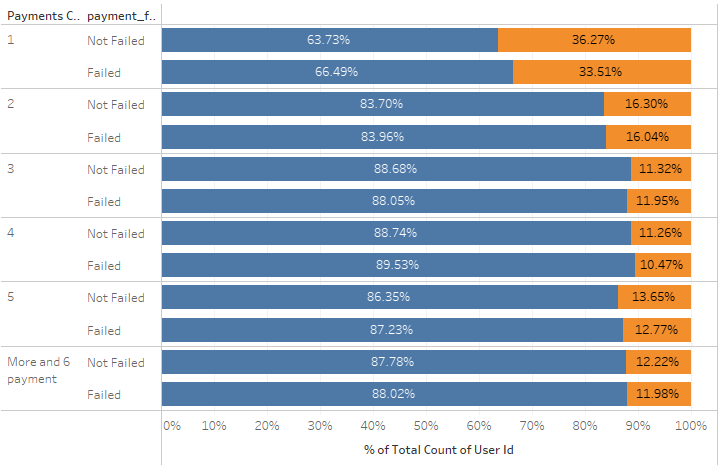
Can higher payment/conversion translate to retention?
- The payment failure did not have a significant impact on churn.
- Churn was reduced drastically when users transacted more than once.
% users based on total # of payments and impact of payment failure on churn(screenshot)
What is the impact of age on customer churn? Is it is linear relationship quadratic?
- Users below 20 are low to create an impact churn 33% faster than the rest.
- Above 40 users churn faster than the rest. This further can be explored based on feature use and rewards.
Distribution of churn based on user age(screenshot)

What is the impact of rewards and discoverability?
- Churned users have redeemed on average lower # of coins.
- Retained users have purchased higher amounts of rewards using coins.
- Retained users have redeemed more than 150% of coins and bought 33% higher rewards than churned users.
Averaged coins redeemed and rewards bought has a great influence on churn(screenshot)

Summary of EDA
- 35% of referred users churned compared to 25% of organic, switch to more engaging referrals, such as staggered coupons based on payments to keep them hooked.
- Referred users amount paid is 50% less compared to organic users.
- High-end device users have churned less as compared to budget phone users.
- Churned users have half the bills paid and amount transacted compared to retained. Incentivize or push to double the # of payments and amount paid in the first seven days to reduce churn.
- Users need to be nudged to complete the first payment, ensuring retention.
- Ensure more than four payments to reduce churn.
- Referred users with 0 First payment churned higher than organic users.
- Nudge referred users to make immediate first payment – Mobile recharge, electricity bill etc.
- Users below 20 are low to create an impact churn 33% faster than the rest.
- Above 40 users churn faster than the rest.
- Retained users have redeemed more than 150% of coins and bought 33% higher rewards than churned users.
Data Visualization
Tableau is easy to use and versatile, and anyone without an analytics or BI background can create awesome visualizations with some guidance and practice. Follow this tutorial on Tableau for beginners. It provides complete details on how to download tableau public, use it for basic plots, and build dashboards.
An online version of the EDA is uploaded on Tableau public; curious viewers can play around to find insights.
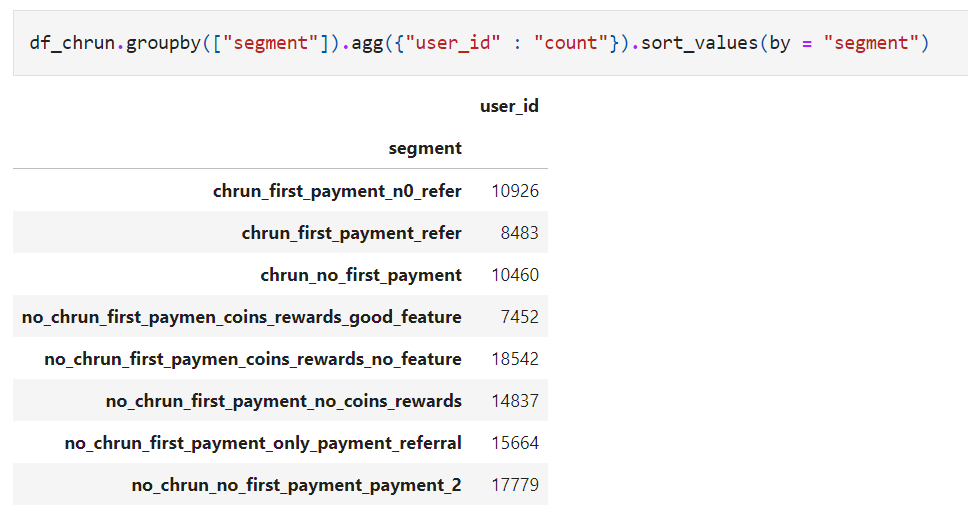
Clustering Using Heuristics
When time is of the essence, business leaders tend to use heuristics based on their experience, domain knowledge, and depth of expertise; it is easy to segment based on a few rules or set of rules. This approach is quick and easy to explain. Business leaders tend to value explainability more while making strategic decisions, and this approach
Code
## Final Segments
df_chrun["segment"] = np.where(((df_chrun.is_churned == 1) & (df_chrun.first_payment_amount == 0 | df_chrun.first_payment_amount.isna() ))
                               ,"chrun_no_first_payment",
                               np.where(((df_chrun.is_churned == 1) & (df_chrun.first_payment_amount > 0)  & (df_chrun.is_referral == False) )
                               ,"chrun_first_payment_n0_refer",
                                np.where(((df_chrun.is_churned == 0) & ((df_chrun.payments_completed >2)   | (df_chrun.first_payment_amount == 0 | df_chrun.first_payment_amount.isna() )))
                               ,"no_chrun_no_first_payment_payment_2",
                                np.where(((df_chrun.is_churned == 0) & (df_chrun.first_payment_amount >0  ) & (df_chrun.payments_completed == 1  ) & (df_chrun.is_referral == True))
                               ,"no_chrun_first_payment_only_payment_referral",
                               np.where(((df_chrun.is_churned == 1) & (df_chrun.first_payment_amount > 0)  & (df_chrun.is_referral == True))
                               ,"chrun_first_payment_refer",
                               np.where(((df_chrun.is_churned == 0) &
                                        ((df_chrun.reward_purchase_count_first_7days == 0) | (df_chrun.reward_purchase_count_first_7days.isna()) |
                                         (df_chrun.coins_redeemed_first_7days == 0) | (df_chrun.coins_redeemed_first_7days.isna())))
                               ,"no_chrun_first_payment_no_coins_rewards",
                               np.where(((df_chrun.is_churned == 0) & (df_chrun.first_payment_amount > 0)  &
                                         ((df_chrun.visits_feature_1 == 0 | df_chrun.visits_feature_1.isnull()) &
                                          (df_chrun.visits_feature_2 == 0 | df_chrun.visits_feature_2.isnull())) &
                                        ((df_chrun.reward_purchase_count_first_7days > 0) | (df_chrun.coins_redeemed_first_7days > 0)))
                               ,"no_chrun_first_paymen_coins_rewards_no_feature", "no_chrun_first_paymen_coins_rewards_good_feature")))))))
screenshot
Clustering using Kmeans
Kmeans is the goto clustering algorithm for its ease of understanding. Kmeans considers continuous variables only; hence categorical features have been dropped. Steps involved in K-means clustering.
Code
import matplotlib.pyplot as plt
# from kneed import KneeLocator
from sklearn.datasets import make_blobs
from sklearn.cluster import KMeans
from sklearn.metrics import silhouette_score
from sklearn.preprocessing import StandardScaler
df_chrun = Utils.load_data(churn_data_loc)
cols_to_consider = ["first_payment_amount","age","number_of_cards","payments_initiated","payments_failed","payments_completed","payments_completed_amount_first_7days","reward_purchase_count_first_7days","coins_redeemed_first_7days","visits_feature_1","visits_feature_2"]
df_chrun.fillna(0, inplace = True )
df_chrun.replace(0, 0.9 ,inplace = True )
thresh = df_chrun.quantile([.25,.75, 0.95])
display(thresh)
df_chrun = df_chrun.clip(upper=thresh.loc[.95],axis=1)
df_chrun = df_chrun[cols_to_consider].apply(pd.to_numeric)
df_chrun = np.log(df_chrun)
scaler = StandardScaler()
scaled_features = scaler.fit_transform(df_chrun)
kmeans = KMeans(
    init="random",
    n_clusters=7,
    n_init=10,
    max_iter=300,
    random_state=42
)
kmeans.fit(scaled_features)
kmeans_kwargs = {
    "init": "random",
    "n_init": 10,
    "max_iter": 300,
    "random_state": 42,
}
# A list holds the SSE values for each k
sse = []
for k in range(1, 11):
    kmeans = KMeans(n_clusters=k, **kmeans_kwargs)
    kmeans.fit(scaled_features)
    sse.append(kmeans.inertia_)
plt.style.use("fivethirtyeight")
plt.plot(range(1, 11), sse)
plt.xticks(range(1, 11))
plt.xlabel("Number of Clusters")
plt.ylabel("SSE")
plt.show()
predict=kmeans.predict(scaled_features)
df_chrun['segment_new'] = pd.Series(predict, index=df_chrun.index)

Kmeans elbow curve(screenshot)
The elbow curve shows the # of clusters that can go upto 11 or 12, but clusters need to be worthwhile, so in this article, eight has been chosen as the optimum cluster.
Some issues faced with K-means clustering:
- Large # of 0;s
- How to deal with categorical features.
-
How to cap outlier based on thresholds.
Clustering Using Deep Learning
Autoencoders are used to learn feature representation; it forces the network to create a compressed version of input data. The compressed data is passed as an input to find the optimal value of k. WCSS – the within-cluster sum of squares plot of simple means, and autoencoder-means justify the use of autoencoders.
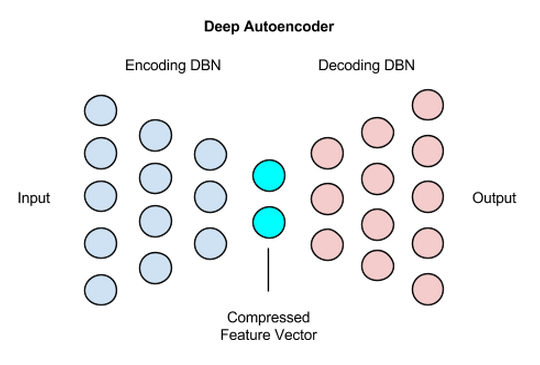
https://wiki.pathmind.com/deep-autoencoder
Code:
df_fintec = pd.read_csv("https://raw.githubusercontent.com/chrisdmell/Project_DataScience/working_branch/07_cred/Analytics%20Assignment/data_for_churn_analysis.csv")
cols_basic_model = ['number_of_cards',
'payments_initiated',
'payments_failed',
'payments_completed',
'payments_completed_amount_first_7days',
'reward_purchase_count_first_7days',
'coins_redeemed_first_7days',
'is_referral',
'visits_feature_1',
'visits_feature_2',
'given_permission_1',
'given_permission_2']
df_fintec_LR = df_fintec[cols_basic_model]
df_fintec_LR["is_referral"] = df_fintec_LR["is_referral"].astype(int)
df_fintec_LR.fillna(0, inplace = True)
oh_cols = ["is_referral","given_permission_1","given_permission_2"]
df_fintec_LR.drop(columns = oh_cols, inplace = True)
#KMEANS#
scaler = StandardScaler()
creditcard_df_scaled = scaler.fit_transform(df_fintec_LR)
display(creditcard_df_scaled.shape)
score_1 = []
range_values = range(1, 20)
for i in range_values:
kmeans = KMeans(n_clusters = i)
kmeans.fit(creditcard_df_scaled)
score_1.append(kmeans.inertia_)
#AUTOENCODERS#
input_df = Input( shape = (len(creditcard_df_scaled[0]), ))
x = Dense(7, activation = 'relu')(input_df)
x = Dense(500, activation = 'relu', kernel_initializer='glorot_uniform')(x)
x = Dense(500, activation = 'relu', kernel_initializer='glorot_uniform')(x)
x = Dense(2000, activation = 'relu', kernel_initializer='glorot_uniform')(x)
encoded = Dense(10, activation = 'relu', kernel_initializer='glorot_uniform')(x)
x = Dense(2000, activation = 'relu', kernel_initializer='glorot_uniform')(encoded)
x = Dense(500, activation = 'relu', kernel_initializer='glorot_uniform')(x)
decoded = Dense(len(creditcard_df_scaled[0]), kernel_initializer='glorot_uniform')(x)
autoencoder = Model(input_df, decoded)
encoder = Model(input_df, encoded)
autoencoder.compile(optimizer = 'adam', loss = 'mean_squared_error')
display(creditcard_df_scaled.shape)
autoencoder.fit(creditcard_df_scaled, creditcard_df_scaled, batch_size= 120, epochs = 25, verbose = 1)
autoencoder.summary()
pred = encoder.predict(creditcard_df_scaled)
display(pred.shape)
score_2 = []
range_values = range(1, 20)
for i in range_values:
kmeans = KMeans(n_clusters = i)
kmeans.fit(pred)
score_2.append(kmeans.inertia_)
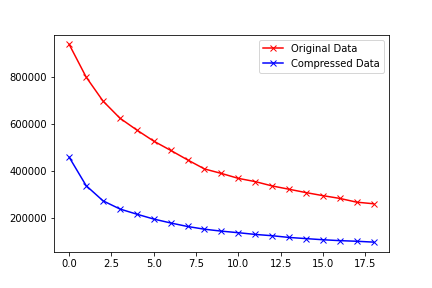
#PLOT WCSS#
plt.plot(score_1, 'bx-', color = 'r', label = 'Original Data')
plt.plot(score_2, 'bx-', color = 'b', label = 'Compressed Data')
plt.legend()
Comparing the WCSS between kmeans vs autoencoder-k-means, it’s clear that WCSS is lower using deep learning compressed data. So wrapping the data with an autoencoder layer provides an alternate way to scale data.
screenshot
Customer Churn Prediction Using Machine Learning Models
Tree-based models perform well for classification; a catboost classifier has been used in this case to build a binary classifier model. Ideally, improving recall(model churn/actual churn) would better retention. As churn data is usually imbalanced, evaluating just based accuracy could lead to wrong marketing strategies.
| Actual | Prediction | Action |
| Churned | Churned | Incentivize |
| Churned | Not Churned | Customer churns – opportunity lost |
| Not Churned | Churned | Loss of capital through incentivization |
| Not Churned | Not Churned | Stay as is |
Code:
X_train, X_test, y_train, y_test = train_test_split(df_fintec_LR, df_fintec[["is_churned"]],random_state = 70, test_size=0.30)
scaler = StandardScaler()
scaler.fit(X_train)
X_train_Scaled = scaler.transform(X_train)
X_test_Scaled = scaler.transform(X_test)
X, y =X_train_Scaled ,y_train
# define model
model = CatBoostClassifier(verbose= False, loss_function='Logloss')
# define evaluation
cv = RepeatedKFold(n_splits=10, n_repeats=3, random_state=1)
# define search space
space = dict()
space['max_depth'] = [3,4,5]
space['n_estimators'] = [100,200,300]
space['learning_rate'] = [0.001,0.002,0.003,0.01]
# define search
search = GridSearchCV(model, space, scoring='accuracy', n_jobs=-1, cv=cv)
# execute search
result = search.fit(X, y)
# summarize result
print('Best Score: %s' % result.best_score_)
print('Best Hyperparameters: %s' % result.best_params_)
file_name = "cat_cls.pkl"
# save
pickle.dump(search, open(file_name, "wb"))
Customer Churn Prediction using Deep Learning Models
Deep learning model
Code:
X = X_train_Scaled
Y = y
encoder = preprocessing.LabelEncoder()
encoder.fit(Y)
encoded_Y = encoder.transform(Y)
# baseline model
model = Sequential()
model.add(Dense(12, input_dim=12, activation='relu'))
model.add(Dense(1, activation='sigmoid'))
# Compile model
model.compile(loss='binary_crossentropy', optimizer='adam', metrics=['accuracy'])
display(model.summary())
history = model.fit(X, encoded_Y, batch_size=50, epochs=10, verbose=1)
y_pred_cb = search.predict(X_test_Scaled)
y_pred_dl = model.predict(X_test_Scaled)
y_pred_dl_f = [1 if x > 0.5 else 0 for lis in list(y_pred_dl) for x in lis  ]
Model Evaluation
Consider a re-engagement email campaign that says something like, “We noticed you might be leaving us. Please don’t!” You’d likely want to ensure that the precision for this email was high. In other words, you would want to minimize the number of happy users who see this email and instead have this email almost exclusively hit users in danger of churning.
On the other hand, consider an email that you want to send more broadly to your user base – it may be an offer to receive Rs50 off the next purchase. You’d be less concerned with users who are not in danger of churning receiving this marketing message. Ideally, though, you would want anyone who might churn to see the email. In this case, you would want your recall to be higher than your precision.
Retention Strategy and Recommendation
Recommendation based on EDA:
| Recommendation | Adoption and Evaluation | |
| Rewards |
|
|
| Strategy |
|
|
| Features |
|
|
| Discoverability |
|
|
Advantages and drawbacks of segmentation techniques used:
| Heuristic |
|
| Statistical Model |
|
Properties of segments based on heuristics:
| Segment 1 | Segment 2 | Segment 3 | Segment 4 |
|
|
|
|
| Segment 5 | Segment 6 | Segment 7 | Segment 8 |
|
|
|
|
Recommendation for segments based on heuristics :
| 1 | 2 | 3 | 4 |
|
|
|
|
| 5 | 6 | 7 | 8 |
|
|
|
|
Readers are encouraged to replicate properties and recommendations for Kmeans clusters as well.
Abbreviations used for Customer Churn
- MAU – monthly active users.
- Users vs Customers – Users and customers can be used interchangeably; typically, a user is anyone who browses through the platform, a customer is someone who transacts.
- GMV – Gross merchandising value.
- NPCI UPI – national payments corporation – unified payment interface
Useful Resources and References
Data science can be broadly divided into business solution-centric and technology-centric divisions. The below resources will immensely help a business solution-centric data science enthusiast expand their knowledge.
- The Complete Guide to Checking Account Churn Prediction in BFSI Domain
- Phonepe pulse report.
- How do I interpret odds ratios in logistic regression?
- NPCI statistics.
-
Paytm IPO Opens: Should you buy or not? Here’s expert advice
-
How PayPal Uses Real-time Graph Database and Graph Analysis to Fight Fraud
-
A Complete Guide To Tableau For Beginners in Data Visualization
-
Tableau – Bill Pay App – churn analysis EDA.
-
Deep Clustering for Financial Market Segmentation.
-
Credit Card Customer Clustering with Autoencoder and K-means.
-
K-means: Why minimizing WCSS is maximizing Distance between clusters?
-
Neural Network: For Binary Classification, use 1 or 2 output neurons?
End Notes on Customer Churn
Churn/Retention/CLV models are the bread and butter of every business out there. Understanding churn can help frame appropriate marketing strategies for long-term retention and revenue growth.
Hope you liked my article on customer churn.
Good luck! Here’s my Linkedin profile if you want to connect with me or want to help improve the article. Feel free to ping me on Topmate/Mentro; you can drop me a message with your query. I’ll be happy to be connected. Check out my other articles on data science and analytics here.
The media shown in this article is not owned by Analytics Vidhya and are used at the Author’s discretion.
Data scientist. Extensively using data mining, data processing algorithms, visualization, statistics, and predictive modeling to solve challenging business problems and generate insights. My responsibilities as a Data Scientist include but are not limited to developing analytical models, data cleaning, explorations, feature engineering, feature selection, modeling, building prototype, documentation of an algorithm, and insights for projects such as pricing analytics for a craft retailer, promotion analytics for a fortune 500 wholesale club, inventory management/demand forecasting for a jewelry retailer and collaborating with on-site teams to deliver highly accurate results on time.


Very Wonderful Post and Analysis.