This article was published as a part of the Data Science Blogathon.
Introduction
In this article, we will build a machine learning pipeline using spark. We will create a Car price predictor using apache spark.
When we want to implement a machine learning model that works on distributed data systems, the spark is the best method in that case.
Earlier, when the spark was not released and we were heavily dependent on the Hadoop ecosystem, we used Apache Mahout for the machine learning-related tasks.
Spark Pipeline works in real-time, and it’s faster due to in-memory computation.
Spark comes with various packages built for specific tasks. For the machine learning tasks, we use the MLlib package ( machine learning library).
![]()
Features of MLlib
Spark provides a separate package to handle all the machine learning tasks. There are some features of MLlib is listed below:
- MLlib provides a similar API to the other machine learning package.
- MLlib supports almost all types of machine learning tasks.
- It also supports computer vision and natural language processing.
- It can be implemented in the near-real-time operations.
Implementing the Machine learning Pipeline in Spark
Implementing machine learning pipeline using Spark’s MLlib package in python.
- Spark Installation
- Data Loading
- Data Cleaning
- Features Vectors
- Model training and testing
- Model evaluation
Installing Spark
Spark Installation can be quickly done using the pip package manager in a Python environment. Setting up the spark on cloud notebooks like google collab, Kaggle notebooks, and data bricks are preferable.
!pip install pyspark
!pip install findspark
import findspark
findspark.init()
Importing Libraries
import pandas as pd
import matplotlib.pyplot as plt
from pyspark import SparkContext, SparkConf
from pyspark.sql import SparkSession
Spark Context and Session
Before moving further, we need to create spark context. It is an entry point to our spark application where we define the configuration and cores for spark.
from pyspark import SparkContext, SparkConf
# Creating a spark context class
sc = SparkSession.builder.master("local[*]").getOrCreate()
local[*]→ It creates a local session with all available cores.getOrCreate→ If the session is not produced, only then create a new session.
Verify by typing the Spark if the context is created or not.
Data Loading
We are loading the US car price dataset freely available on Kaggle. You can create a notebook associated with the dataset or download the dataset.
data = sc.read.csv('../input/cars-data/data.csv', inferSchema = True, header = True)
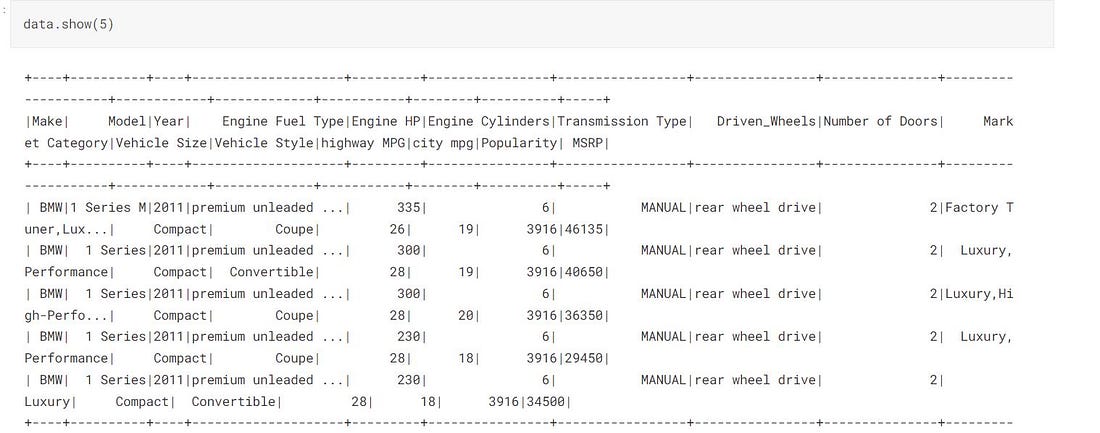
data.show(5)
data.printSchema()
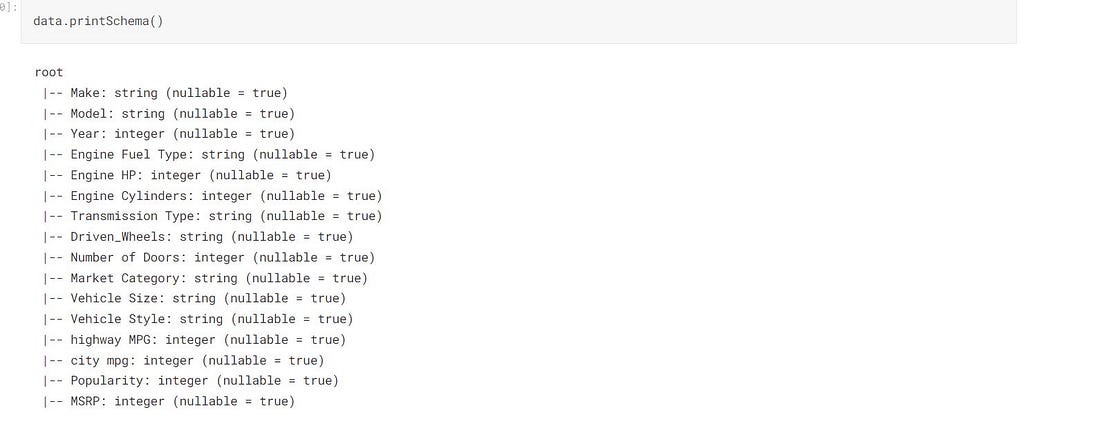
printSchema() It prints all the columns with their data types reasonably, saying the dataset’s schema.
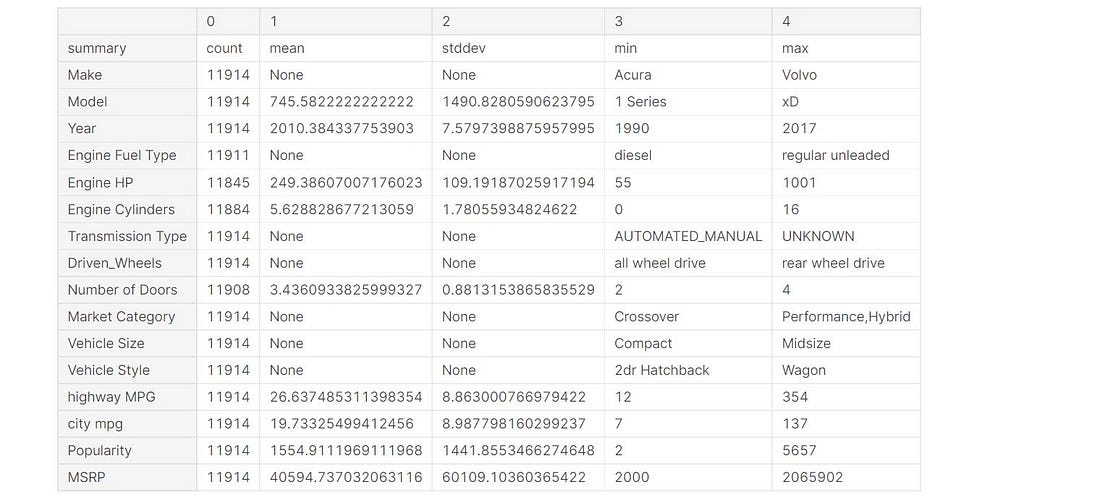
Statistical Analysis of the Dataset
data.describe().toPandas().transpose()
Data Cleaning
In this step, we remove all the redundant information from our dataset. In this case, the dataset contains some NA values, and our goal is to drop the nan values.
def replace(column, value):
    return when(column!=value,column).otherwise(lit(None))
The function replaces a column and values and returns the matching values with what we pass with NONE.
data = data.withColumn("Market Category", replace(col("Market Category"),"N/A"))
Count all the null values
from pyspark.sql.functions import when,lit,count,isnan,col
data.select([count(when(isnan(c)|col(c).isNull(),c)).alias(c) for c in data.columns]).show()
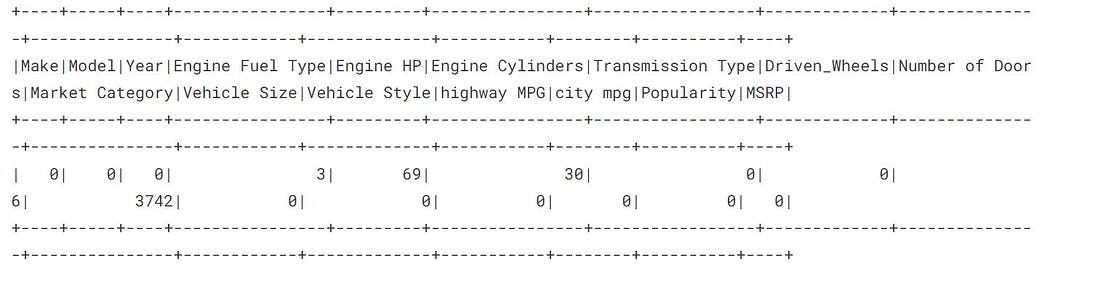
The Market Category column has a maximum of 3742 null values, which means we can drop this column.
Drop the NaN values
#deleting the column Market Category
data = data.drop("Market Category")
# deleting the all null values
data = data.na.drop()
We have cleaned the data and are ready to build the machine learning model at this stage.
print((data.count(), len(data.columns)))

Feature Vectors in Spark
Spark MLlib supports our dataset in the form of feature vectors to process it.
We need to convert our regular columnar dataset into feature vectors for fast and better convergence.
We reverse the data frame columns into feature vector series using the Class Vector Assembler.
We need to pass “Year”,”Engine HP”,these columns as input features for our model training.
“Number of Doors”,”Engine Cylinders”,”highway MPG”,”city mpg”,”Popularity”
The vector assembler will assemble all these columns’ of information into a single series that will be passed forward to our model for the activity.
from pyspark.ml.feature import VectorAssembler
assembler = VectorAssembler(inputCols = ["Engine HP","Engine Cylinders",
            "Year","highway MPG","Number of Doors","city mpg","Popularity"],
                           outputCol = "Input Attributes")
outputCol: It is the column name for the output features.
We are not calling the Vector Assembler on our data since we are creating a pipeline. We only need to pass our function; the Pipeline will transform our data on demand.
Building the Model and Pipeline
Spark comes with many inbuilt machine learning models, and we only need to import it and train it according to our data.
- We will be using RandomForestRegressor for our model, and later we will teach using cross-validation.
from pyspark.ml.regression import RandomForestRegressor
regressor_model = RandomForestRegressor(featuresCol = 'Input_Attributes_name', labelCol = "MSRP")
RandomForestRegressor : It inputs the combination of all the features and labelCol the output feature for the training.
Pipeline
A pipeline combines multiple steps and transformation in a single step with a sequence, and it calls then on demand. In the channel, we need to list down our sequence, and the data will enter from the left end and by going through every processing, it comes out at the other end.
After building a pipeline, we can save our Pipeline on disk and load it anytime.
from pyspark.ml import Pipeline
pipeline  = Pipeline(stages = [assembler,regressor])
#--Saving the Pipeline
pipeline.write().overwrite().save("pipeline_save_model")
Loading the Pipeline
pipelineModel = Pipeline.load('./pipeline_save_model')
The cross-validation and Model Tuning
pyspark.ml.tuning class provides all the functions used for model tuning.
Before doing that, we need to define a hyperparameter grid used for hyperparameter tuning during cross-validation.
from pyspark.ml.tuning import ParamGridBuilder
paramGrid = ParamGridBuilder()
.addGrid(regressor.numTrees,[100,500])
.build()
Cross-Validation
Here the parameter k from Keras is replaced by numFolder. We are using numFolder = 3 means 66% of the data will be used for training, and the remaining will be used for testing.
from pyspark.ml.tuning import CrossValidator
crossval = CrossValidator(estimator = pipelineModel,
                         estimatorParamMaps = paramGrid,
                         evaluator = RegressionEvaluator(labelCol = "MSRP"),
                         numFolds = 3)
So far, we have created a cross-validator built with a training pipeline. Now it’s time to fit/train our channel.
Splitting the data
Splitting our data into training and testing parts by 80% for model training, and the rest 20% will be used for the validation.
train_data,test_data = data.randomSplit([0.8,0.2], seed = 133)
Training the model with data
The training process might take a bit of time, depending on the core spark used by the machine.
cvModel = crossval.fit(train_data)
Best Fit Model
bestModel : This function gives the best-fitted model after parameter tuning.
bestModel = cvModel.bestModel
print(bestModel.stages)

The best fit model we have got is having numFeatures = 7 and numTree = 500 .
Inference Phase
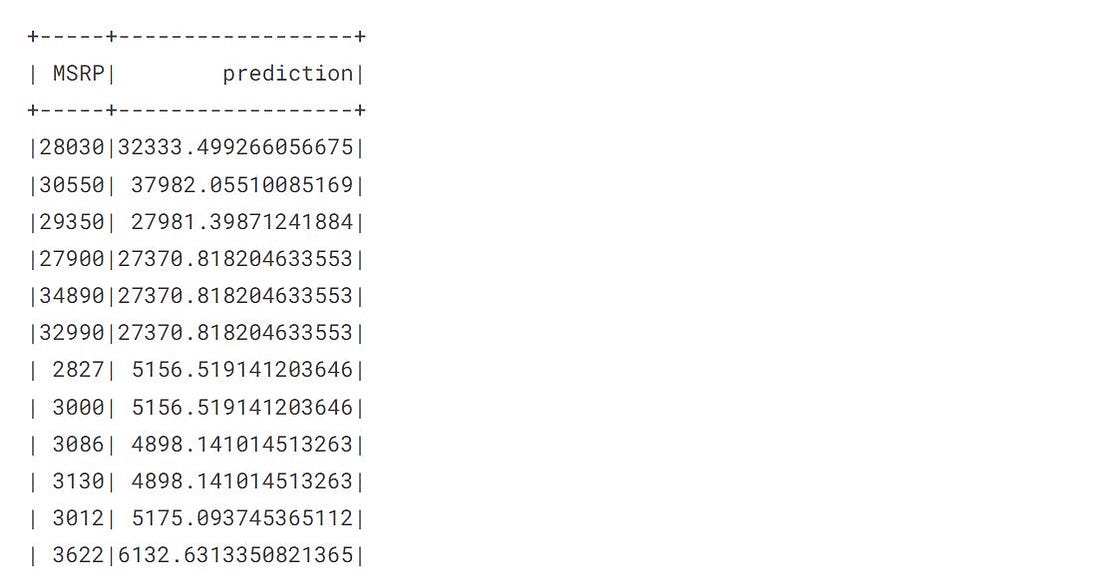
The method transform() is used for the prediction.
prediction = cvModel.transform(test_data)
The transform method automatically creates a prediction column containing all the predictions.
Evaluation Metrics
Spark provides an Evaluator class to evaluate our model Performance, and it offers separate evaluators for the regression and classification tasks.
from pyspark.ml.evaluation import RegressionEvaluatorrmse = eval.evaluate(pred, {eval.metricName:'rmse'})
eval = RegressionEvaluator(labelCol = 'MSRP')
mae = eval.evaluate(pred, {eval.metricName:"mae"})
r2 =eval.evaluate(pred,{eval.metricName:'r2'})
Printing the metrics
Let’s see the model performance
print("RMSE: %.3f" %rmse)
print("R2: %.3f" %r2)
print("MAE: %.3f" %mae)

R2: A higher R2 Score means a better-trained model. It tells the proportion of variance that the model can explain.
RMSE: It is the Squared mean error between the actual and predicted values.
Conclusion
This article talked about the Spark MLlib package and learned the various steps involved in building a machine learning pipeline in Python using Spark.
- We built A car price predictor using the Spark MLlib pipeline.
- We discussed Cross validator and Model tuning.
- Spark also provides evaluator metrics.
- Spark MLlib supports our data in Vectors, which is done by using Vector Assembler.
- External packages can be easily installed and integrated into the MLlib package.
Spark ML-lib pipeline can be worked best in real-time data streaming, where it gives the prediction in real-time.
The media shown in this article is not owned by Analytics Vidhya and is used at the Author’s discretion.


