This article was published as a part of the Data Science Blogathon.

Introduction
This problem that we will discuss in this blog comes from the cutting-edge intersection of AI with the drug discovery process, where DataRobot and my team play a very significant role. This blog is focused on an engagement my team, and I did with one of our largest customers, a top-tier pharmaceutical company in the United States. The goal with this type of work my team and I do is to tackle problems that are not standardized, which allows us to learn from them and then cross-functionally work with our Product and Engineering teams to integrate them into the DataRobot Platform, which pushes the boundaries of innovation in AI. In this blog, I consider an example and look into some work I have done in this field where I marry classical approaches in Survival Analysis with modern-day machine learning techniques to improve explainability, improve the accuracy of predicting adverse health events in patients and decrease time to release of the drug in the market.
Drug Discovery Process
Studies examining how patients respond to a particular drug throughout treatment are of the utmost importance for understanding how treatments affect the progression of the disease and the quality of life. These studies might go on for a few weeks, a few months, or even a few years and usually are the longest, most expensive part of any drug discovery process. The double-blind, placebo-controlled study is the best and most reliable way to conduct these studies. As the name suggests, this study selects two groups of patients and administers a placebo to one group versus the drug in the discovery process.
Throughout the study, measurements are made regularly, followed by a risk assessment analysis. In this analysis of risks, we are typically interested in understanding how a person’s risk factor (age, weight, ethnicity, gender, past health conditions etc.) affects the outcome of interest, which would usually be these: time to disease occurrence/recurrence or progression-free survival.
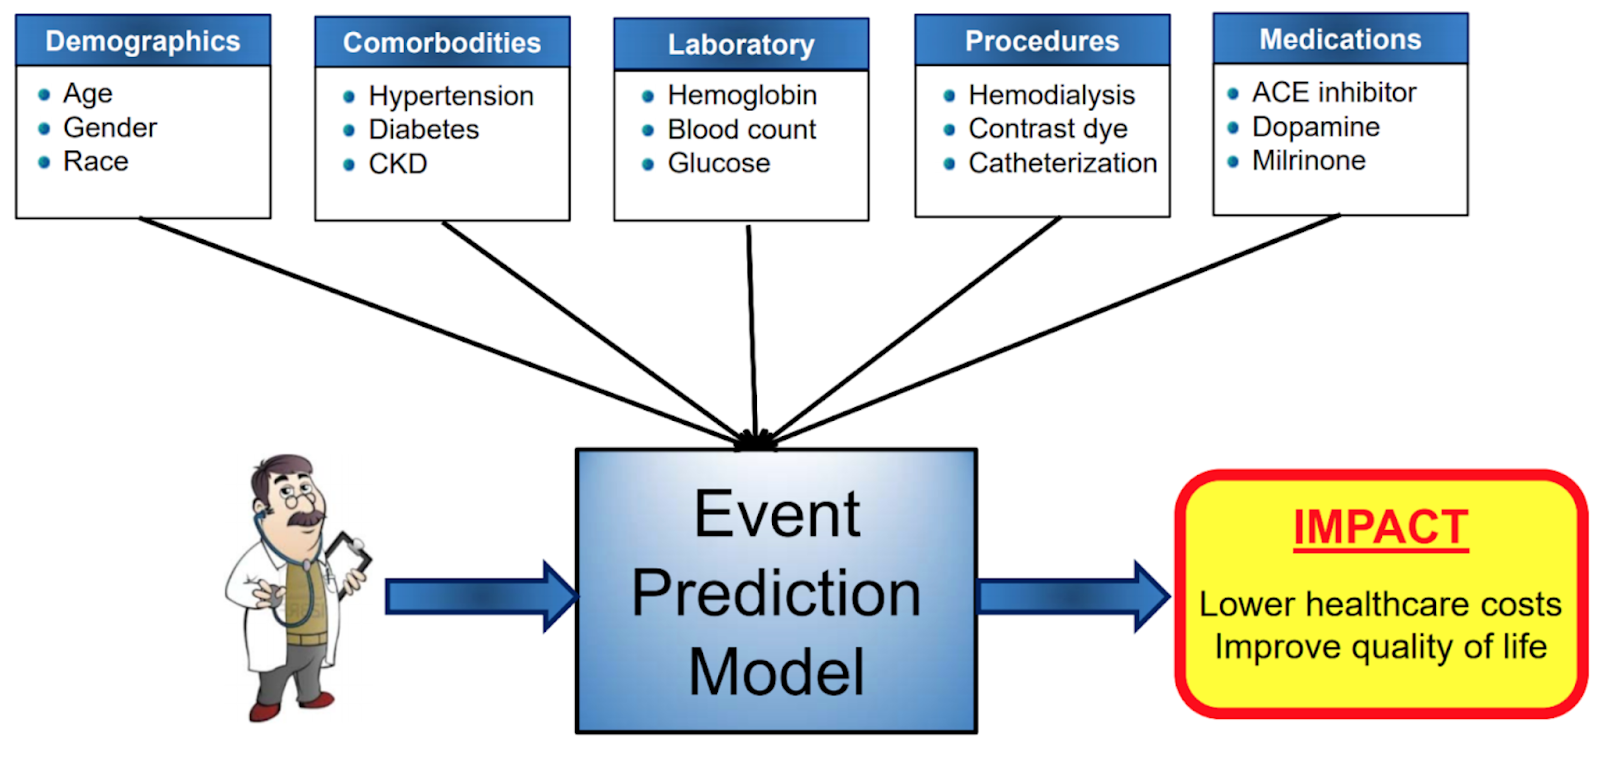
Figure 1: Overview of Risk Assessment Studies
Survival Analysis: Risk Assessment of Patients in a Trial
Survival Analysis is the set of methods used to make such risk assessments in a clinical trial. It corresponds to a set of statistical methods for investigating the time it takes for an event of interest, e.g. How many months will a patient survive after a set of treatments? While this blog discusses drug discovery, survival analysis can be used in any setting where we are interested in predicting “time to an event”. For example, we can also use it to estimate things like How long a customer will stay with a telco provider, How long it will take for a person to default on their loan, how long it will take for a manufactured product to fail, estimate when a web user will click the link of an ad and so on. One of the primary issues in this setting is the occurrence of instances whose event outcomes become unobservable at a specific time point or instances that do not experience any events during the monitoring period. Using survival analysis approaches, this so-called Censoring may be dealt with most efficiently.
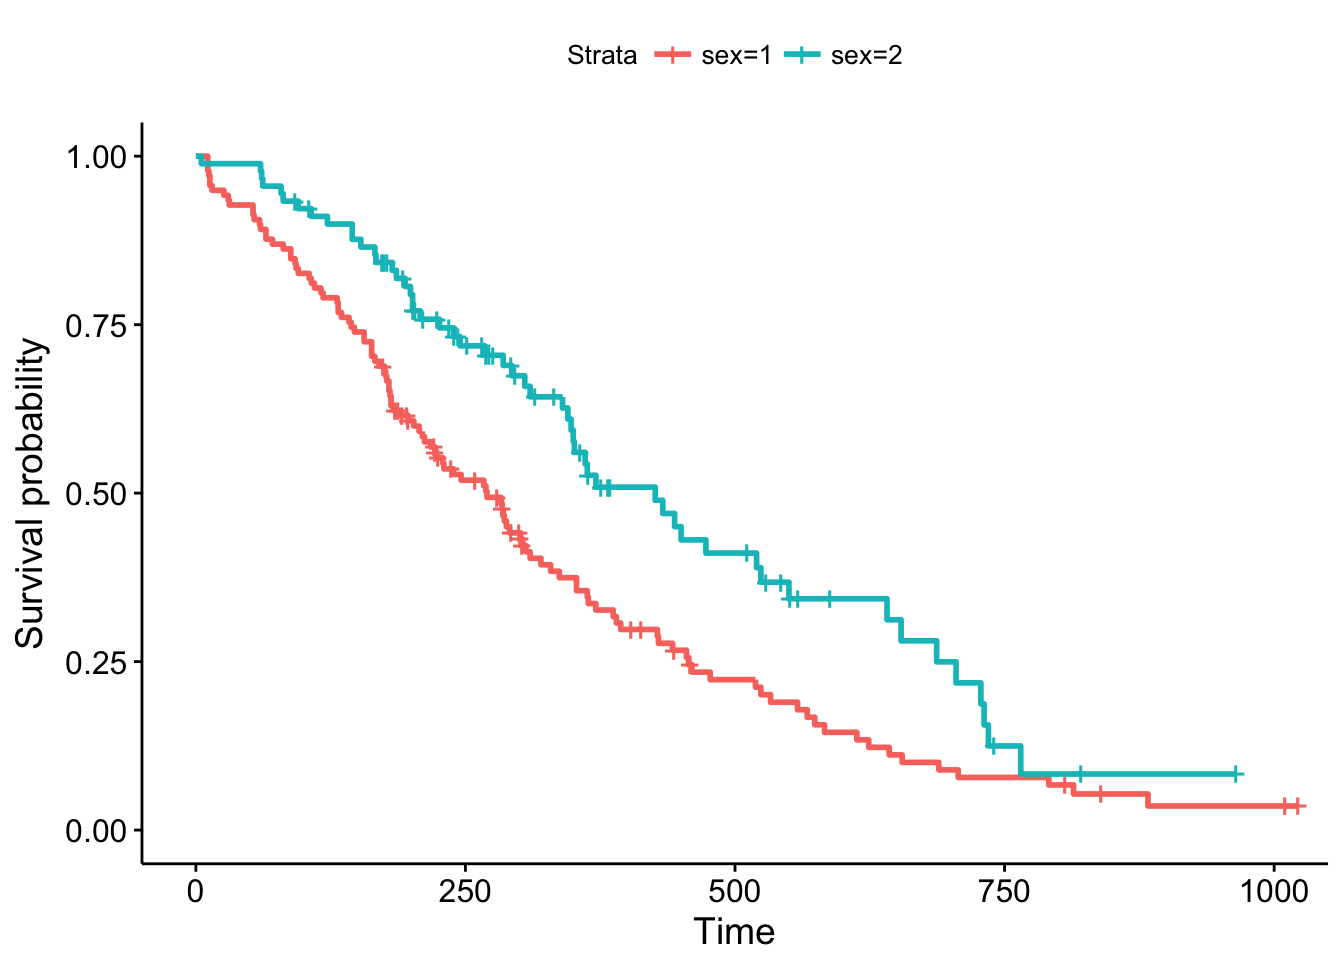
Figure 2: A Survival curve
Survival Analysis via Machine Learning: Benefits
The Cox Proportional Hazards Model (and its allied variants) is one of the most commonly used models in Survival Analysis. The event probability at any given time is expressed as a function of the linear combination of the features (covariates). The Cox Proportional Hazards Model has several limitations. A simple linear model cannot capture complex patterns within each feature and interactions between features. Its Proportional Hazards Assumption is easily violated in the real world. For example, in a clinical study, if males are 10% riskier than females, the model assumes that this 10% stays constant across the study time. Such assumptions are unrealistic as the impact of gender may have varying effects on the overall risk score over time.
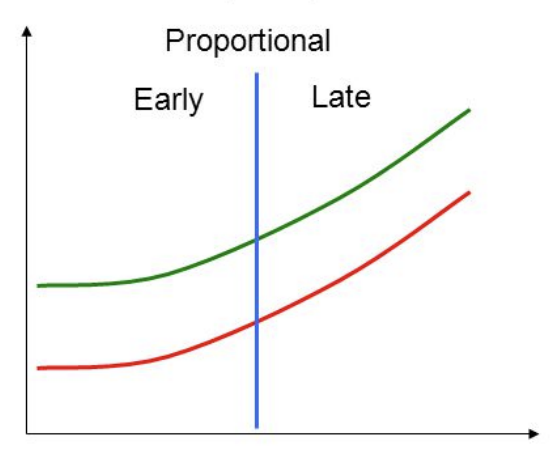
Figure 3: Assumption of Proportional Hazards
Framing the Problem as Binary Classification
Due to its ‘event occurs or not’ nature, survival problems can be framed as binary classification problems and tackled by machine learning algorithms. Machine learning algorithms can identify complex patterns and interactions between features (covariates) without being constrained by the Proportional Hazards Assumption of the Cox model described above. The original data at the ‘patient’ level can be transformed to the ‘patient-time’ level by tracking each patient at discrete time intervals (3 months in the following example):

Figure 4: Transforming the dataset to set up as a machine learning problem
Our target variable, in this case, is Overall Survival which takes the value of zero or one in any given week for a patient depending on whether the patient is censored or an adverse event has happened. Input features contain time-varying and time-invariant covariates.
We predict the below:
Probability (Patient survives next month | Patient survived previous month)
The probability of surviving up to time T then is the product of
Probability (Patient survives month t | Patient survives month t-1) for t=1 to T.
i.e. you make T predictions from your model and then multiply them together.
A key concept to remember here is that of group partitioning, i.e. Cross Validation by grouping over patients keeping all the rows corresponding to one patient in the same cross-validation fold.

Figure 5: Cross Validation. In the Survival Analysis setting, we do a group-partitioning
Atezolizumab Clinical Trial: An example case study
Gennetech wrote a paper in 2018 published in Nature based on their drug trial for Atezolizumab, which prolongs survival in extensive stage small cell lung cancer treatment.
-
Reference Paper: “TGF-β attenuates tumor response to PD-L1 blockade by contributing to exclusion of T cells”
-
Link: https://www.ncbi.nlm.nih.gov/pmc/articles/PMC6028240/
My team and I created an alternative workflow to conventional survival analysis models like Cox Proportional and its family of models, which unfortunately is still widely used within the Biostatistics community even though the disadvantages of the models are well known.
Biological Context: PD-1 is a type I membrane protein expressed on the surface of many white blood cells such as activated T cells, B cells, and macrophages, suggesting that PD-1 more broadly negatively regulates immune responses. PD-L1, the ligand for PD-1, is highly expressed in several cancers, and the role of PD-1 in cancer immune evasion is well established. Therapeutic antibodies that block the programmed death-ligand 1 (PD-L1)/programmed death-1 (PD-1) pathway can induce robust and durable responses in patients with various cancers, including metastatic urothelial cancer (mUC). However, these responses only occur in a subset of patients. Identifying the determinants of response and resistance is key to improving outcomes and developing new treatment strategies. Here, we examined tumors from a large cohort of mUC patients treated with an anti–PD-L1 agent (atezolizumab) and identified major determinants of clinical outcome.
Computational Complexity: The problem is on survival analysis as described above with the outcome measures as overall survival and progression-free survival. The complexity comes from the fact that we have 40,000 features (32,000 of them being genomic features) across multicenter, double-blind, placebo-controlled trials in 403 patients. Basically, you have ~ 400 observations but 40,000 features. Few observations and lots of features or what we call in machine learning as p>>n problem.
-
Issue 1: Feature Selection, especially when the goal is not accuracy but identification of rare genomic variants associated with the mortality rate (or other events) observed.
-
Issue 2: Handle the extreme multicollinearity between the different genetic expression-based features
-
Issue 3: Estimate survival probabilities, both overall and progression-free, especially given that proportional hazards like assumptions will be highly erroneous to make
The above issues make it clear that traditional approaches like Cox Proportional models can’t handle these complexities, which can readily be handled via machine learning. To understand the outputs from these models, please see these out-of-sample predictions for one of the patients in the trial and notice that the probability of survival varies non-linearly over time, is readily captured by machine learning models and is essential for making judgements about appropriate interventions.
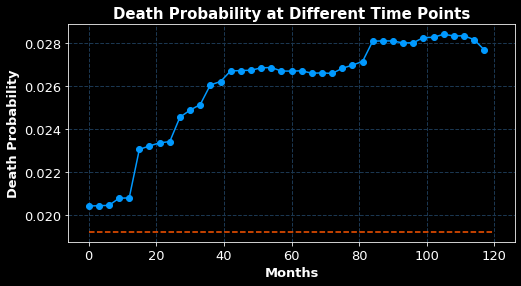
Figure 6: Out-of-sample death probability for one of the patients in the trial varies non-linearly
Conclusion
Machine Learning approaches help bridge the gaps left by traditional survival analysis models. In this blog, we discussed how such a method can be applied for making risk assessments, pitfalls of the classical survival analysis approach, and an example of a drug discovered for Urethral Cancer that further illustrates the benefits of combining machine learning approaches with survival analysis problems.
I hope you liked my article on drug discovery and its association with artificial intelligence. My team and I work with several leading pharmaceutical companies in the United States, where our goal is to decrease the time taken for these drug discoveries. In line with the above example for Urethral Cancer, we built several workflows and now cover 32 cancer types. We have found success using machine learning models for making sound risk assessments for patients in clinical trials. I hope this blog will benefit other researchers working on similar problems.
The media shown in this article is not owned by Analytics Vidhya and is used at the Author’s discretion.


