This article was published as a part of the Data Science Blogathon.
Introduction
Cancer is a significant burden on our healthcare system which is estimated to account for over 9 million deaths globally. Cancer is the leading cause of death globally according to WHO.
An accurate diagnosis is a challenging task for physicians. To provide appropriate treatment, an automatic prediction system is required which will diagnose the patient. Thus, specialized technology and expertise prove essential to fight this problem.
Challenges Identified
Continuous research on cancer has been performed over the past decades. However, the accurate prediction of cancer is one of the most challenging tasks for physicians. Early diagnosis will increase the chances of survival of the patient.
The key challenge is how to classify cancer tumors as malignant or benign. Thus, Machine learning has become a popular tool for medical researchers.
Problem Definition
The objective of this system is to address the challenges and issues in the existing system by designing a system that detects whether the patient is diagnosed with Cancer or not using Machine Learning.
Information about the dataset
The dataset is from Wisconsin Breast Cancer Diagnostics (WBCD) obtained from UCI Repository. The data consists of 32 characteristics like Radius, Compactness, Texture, Perimeter, etc. of tumor for 569 patients.
Workflow of the system
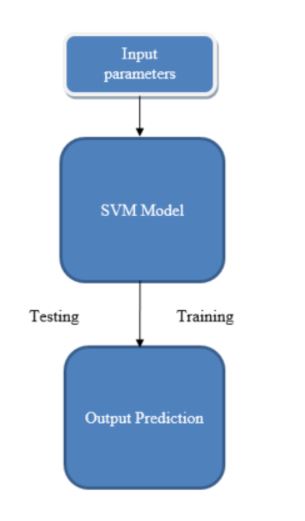
Input to this system will be the characteristics of the tumor-like radius, perimeter, compactness, etc. The data is visualized and analyzed using a pair plot, count plot, Heat map. A classification algorithm like SVM is used to classify the tumor as malignant and benign. Finally, performance evaluation parameters like precision, recall, accuracy are used to evaluate the model.
Implementation
Loading Modules
All the necessary python libraries like seaborn, NumPy, matplotlib. pyplot, pandas are imported as follows:
import pandas as pd
import numpy as np
import matplotlib.pyplot as plt
import seaborn as sns
Loading Dataset
Load the training dataset as follows:
train = pd.read_csv('load_breast_cancer.csv')
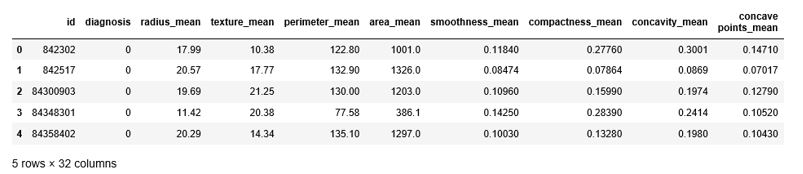
Looking into the training dataset
Print first 5 rows of the training dataset using the head() method
train.head()
Output:
Total rows and columns
We can see that there are 569 rows and 32 columns in our training dataset using the shape() method. The class distribution is 212 malignant and 357 benign
Describing training dataset
describe() method shows values like mean, count, standard deviation, etc. describe(include = [‘O’]) will show the descriptive statistics of the object data types. We created a pandas dataframe.
We can use the info() method to see more details of our dataset as follows:
df_cancer = pd.DataFrame(cancer['data'],columns=cancer['feature_names'])
df_cancer.info()
Encoding categorical data
Encoding categorical data to numerical data like encode M to 0 and B to 1 in the target column.
Data Visualization
Data visualization is the graphical representation of data to understand patterns, trends, and outliers in the data.
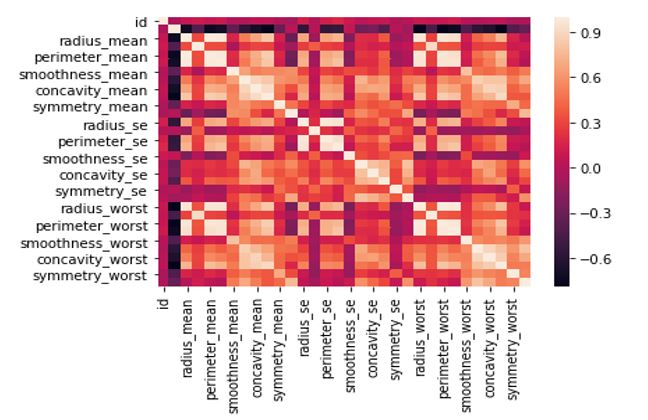
Heat Map
The visualization of the correlation of the columns is easier using Heat Map. The heat map of our dataset is as follows:
sns.heatmap(df_cancer.corr(), annot=True)
Output:
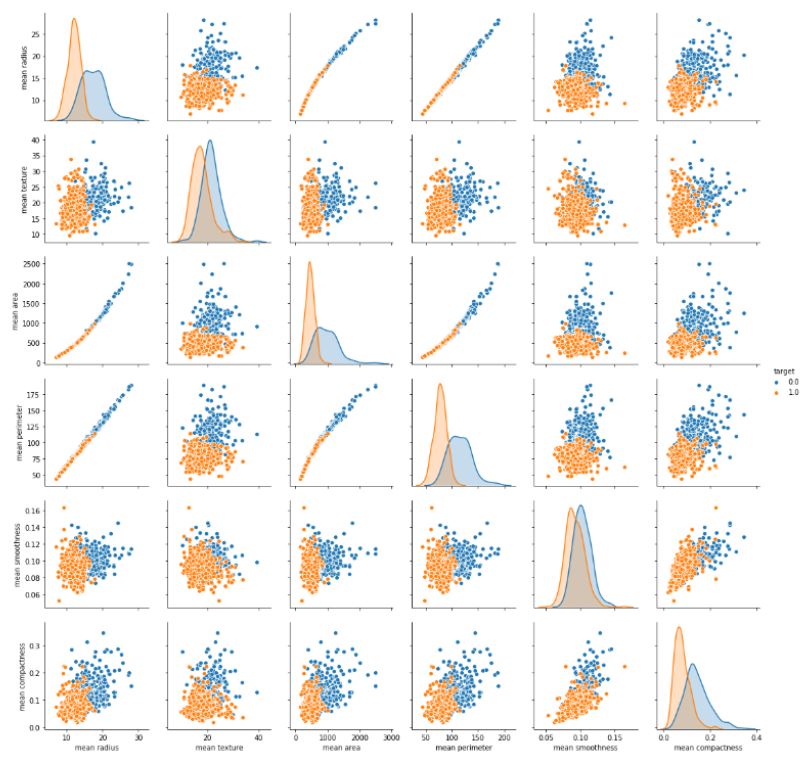
Pair plot
The pair plot shows the data as a collection of points. It helps to analyze the relationship between each and every variable. The pair plot of our dataset is as follows:
sns.pairplot(df_cancer, hue = 'target', vars = ['mean radius', 'mean texture', 'mean area', 'mean perimeter', 'mean smoothness', 'mean compactness'])
Output:
Count plot
It will represent the class distribution of malignant and benign patients. The class distribution is 212 malignant and 357 benign.
Split the dataset
We split the dataset into 70% training set and 30% testing set as follows:
from sklearn.model_selection import train_test_split
X_train, X_test, y_train, y_test = train_test_split(df_cancer, np.ravel(df_target), test_size=0.30, random_state=101)
Create model
We will be using SVM(Support Vector Machine) which is a machine learning classification algorithm. It is a supervised learning algorithm that analyzes data for classification. In this algorithm, we plot each data item like a point in n-dimensional space with the value of each feature as the value of a coordinate and perform classification, this is by finding the hyperplane which will differentiate the two classes. SVM is available in the scikit-learn library of python.
from sklearn.svm import SVC
model = SVC()
model.fit(X_train,y_train)
predictions = model.predict(X_test)
The structure for using it is – Import the necessary libraries, creation of an object, model fitting, and prediction
Now we check the confusion matrix and classification report
from sklearn.metrics import classification_report,confusion_matrix
print(confusion_matrix(y_test,predictions))
print(classification_report(y_test,predictions))
Here recall and precision for class 0 is 0 which means that the classifier is classifying everything into a single class. So our model needs to have its parameters tuned using GridSearchCV. It helps to loop through predefined hyperparameters and fit our model on our training set.
param_grid = {'C': [0.1,1, 10, 100, 1000], 'gamma': [1,0.1,0.01,0.001,0.0001], 'kernel': ['rbf']}
from sklearn.model_selection import GridSearchCV
grid = GridSearchCV(SVC(),param_grid,refit=True,verbose=3)
grid.fit(X_train,y_train)
grid_predictions = grid.predict(X_test)
Now check the performance of the system
print(confusion_matrix(y_test,grid_predictions))
print(classification_report(y_test,grid_predictions))
Output:
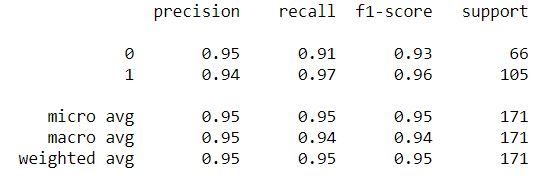
Thus we get an optimized system with 95% precision for class 0 and 94% precision for class 1.
User Interface Design
Used Tkinter which is a standard GUI package in python. It provides users with an easy and simple way to create GUI elements using the widgets found in the Tk toolkit.
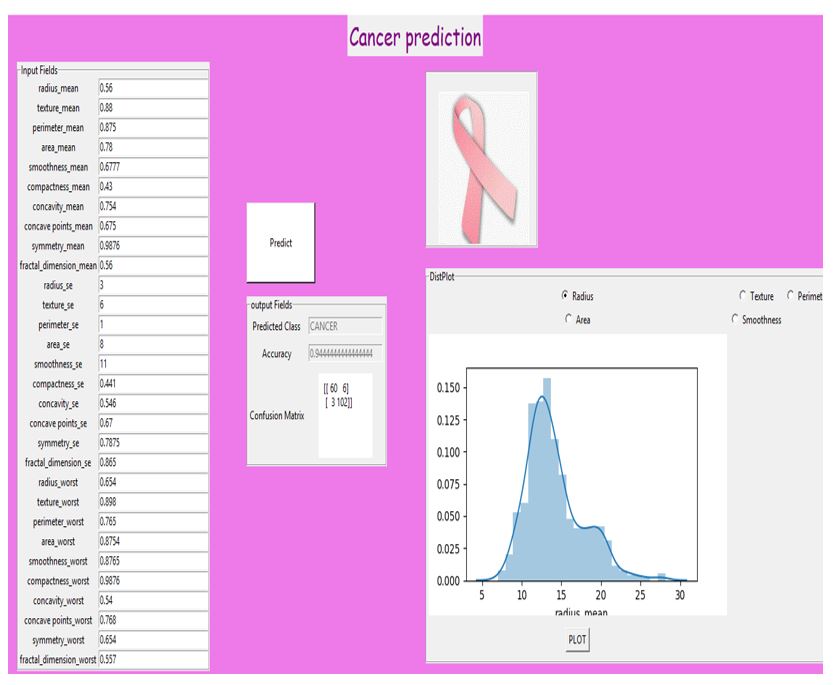
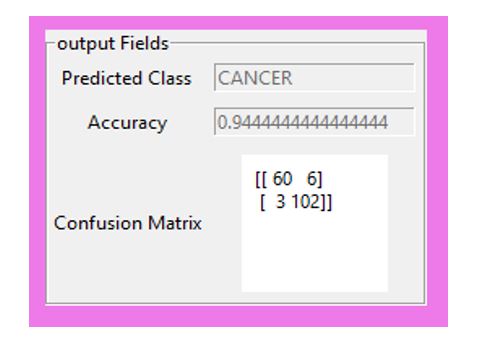
Confusion matrix with predicted class and accuracy of the system:
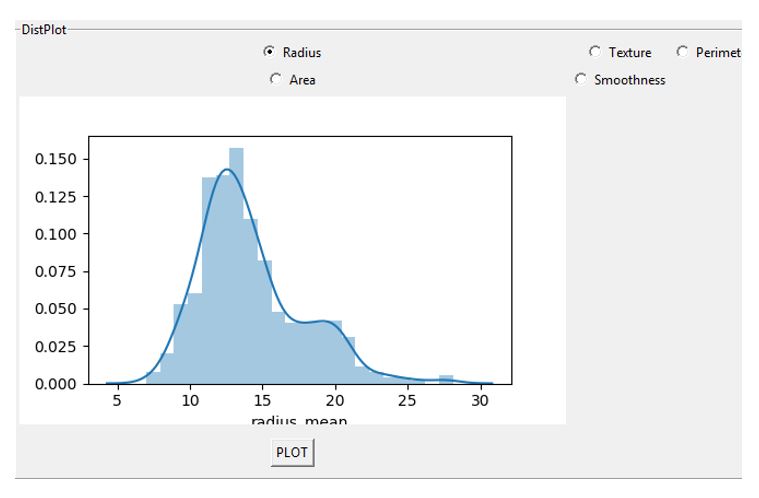
Distribution plot:
Results
SVM algorithm is used in this project for classification and prediction of cancer using the WBCD dataset. 30% of entries of the whole dataset were used for testing and validation.
SVM Hyperparameter tuning with GridSearchCV gave better results as it finds the best parameter combination and optimizes our model.
The system has an accuracy of 94%. So we used SVM Hyperparameter tuning with GridSearchCV for developing an application in Tkinter which predicts whether a patient is diagnosed with cancer or not.
Conclusion
The advancements in the medical field as well as in machine learning are happening very fast in today’s world. ML is an interesting area in biomedical research with many applications.
So it is obvious that if both Medical Science and Machine learning work together towards a shared goal it will only be faster and easier to tackle health issues.
We employed the concept of SVM, which mainly focuses on the supervised learning method. It is a very powerful Machine Learning model which is capable of performing classification, regression and even outlier detection, and well suited for the classification of complex but small or medium-sized datasets.
References
[1] Shilpi Shandilya, ChaitaliChandankhede, “Survey on recent cancer classification systems for cancer diagnosis”, 2017 International Conference on Wireless Communications, Signal Processing and Networking (WiSPNET). [2] Md. Milon Islam, Hasib Iqbal, Md. RezwanulHaque, Md. Kamrul Hasan, “Prediction of breast cancer using support vector machine and K-Nearest neighbours”, 2017 IEEE Region 10 Humanitarian Technology Conference (R10-HTC). [3] Uma Ojha, Savita Goel, “A study on prediction of breast cancer recurrence using data mining techniques”, 2017 7th International Conference on Cloud Computing, Data Science & Engineering – Confluence.You can also find and connect with me on Github and LinkedIn.
The media shown in this article are not owned by Analytics Vidhya and is used at the Author’s discretion.
I am Shruti Sureshan. I have completed MTech CSE from IIT Jodhpur. I received my B.E. Degree in Computer Engineering from University of Mumbai. My research interests include Machine Learning and Deep Learning.


