Introduction
I’m a big fan of R – it’s no secret. I have relied on it since my days of learning statistics back in university. In fact, R is still my go-to language for machine learning projects.
Three things primarily attracted me to R:
- The easy-to-understand and use syntax
- The incredible RStudio tool
- R packages!
R offers a plethora of packages for performing machine learning tasks, including ‘dplyr’ for data manipulation, ‘ggplot2’ for data visualization, ‘caret’ for building ML models, etc.

There are even R packages for specific functions, including credit risk scoring, scraping data from websites, econometrics, etc. There’s a reason why R is beloved among statisticians worldwide – the sheer amount of R packages available makes life so much easier.
In this article, I will showcase eight R packages that have gone under the radar among data scientists but are incredibly useful for performing specific machine learning tasks. To get you started, I have included an example along with the code for each package.
Trust me, your love for R is about to undergo another revolution!
The R Packages We’ll Cover in this Article
I have broadly divided these R packages into three categories:
- Data Visualization
- DataExplorer
- esquisse
- Machine Learning
- MLR
- parsnip
- Ranger
- purrr
- Other Miscellaneous R Packages
- rtweet
- Reticulate
- Bonus: More R Packages!
- InstallR
- GitHubInstall
Data Visualization

R is an amazing tool for visualizing data. The ease with which we can generate all kinds of plots with just one or two lines of code? Truly a time saver.
R provides seemingly countless ways to visualize your data. Even when I’m using Python for a certain task, I come back to R for exploring and visualizing my data. I’m sure most R users feel the same way!
Let’s look at a few awesome but lesser-known R packages for performing exploratory data analysis.
DataExplorer
This is my go-to package for performing exploratory data analysis. From plotting the structure of the data to Q-Q plots and even creating reports for your dataset, this package does it all.
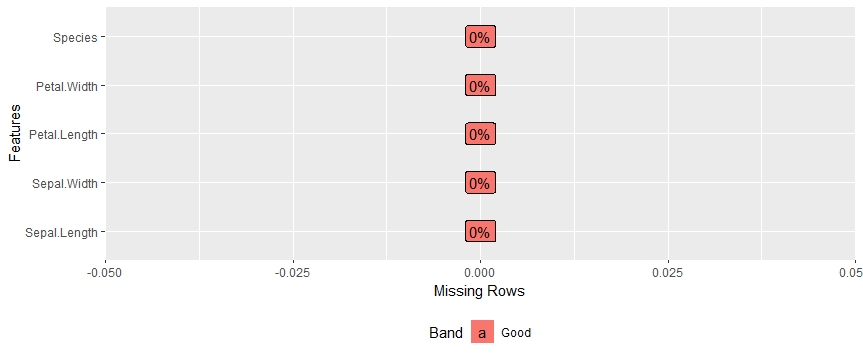
Let’s see what DataExplorer can do using an example. Consider that we have stored our data in the data variable. Now, we want to figure out the percentage of missing values in every feature present. This is extremely useful when we’re working with massive datasets and computing the sum of missing values might be time-consuming.
You can install DataExplorer using the below code:
install.packages("DataExplorer")
Now let’s see what DataExplorer can do for us:
library(DataExplorer)
data(iris)
plot_missing(iris)
We get a really intuitive plot for missing values:
One of my favorite aspects of DataExplorer is the comprehensive report we can generate using just one line of code:
create_report(iris)
Below are the different kinds of factors we get in this report:

You can access the full report through this link. A VERY useful package.
esquisse
How about a ‘drag-and-drop’ add-in for generating plots in R? That’s right – esquisse is a package that lets you get on with creating plots without having to code them.
![]()
Esquisse is built on top of the ggplot2 package. That means you can interactively explore your data in the esquisse environment by generating ggplot2 graphs.
Use the below code to install and load up esquisse on your machine:
# From CRAN
install.packages("esquisse")

#Load the package in R
library(esquisse)

esquisse::esquisser() #helps in launching the add-in
You can also launch the esquisse add-in via the RStudio menu. The user interface of esquisse looks like this:
Pretty cool, right? Go ahead and play around with different types of plots – it’s an eye-opening experience.
Machine Learning

Ah, building machine learning models in R. The holy grail we data scientists strive for when we take up new machine learning projects. You might have used the ‘caret’ package for building models before.
Now, let me introduce you to a few under-the-radar R packages that might change the way you approach the model building process.
MLR – Machine Learning in R
One of the biggest reasons Python surged ahead of R was thanks to its machine learning focused libraries (like scikit-learn). For a long time, R lacked this ability. Sure you could use different packages for performing different ML tasks but there was no one package that could do it all. We had to call three different libraries for building three different models.
Not ideal.
And then the MLR package came along. It is an incredible package which allows us to perform all sorts of machine learning tasks. MLR includes all the popular machine learning algorithms we use in our projects.
![]()
I strongly recommend going through the below article to deep dive into MLR:
Let’s see how to install MLR and build a random forest model on the iris dataset:
install.packages("mlr")
library(mlr)

# Load the dataset
data(iris)
# create task
task = makeClassifTask(id = ”iris”, iris, target = ”Species”)

# create learner
learner = makeLearner(”classif.randomForest”)

# build model and evaluate
holdout(learner, task)

# measure accuracy
holdout(learner, task, measures = acc)
Output:
Resample Result
Task: iris
Learner: classif.randomForest
Aggr perf: acc.test.mean=0.9200000          # 92% accuracy - not bad!
Runtime: 0.0239332
parsnip
A common issue with different functions available in R (that do the same thing) is that they can have different interfaces and arguments. Take the random forest algorithm for example. The code you would use in the randomforest package and the caret package are different, right?
Like MLR, parsnip removes the problem of referring to multiple packages for a certain machine learning algorithm. It successfully imitates Python’s scikit-learn package in R.
Let’s look at the below simple example to give you an insight into how parsnip works for a linear regression problem:
install.packages("parsnip")
library(parsnip)

#Load the dataset
data(mtcars)

#Build a linear regression model
fit <- linear_reg("regression") %>%
set_engine("lm") %>%
fit(mpg~.,data=mtcars)
fit #extracts the coefficient values
Output:
parsnip model object
Call:
stats::lm(formula = formula, data = data)

Coefficients:
(Intercept)          cyl         disp           hp         drat           wt         qsec
   12.30337     -0.11144      0.01334     -0.02148      0.78711     -3.71530      0.82104
         vs           am         gear         carb
    0.31776      2.52023      0.65541     -0.19942
Ranger
Ranger is one of my favorite R packages. I regularly use random forests to build baseline models – especially when I’m participating in data science hackathons.
Here’s a question – how many times have you encountered slow random forest computation for huge datasets in R? It happens way too often on my old machine.
Packages like caret, random forests and rf take a lot of time to compute the results. The ‘Ranger’ package accelerates our model building process for the random forest algorithm. It helps you swiftly create a large number of trees in less amount of time.
Let’s code a random forest model using Ranger:
install.packages("ranger")

#Load the Ranger package
require(ranger)

#Load the dataset
data(iris)
## Classification forest
ranger(Species ~ ., data = iris,num.trees=100,mtry=3)

## Prediction
train.idx <- sample(nrow(iris), 2/3 * nrow(iris))
iris.train <- iris[train.idx, ]
iris.test <- iris[-train.idx, ]
rg.iris <- ranger(Species ~ ., data = iris.train)
pred.iris <- predict(rg.iris, data = iris.test)

#Build a confusion matrix
table(iris.test$Species, pred.iris$predictions)
Output:
             setosa versicolor virginica
  setosa         16          0         0
  versicolor      0         16         2
  virginica       0          0        16
Quite an impressive performance. You should try out Ranger on more complex datasets and see how much faster your computations become.
purrr
Exhausted while running your linear regression model on different parts of data and computing the evaluation metrics for each model? The purrr package comes to your rescue.
You can also build generalized linear models (glm) for different data pieces and compute p-values for every feature in the form of a list. The advantages of purrr are endless!
Let’s see an example to understand its functionality. We will build a linear regression model here and subset the R-squared values:
#First, read in the data mtcars
data(mtcars)

mtcars %>%
   split(.$cyl) %>% #selecting cylinder to create three sets of data using the cyl values
   map(~ lm(mpg ~ wt, data = .)) %>%
   map(summary) %>%
   map_dbl("r.squared")
Output
    4         6         8
0.5086326 0.4645102 0.4229655
So did you observe? This example uses purrr to solve a fairly realistic problem:
- Split a data frame into pieces
- Fit a model to each piece
- Compute the summary
- Finally, extract the R-squared values
Saves us a lot of time, right? Instead of running three different models and three commands to subset the R-squared value, we just use one line of code.
Utilities: Other Awesome R Packages
Let’s look at some other packages that don’t necessarily fall under the ‘machine learning’ umbrella. I have found these useful in terms of working with R in general.
rtweet
Sentiment analysis is one of the most popular applications of machine learning. It’s an inescapable reality in today’s digital world. And Twitter is a prime target for extracting Tweets and building models to understand and predict sentiment.
Now, there are a few R packages for extracting/scraping Tweets and performing sentiment analysis. The ‘rtweet’ package does the same. So how is it different from the other packages out there?
![]()
‘rtweet’ also helps you check for tweet trends from R itself. Awesome!
# install rtweet from CRAN
install.packages("rtweet")

# load rtweet package
library(rtweet)
All users must be authorized to interact with Twitter’s API. To become authorized, follow the instructions below:
1. Make a Twitter app
2. Create and save your access token
For a detailed step by step procedure to get authentication from Twitter please follow this link here.
You can search for tweets with certain hashtags simply by the line of code mentioned below. Let’s try and search for all the tweets with the hashtag #avengers since Infinity War is all set for release.
#1000 tweets with hashtag avengers

tweets <- search_tweets(
  "#avengers", n = 1000, include_rts = FALSE)
You can even access the user IDs of people following a certain page. Let’s see an example:
## get user IDs of accounts following marvel

marvel_flw <- get_followers("marvel", n = 20000)
You can do a whole lot more with this package. Try it out and do not forget to update the community if you find something exciting.
Reticulate
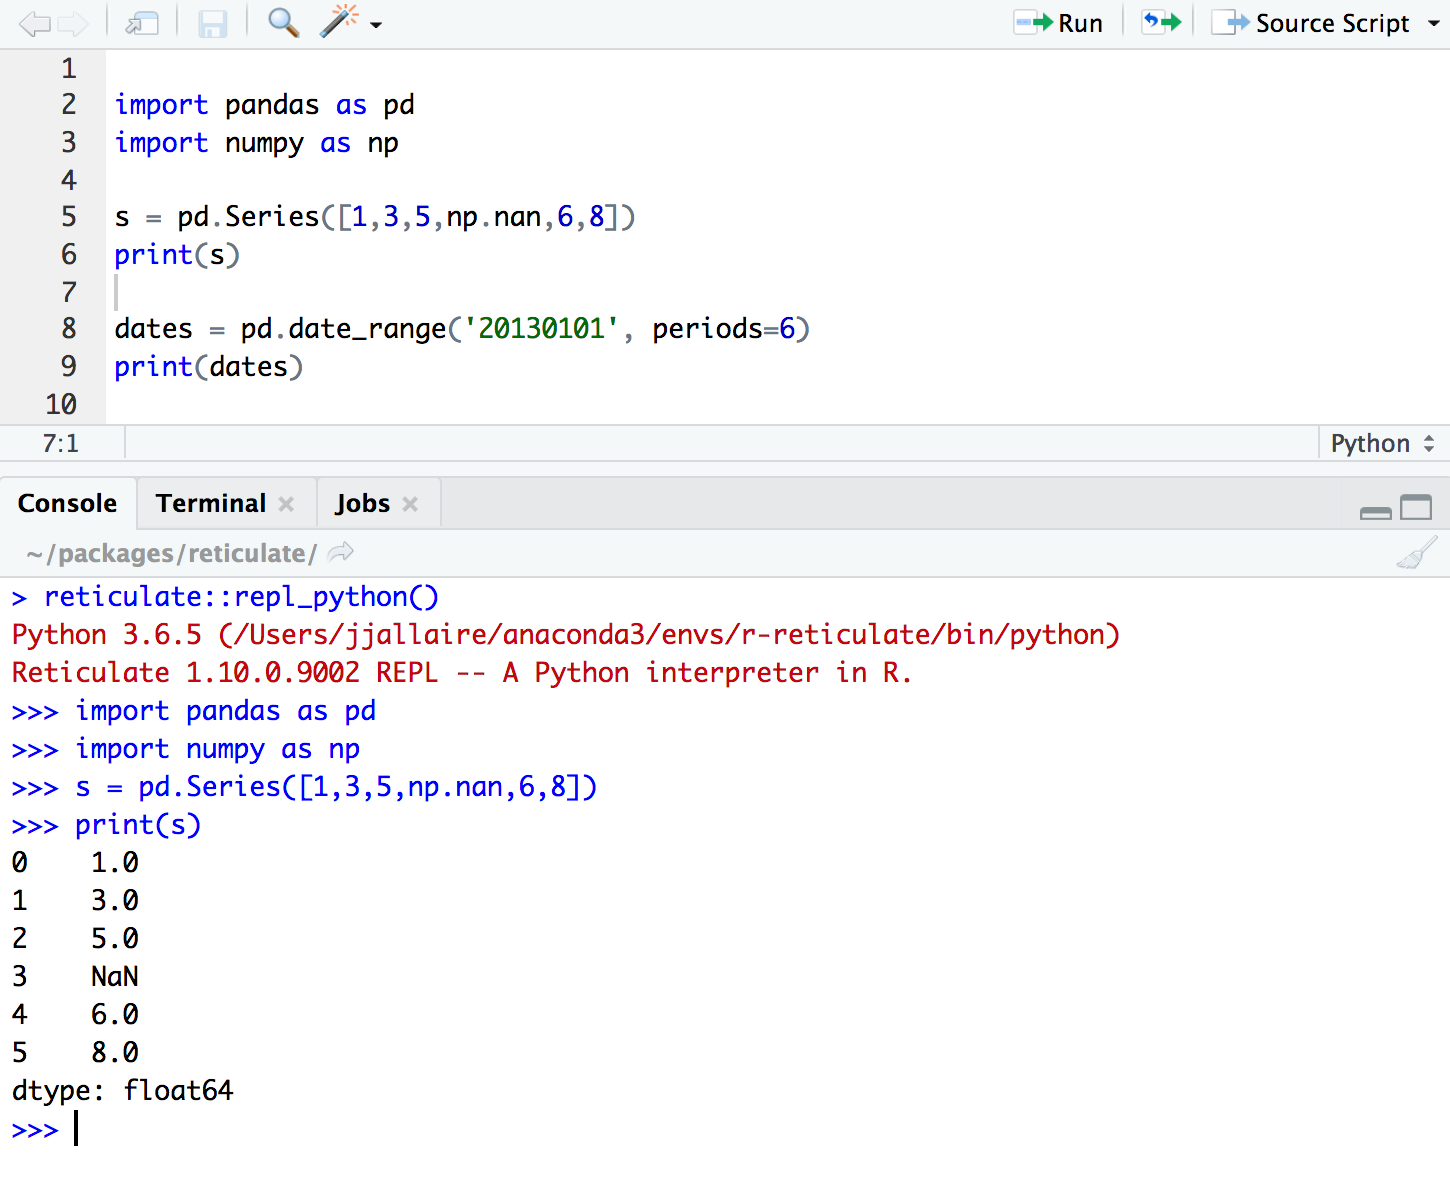
Love coding in R and Python both but want to stick to RStudio? Reticulate is the answer! The package solves this prominent problem by providing a Python interface in R. You can easily use major python libraries like numpy, pandas and matplotlib inside R itself!
You can also transfer your progress with data easily from Python to R and R to Python with just one line of code. Isn’t that amazing? Check out the below code block to see how easy it is to run python in R.
Before you move on to directly installing reticulate in R, you will have to install TensorFlow and Keras first.
install.packages("tensorflow")
install.packages("keras")

library(tensorflow)
library(keras)
install_keras()
install.packages("reticulate")
library(reticulate)
And you are good to go! Run the commands I have provided above in the screenshot and try out your data science projects in a similar manner.
BONUS
Here are two other utility R packages for all your programming nerds!
Installr
Do you update your R packages individually? It can be a tedious task, especially when there are multiple packages at play.
The ‘InstallR’ package allows you to update R and all its packages using just one command! Instead of checking the latest version of every package, we can use InstallR to update all the packages in one go.
# installing/loading the package:
if(!require(installr)) {
install.packages("installr"); require(installr)} #load / install+load installr

# using the package:
updateR() # this will start the updating process of your R installation.
# It will check for newer versions, and if one is available, will guide you through the decisions you'd need to make
GitHubInstall – An Easy Way to Install R Packages from GitHub
Which package do you use for installing libraries from GitHub? Most of us relied on the ‘devtools’ package for a long time. It seemed to be the only way. But there was a caveat – we needed to remember the developer’s name to install a package:
With the ‘githubinstall’ package, the developer name is no longer required.
install.packages("githubinstall")

#Install any GitHub package by supplying the name
githubinstall("PackageName")

#githubinstall("AnomalyDetection")
End Notes
This is by no means an exhaustive list. There are plenty of other R packages which serve useful functions but have been overlooked by the majority.
Do you know of any packages that I have missed in this article? Or have you used any of the above-mentioned ones for your project? I would love to hear from you! Connect with me in the comments section below and let’s talk R!


Very useful Information. Not aware of most of the packages mentioned above.
Hi Vijit! Thank you for the feedback. Stay tuned for some more amazing R articles.
I think that a very useful package is MLmetrics which makes almost all validation metrics ! Give it a look. Thanks ;-)
Hi Athang! Thanks for updating the community about another useful R package. Will surely take a look at it.
Thanks for valuable info Akshat!! Could you shed some light on R packages which help in productionizing the ML models like plumbr, opencpu etc., productionizing is one of the main aspect why we preferred Python over R, not sure of the recent developments in R.