This article was published as a part of the Data Science Blogathon.
“The International Space Station (ISS)”. It’s a dream place everyone wants to be. The feeling to observe the blue haze over the horizon from the window of the International Space Station(ISS) is in itself an incredible feeling. Want to know how the earth looks from space?. Well, here it is.
The International Space station travels about 18,000 mph around the earth. It takes only 90 minutes to complete 1 revolution of the earth.
Now you might ask, why am I telling you about the space station?
Well, today we are going to create our own International Space Station(ISS) detector using Python.
Pre-requisites
For building the ISS detector in python we need to have the following software components installed in the system.
1.Anaconda Distribution
2.Jupyter Notebook
3.Plotly
4.API
5.Python
6.Pandas
NOTE:- Important thing to consider here is that you need to install the anaconda individual edition here as it’s free of cost. When you installed anaconda, the jupyter notebook will also be installed and a part of it along with python distribution. So now let’s get started with our project.
Starting Jupyter-Notebook
You might be thinking, why starting a jupyter notebook(such a simple step) is described here. Well, big things have small beginnings 🙂
Now launching jupyter notebook depends on which operating system you are using. Since I am going to be using Ubuntu 20.04.2 LTS here, I will be showing you the steps that I have done. Even though OS is different rest everything is the same from a code perspective.
For launching a jupyter notebook in ubuntu or any Linux-based distro just open your terminal and type “jupyter-notebook” and press enter. I few seconds, you will see jupyter notebook open in your web browser.
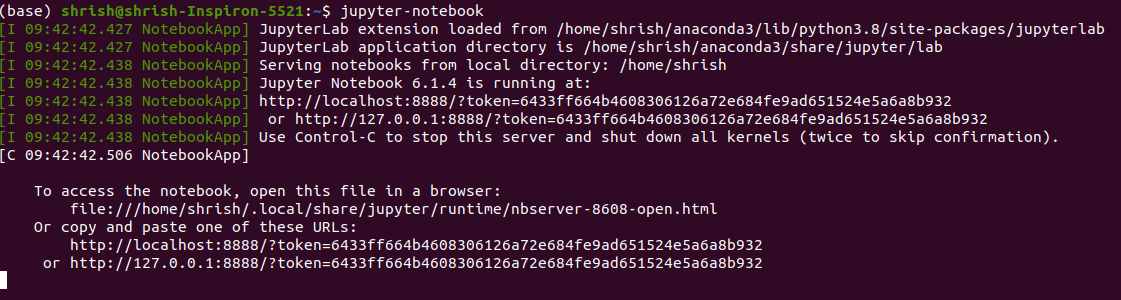
Jupyter notebook startup sequence when launched via terminal


Jupyter notebook as seen after launch
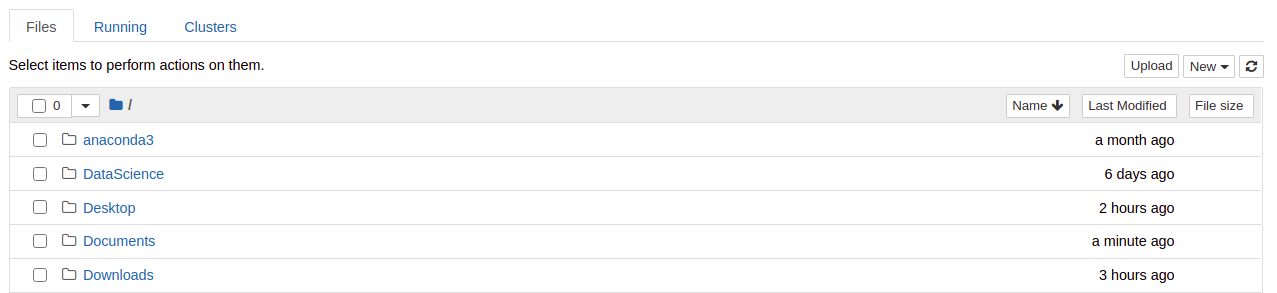
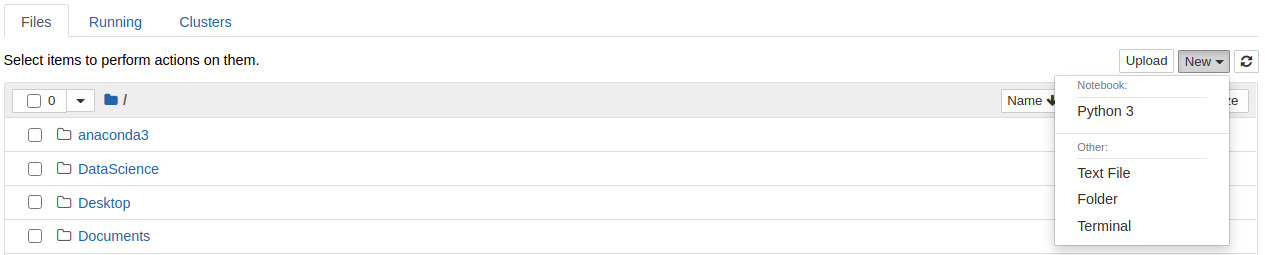
Creating a new jupyter-notebook
Once the jupyter-notebook is up and running, now we need to create a new notebook in it. Think of a notebook as a file that you are creating in a traditional IDE.
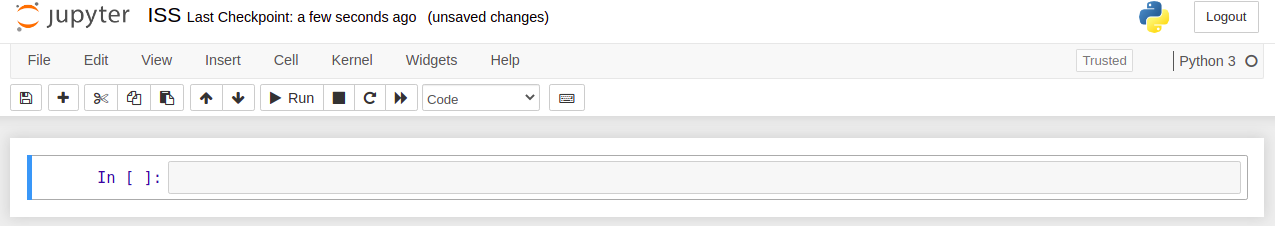
It is always a good practice naming your file. In this case, we name our file as ISS.
Installing the necessary Libraries
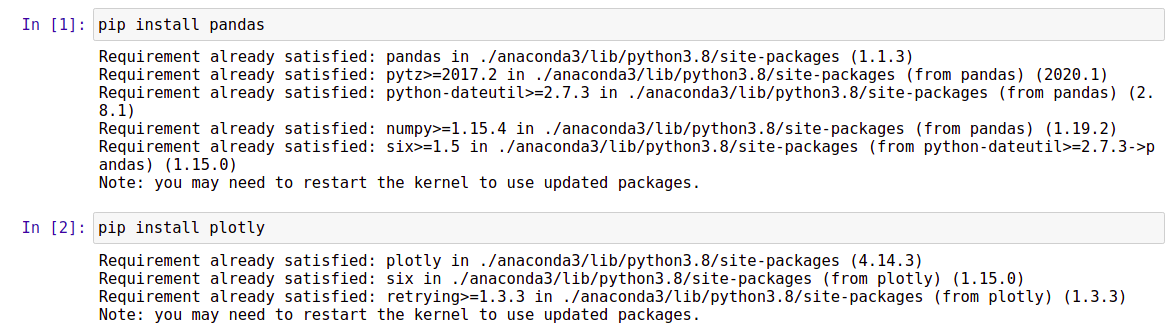
In this project, we are going to be using two python libraries namely pandas and plotly. If you already have those installed then you are good to go. If not, follow along with me.
Now we are going to install those using pip. Just enter below two commands inside your notebook and installation will start. Also, don’t forget to restart the kernel after installation is completed.

Package installation in Jupyter notebook
Using API
You now have a question. We are developing an ISS detector and ISS travels at the speed of 18,000 mph around earth taking around 90 minutes then how can we lock on the cor-ordinates of ISS? Well, this is the part where API comes into the picture.
If you googled about API(Application Programming Interface), you will find lots and lots about it. To explain things in a simple manner, let me give an example. Because of this COVID-19 pandemic, we are all working from home now. So how do we communicate with our team? Simply by using any chat application like Microsoft Teams, Slack, Skype. In a similar manner, API allows computers to exchange information with each other.
In this case, the API that we are going to use will provide us with the location of ISS in the earth’s orbit. For this, we are going to use an API now. Please visit this link from your web browser.
Link: http://open-notify.org/Open-Notify-API/ISS-Location-Now/
How we are going to use this API, Stay tuned for now 🙂
Starting with the Development of ISS Detector in Python
First, we will be loading the required libraries in the jupyter notebook. In this case, those are pandas and plotly.

Importing necessary libraries
Now comes the important part. Remember I told you about API and how we are going to use that. Now it’s time to see how we are going to use this.
The first thing to remember here is that API uses JSON as their language for communication Just like we used English as a language while working with our team.
So now visit the link which I mentioned above and after that copy “http://api.open-notify.org/iss-now.json” this.
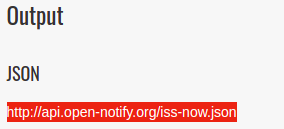
Once we copy this, we will be storing this value inside a variable, let’s called it a URL

Next, we are going to create a pandas data frame. In this, we are going to use the read_json() method. The reason is simple we are passing a URL for the API which will return results in JSON format and to read data in JSON format we have the read_json() method in pandas.
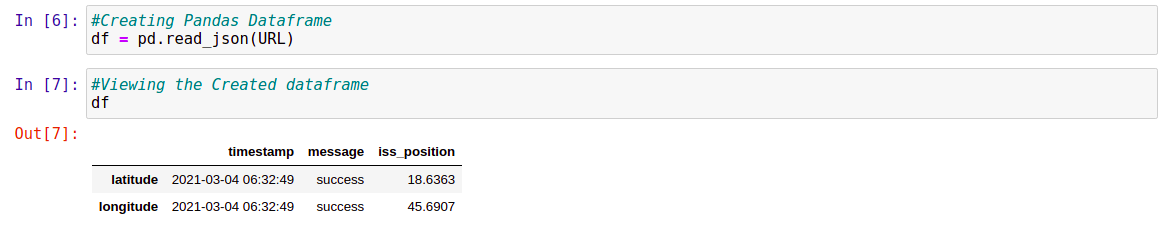
Creation of Pandas data frame
What are you seeing here? Here we can see 3 columns containing values of timestamp, message, and iss_position respectively. This latitude and Longitude will be the co-ordinates for ISS.
The content of the data frame seems to be a structured one however those are not suitable for graphical visualization. Let’s now re-arrange our data frame a bit more.
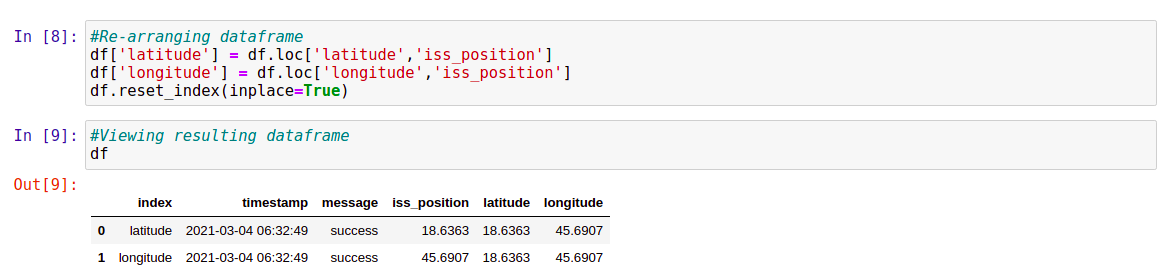
Here we have now re-engineered our data frame.
Now I have a question. Do we really need an index and message column in our data frame? Because ultimately we need to have information regarding co-ordinates of ISS. hence we will be dropping index and message columns from our data frame.
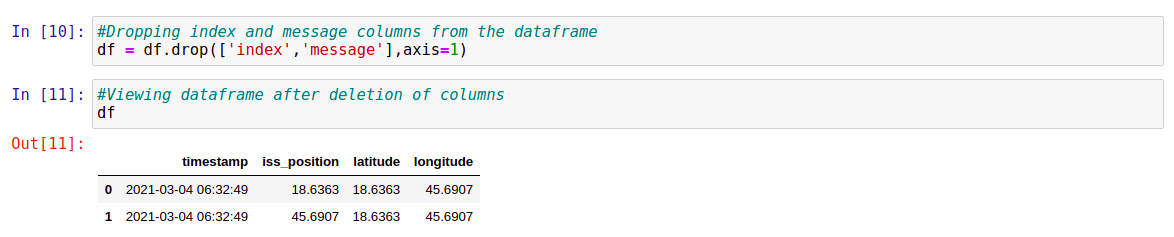
Our final data frame now contains only the variables which we are interested in. Here in the drop function, we have passed an argument axis=1 meaning that we are removing this column from the data frame(columns always have axis =1 and rows have axis = 0).
Testing the ISS Detector in Python
Here comes the interesting part, finding the position of ISS. Let’s get into it straight away.
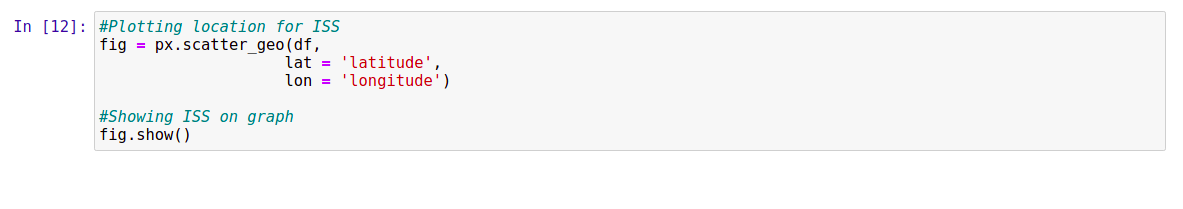
Plotting location for ISS using plotly
Here we have used the scatter_geo() method to create a sort of world map and in that method, we passed our data frame having latitude and longitude of ISS.
Are you ready to see the position of ISS :)? I bet you are. Here it is then:
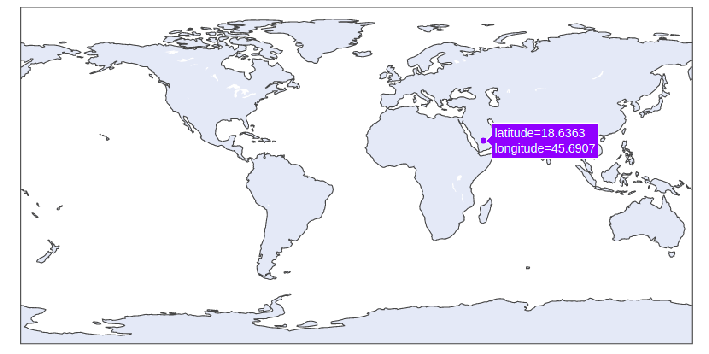
Can you see that purple dot? That’s the position of ISS!
Once your plot is created, you will see a tiny dot on this world map. Just move your mouse pointer over that dot and you can see the exact location of ISS.
I hope you like this article.
Please share this with you, friend and colleagues.
Connect with me on LinkedIn.
NOTE:– This article is inspired by a youtube video by a “Python Programmer“. Please do check out this channel as it offers great knowledge about python programming and is the source of inspiration for this article
Link: https://youtu.be/R6CCTuHast0
The media shown in this article are not owned by Analytics Vidhya and is used at the Author’s discretion.
My name is Shrish. I have been working as a data scientist at EY. I love technology and during my free time, I try to use my skills to create something awesome in python so that it can be shared on the analyticsvidhya platform


