This article was published as a part of the Data Science Blogathon.
Introduction
Exploratory Data Analysis, or EDA, examines the data and identifies potential relationships between variables using numerical summaries and visualisations. We use summary statistics and graphical tools to get to know our data and understand what we may deduce from them during EDA.
To do EDA, we employ various technologies, including python and pandas profiling. However, to use any of these tools effectively, a person must be familiar with coding, and learning these tools takes a lot of time and effort.
What if we can make visualisations with drag and drop without much coding? How cool it would be if we could make summary statistics without writing any code? Einblick can do all these things and much more without much hassle.
In this article, we will discuss Einblick and do exploratory data analysis with Einblick on the tips dataset.
What is Einblick?
Einblick is a tool that can be used to explore datasets, create machine-learning models and make predictions. It can also be used to deploy data apps, and the best thing is that this tool can be used collaboratively with many team members in real-time collaboration.
We can use this tool to clean our data and explore and visualise the data. We can also use this to manipulate our data and create aggregate tables. Einblick also offers an AutoML solution that can be used to create machine-learning models and make predictions. We can encode data, extract text features, and perform clustering analysis. All this can be done without any code. All we need to do is drag and drop the appropriate elements.
But that doesn’t mean it is completely no-code. It also offers an option to create python cells so that we can do any complex data manipulations. We will see how to make visualisations and explore the dataset in the subsequent sections. We will use the tips dataset for this demo.
How to do EDA using Einblick?
Now that we have seen Einblick, let’s start working on this. Firstly, go to the official website and signup for a free account. You will see a dashboard that looks like the one below.
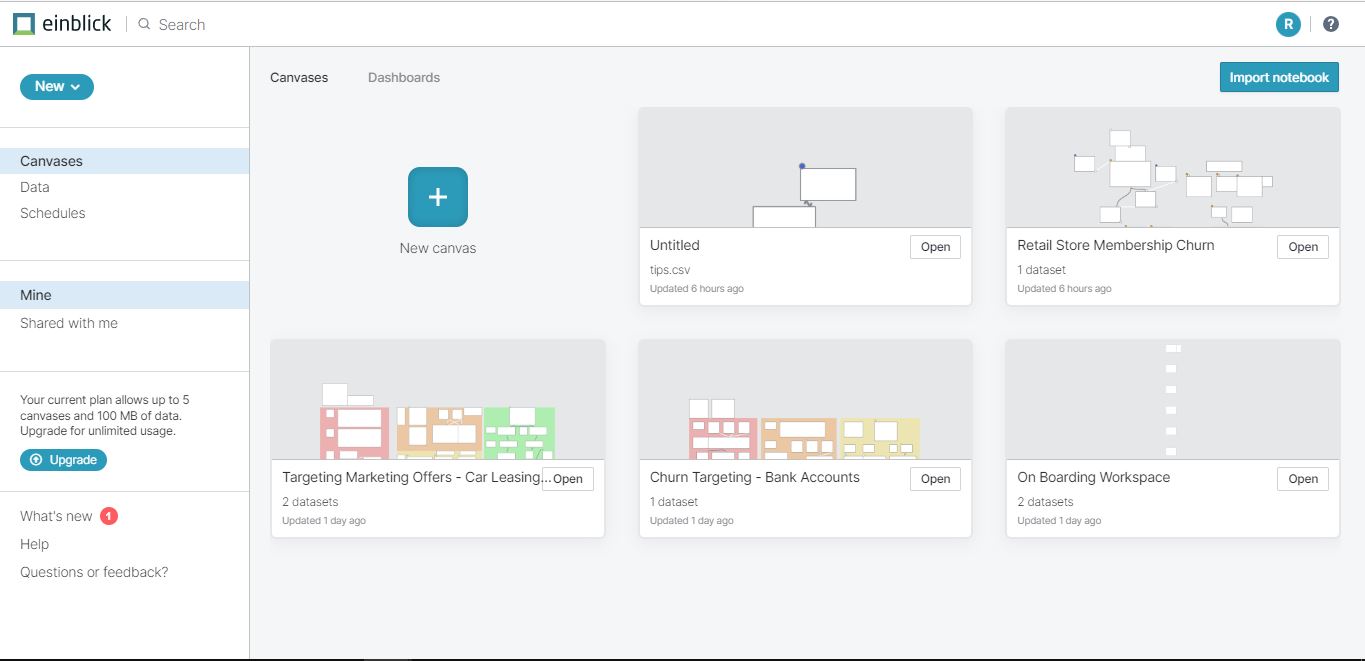
Click the ‘New canvas’ button that is visible on the screen. It will create a new canvas where you can do all the operations. It looks like the one below.
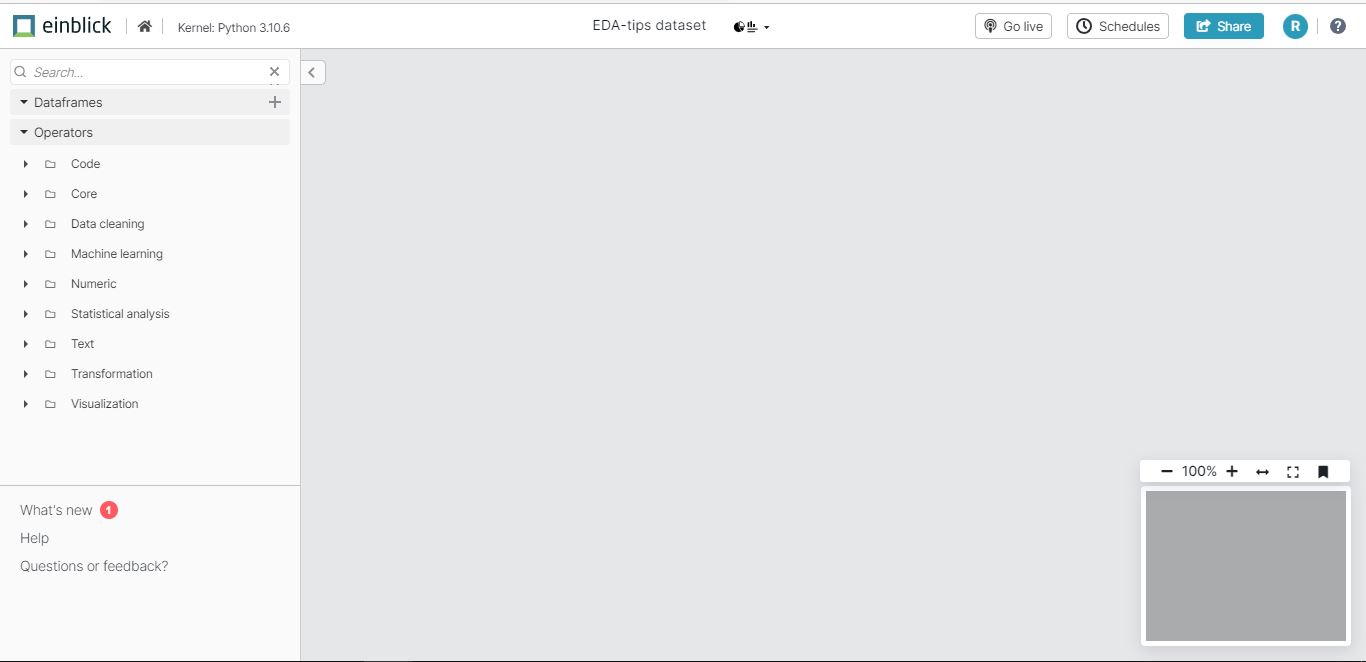
We can see two options, ‘Dataframes’ and ‘Operations’. Dataframes are used to add the data frames from appropriate data connectors. Operations are used to perform different functions on the dataset. We will use the tips dataset for this demo.
Click the plus symbol beside the Dataframes option and upload the dataset. Once the upload is complete, drag the dataset to the canvas, i.e. to the right of the screen, which is blank, and click the ‘table’ option to see the data frame. We can see the data frame with all the data displayed and the number of rows and columns.
Now let us describe the dataset using the ‘profiler’ option. Under the ‘Operations’ menu, click the ‘Core’ option. You can see the ‘Profiler’ option. Drag and drop it into the canvas, i.e., into the right side of the screen. Once you drop it into the canvas, drag the under arrow mark visible on the data frame and attach it to the plus symbol on the ‘Profiler’ tile. After this, Einblick works in the background and describes all the columns in the dataset, as shown below.
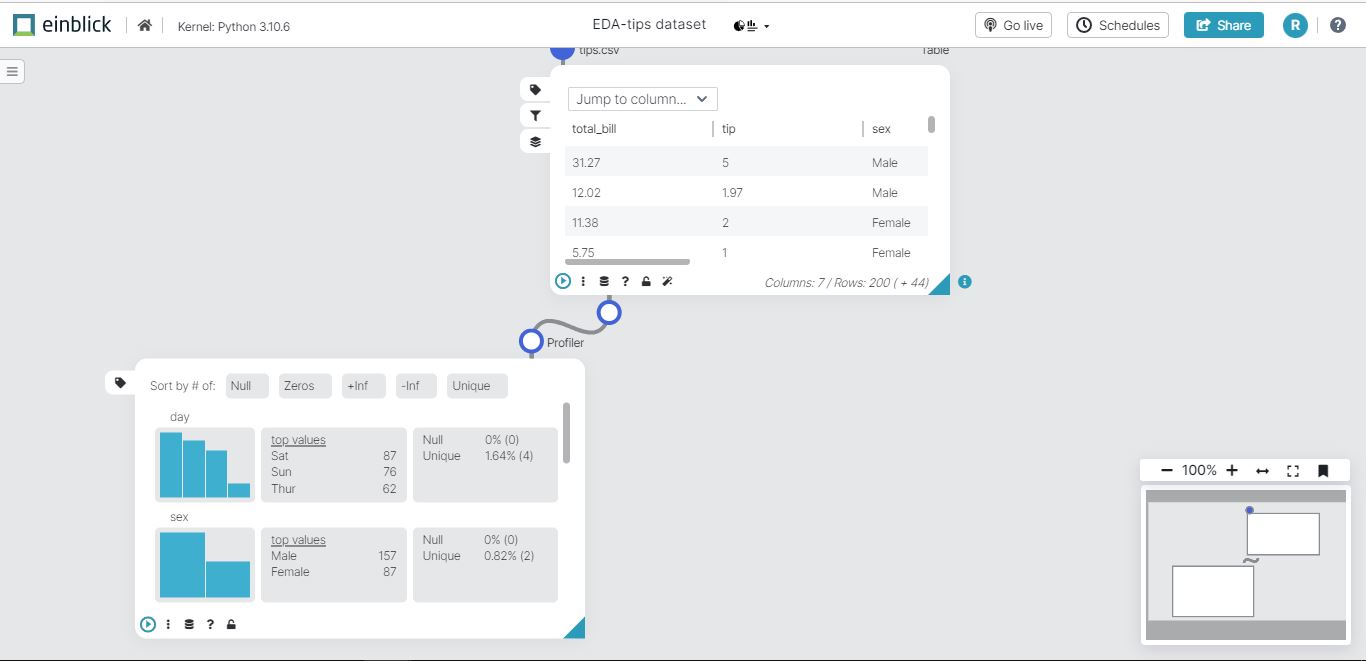
As we can see, all the columns are described along with their null and unique values. For Numerical variables, summary statistics like mean, maximum, and minimum are also described. All this without writing a single piece of code. We just uploaded a dataset, dragged and dropped appropriate tiles, and got this. Now let’s plot some graphs and see the trends in the dataset.
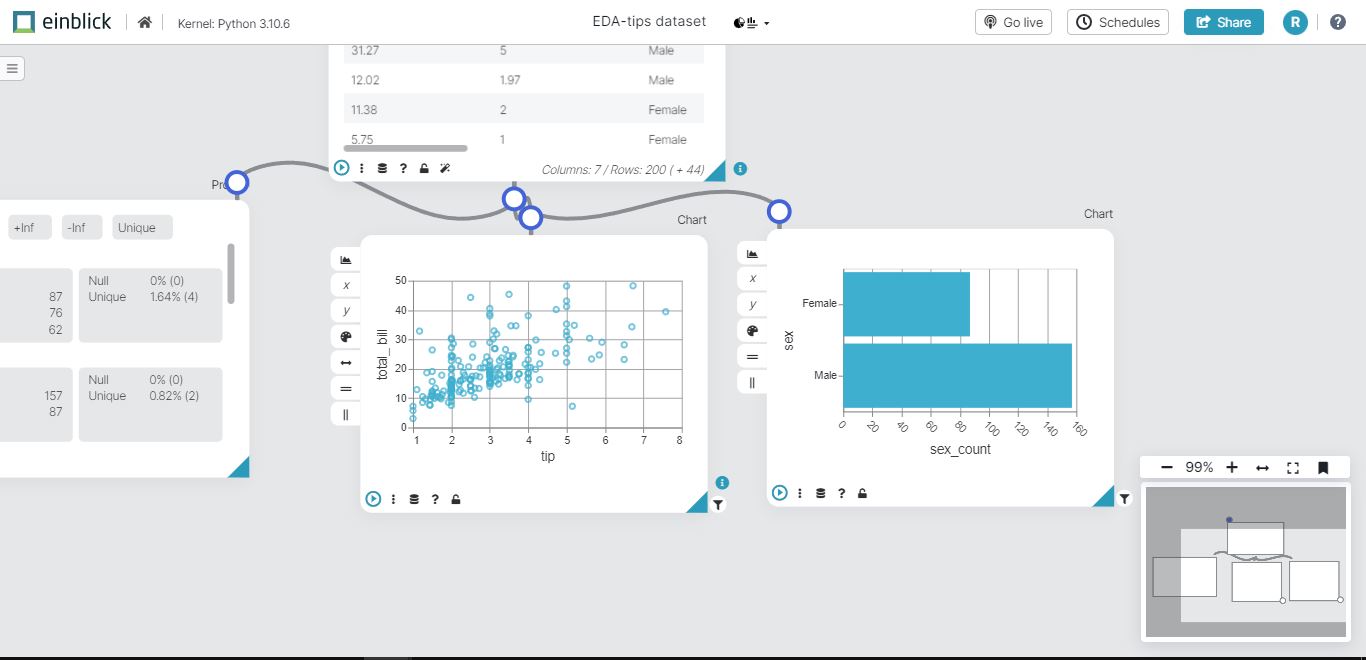
Firstly, we will plot a scatter plot between the attributes ‘total_bill’ and ‘tips’. To do this, under the ‘Operations’ menu, click the ‘Visualization’ menu and drag the ‘Chart’ option into the canvas. Now connect the data frame to this chart tile as we did previously. Now we need to choose the type of plot we want. Since it is a scatter plot, click the chart type on the chart tile and choose scatterplot. Also, choose the x and y axes. Einblick will automatically plot the graph for us. It looks like the one below.
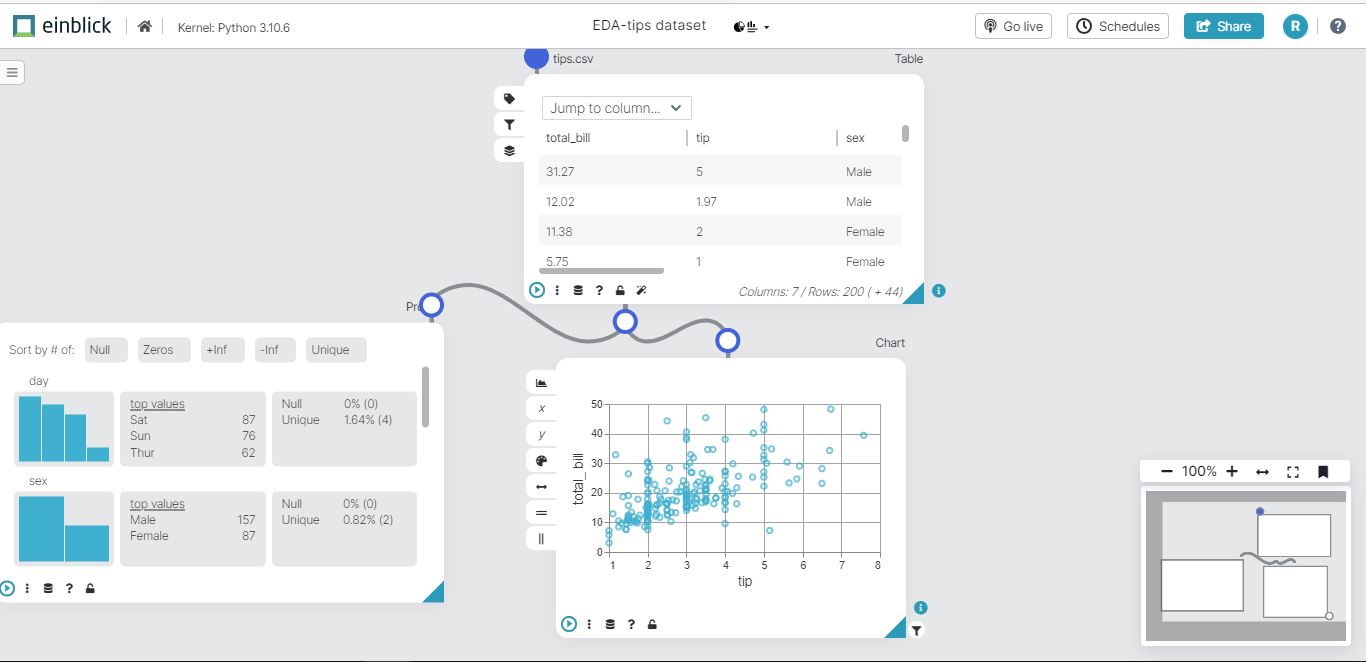
We can see the scatter plot between the total_bill and tip. Now let’s see some univariate plots. Firstly we will plot the countplot of the attribute ‘sex’. Drag the ‘Chart’ option into the canvas as we did in the previous step. Now, choose the vertical bar chart. Choose ‘sex’ as the x-axis and aggregate as the ‘count’ as we want to see the countplot. Now choose the y-axis as ‘sex’ so we will get a countplot as shown below.
As shown in the above graph, males are higher than females. Similarly, let’s see the countplots of the attributes ‘smoker’ and ‘day’. Create a ‘chart’ option as we did before and choose the ‘vertical bar’ type of chart. Choose the x-axis as ‘smoker’ and the aggregate as ‘count’. Choose the y-axis as ‘smoker’. Einblick will create a countplot of the ‘smoker’ attribute.
Similarly, create another ‘chart’ tile in the canvas and repeat all the steps we did in the previous one. But now choose ‘day’ as the x-axis and ‘count’ as the aggregate ‘day’ as the y-axis. We will see the countplot. The result will look like the one below.
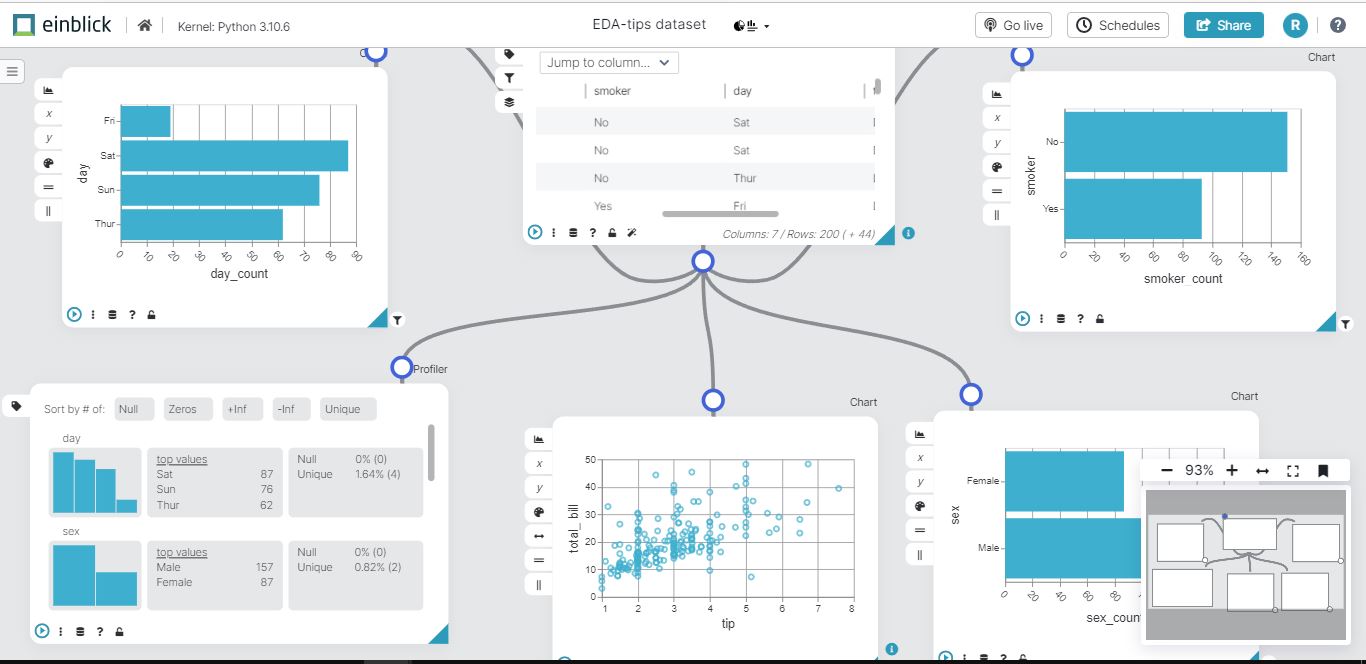
We can see that the non-smokers are higher than the smokers and the count on Saturday is the highest, which means the most customers visited on that day.
If you observe, we never used any code. It just drags and drops as we do in Tableau or PowerBI. But this is much more simple to visualise data and get insights rapidly. So far, we have performed univariate analysis by creating three plots that analyze a single variable, in addition to describing the data and creating a bi-variate plot, as shown above, in a simple manner.
Conclusion
EDA is an essential task in machine learning model building. It gives us quick insights into what our data is. So having good tools that simply give us results is necessary. Einblick does this job perfectly without any hassle. Einblick is
- Simple to use
- No to low code tool
- Offers a wide range of operations to be performed on the dataset
- Offers real-time collaboration among the users
Try this simple tool for your next EDA project and surprise everyone. Feel free to comment below if you have any questions.
Image-1 source: Einblick Website
The media shown in this article is not owned by Analytics Vidhya and is used at the Author’s discretion.


