This article was published as a part of the Data Science Blogathon.
Introduction
Predicting events and happenings has been an interesting skill for humans since the dawn of civilization and remains so today. This ability has been so attractive to many that they have selected the career of “prophecy” for themselves, attracting many followers and revenue in the process. Some of those people’s names, such as “Nostradamus,” are still heard, and some people are still looking for the realization or non-realization of his predictions after centuries.

Forecasting what will happen in the future is considered a critical business skill. In most cases, a company’s level of insight and understanding about the future is directly linked to its level of validity, success, and the rate at which it moves through the stages of growth. So, a company makes plans based on what will happen in the future; due to this, most businesses today pay more attention to data science and spend a lot of money to make their businesses more data-driven. Many companies also employ many data scientists and set up departments for data science.
It is evident that today’s forecasts, developed with data science, are significantly different from those made centuries ago. Forecasting and getting insights with the help of data science is a scientific process based on the analysis and a close look at a data set.
Let’s leave the business world and move to the more yellow world of elections. Guess who will win an election is one of the most interesting things people do. Every year, before an election, several statistical and research agencies start collecting and analyzing data to determine who will win before voting. As a result, Politicians usually pay statistics organizations large sums of cash to produce real-time reports on how the public perceives them. This way, the candidate can use intelligence to lead his campaign.
Main Problem with Collecting Data
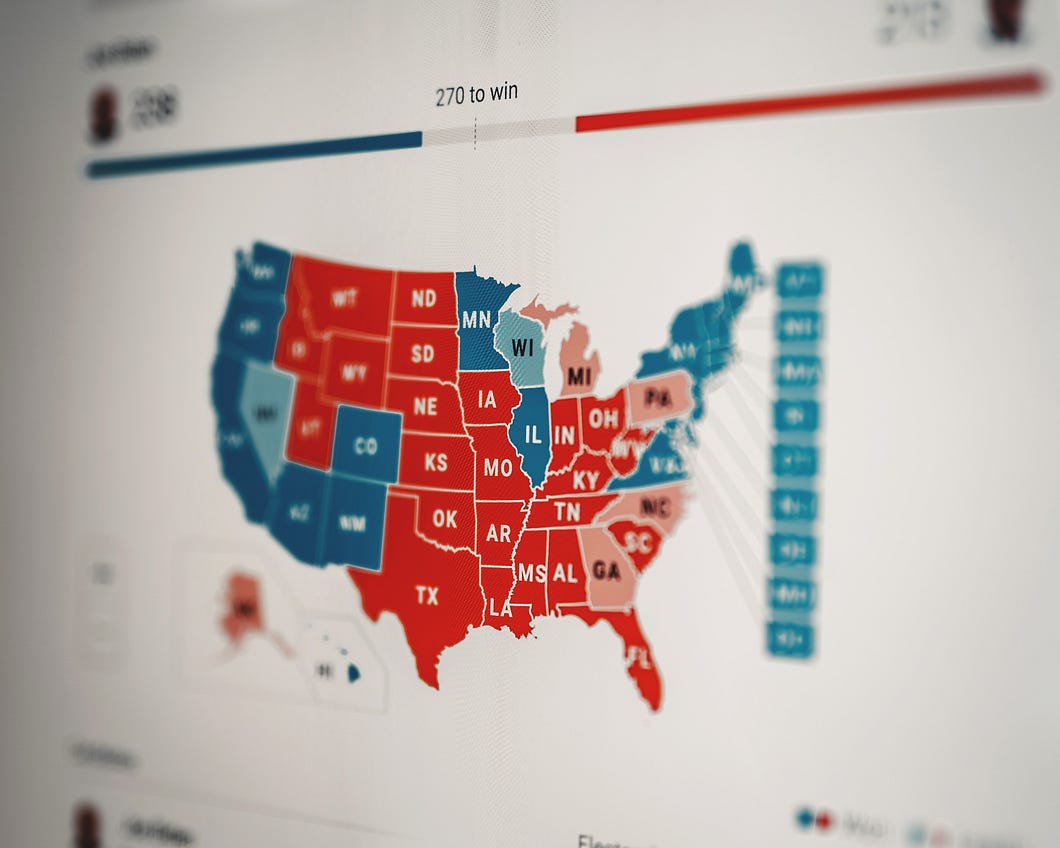
Most enterprises and institutions that collect data have a big problem when they try to predict elections: they have a lot of wrong information. This problem will lead to wrong conclusions in the end. This problem was one of the most obvious during the 2016 presidential election in the US. In that year, Donald Trump and Hillary Clinton were in the race. Most polls and reputable news sites at the time said Hillary would win the election easily.
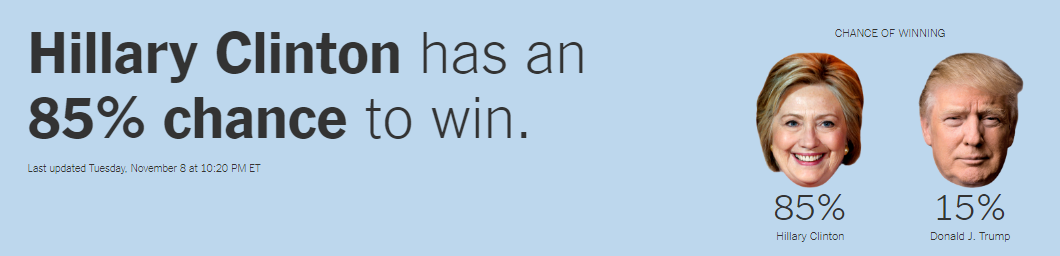
Source: NYTimes
Most people believed this prediction because, on the one hand, there was Trump, who had no political experience and had campaigned for election by making very harsh and aggressive statements. On the other hand, Clinton has been involved in politics for more than 30 years and has served as Secretary of State. With all of these explanations, it didn’t seem so unusual that Clinton beat Trump. Many reliable news sources, like the New York Times, said that Clinton’s chances of beating Trump were 85 to 15.
The Whole World is Impressed!
The whole world was amazed as the votes were being counted. Even the most optimistic statistical groups didn’t think Trump had a chance, but he won the electoral votes of key states one by one and quickly got the 270 electoral votes he needed to become president.
At the end of the vote, Trump won with 306 votes to Clinton’s 232. This was one of the most surprising results in US electoral history. This failure shocked a lot of data scientists. Many papers have been written up to this point, and many different parts of this situation have been examined.

One of the main reasons why many pre-election polls give different results is that people don’t say who their favorite candidate is for various reasons. So, they either didn’t vote or said they would vote for someone else. However, on election day, when they went to the polls, they voted for their ideal candidate, who wouldn’t say his name. If most people do this, it’s clear that the poll results will change, and a statistical disaster like what happened in 2016 will happen again.
A Summary of What the Problem is!
In this article, we are not going to find out why the predictions for the 2016 elections were completely mistaken. In the future, we might publish a more in-depth article about the statistical reasons and factors that led to this. In this article, we’ll learn about a game based on math and statistics.
As was already said, one of the most important factors in predicting mistakes is the amount of wrong information that gets into the survey. Now, if we can change how we collect data to make it much more accurate, our prediction of how the election will turn out will probably be right. We’ll look at examples of this type of data tracking in the following sections.
Imaginary Forest
In a faraway forest where 200 animals live, there is an election to choose the forest leader. “Ms. Tree” and “Mr. Pig” are the two candidates in this election. “Ms. Tree” has been teaching forest residents for a long time. It thinks everyone in the forest and neighboring forests should live peacefully and work together.
On the other hand, “Mr. Pig” is a violent person who loves fighting. He thinks that a lot of the resources should be put into the military and, if possible, used to attack neighboring forests and steal their resources. A secret group that works in the forest has given us the job of finding out who will win the election before it happens. Our lives are at risk if we are wrong about what will happen!

As a result, we decided to survey every forest member to predict the election’s true winner. When we ask people who their favorite candidate is, Based on the atmosphere in the forest, the following things will happen:
- If a person wants to vote for “Ms. Tree,” he selects her as his preferred candidate.
- If someone wants to vote for “Mr. Pig”, they probably will give us the name of the “Ms. Tree” (We don’t know how often this happens, but we do know that it does happen sometimes.)
As a result, the most important thing for us is to get accurate data from forest people. So, we should use a strategy that lets us find out people’s real favorite candidate without making them say it out loud. In other words, we need to find a middle ground between our language and theirs so that they can answer our questions in that middle-ground language and we can understand them. While we get accurate information from a person, his or her personal opinion is kept private and does not become public. But what should be done to solve this problem?
A Coin and an Endless Amount of Possibilities
All you have to do to solve this problem is use a coin as a guide. Each coin sample space can be either “heads” or “tails.”

- If the coin lands on “heads,” mention the name of the candidate you want to vote for.
- If the coin lands on “tails,” the coin is thrown, call out the name of the “Mr. Pig.”
As was already said, the biggest problem with tracking data about the election was that many people who were willing to vote for the “Mr. Pig” didn’t come out and say so for various reasons.
- Total number of votes: 200
- Total Number of votes for “Mr. Pig”: 130
- Total Number of votes for “Ms. Tree”: 70
It’s now time to use your math skills. We know that the likelihood of receiving a “heads” or a “tails” When you flip a coin is equal to 1/2 (one half). So, if we flip a coin 200 times, We can almost be sure that 100 heads and 100 tails would come up.
We have, in fact:
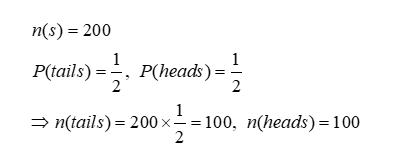
The second rule of the game was that if the coin came up “tails,” you had to call out the name of the “Mr. Pig.” As a result, 100 individuals have announced his name without necessarily wanting to vote for “Mr. Pig.”
As a result, we must deduct 100 votes from the 130 total votes for “Mr. Pig” since there was no power in these 100 votes, and the people declared the name “Mr. Pig” only to comply with the game’s rules.
As a result, just 30 people voted for “Mr. Pig.” This is even though the 70 votes cast for “Ms. Tree” were all valid since the game’s rules provide that anybody who receives “heads” after flipping a coin should vote for his favorite candidate.
As a result of using this rule, we will have:
- Total Number of votes for “Mr. Pig”: 30
- Total Number of votes for “Ms. Tree”: 70
Due to the big difference in votes between “Ms. Tree” and “Mr. Pig,” it is safe to predict that “Ms. Tree” will win on election day. We got the information we needed from them and predicted the election outcomes using this approach without violating people’s privacy.
Some might question if there is a situation in which someone wants to vote for the “Mr. Pig,” but since the “tails” side of the coin has come, his vote is effectively ignored.
This question has these answers;
- First, we are aiming to predict the winner of the election; it is not our objective to calculate how many votes each candidate will get, and we simply do not have the ability to do so properly.
- Second, This situation works just as well the other way around. In that case, some people voted for “Ms. Tree,” but their votes were not counted because the “tail” side of the coin had come. So, these factors won’t have much of an effect on the outcome of our forecast and our prognosis is correct.
In the rest of this article, we’ll discuss how this approach can be used in product management.
Product Launches and Surveys
Your company just launched a new product. You are head of product management for this product, and after some time has passed, you create a survey with two answer choices to get more information and insight into user views.
To get more people to fill out the survey and fill it out, the company will give $10 to each person who responds to the survey. But if you give people this incentive, they might be more likely to choose options with positive meanings and avoid ones with negative ones.
But if people didn’t get these ten dollars, they might not participate as much and not read the questions correctly. So, a plan should be put in place that gets people more motivated and makes them more accurate. So, you decide as a product manager to make the following game.
As we’ve already said, each question’s answer has two choices: one with a positive concept load and the other with a negative concept load. Now, you put a “+” sign next to options with a positive conceptual load and a “-” sign next to options with a critical conceptual load. At the start of the survey, you ask the participant to hold a coin and answer the questions in this way;
- Before reading the question, flip a coin.
- If a “tails” coin is flipped, pick the positive answer (+) without reading the question.
-
If the “heads” coin shows up, read the question to the end and pick the answer that best shows your point of view.
You have therefore made it less likely that people will be forced to make a positive choice. You can now keep a closer eye on the survey results. For example, one of the questions that two thousand participants responded to was as follows:
- Total participant count: 2000
- 1300 people voted for the choice with a good connotation
- 700 people voted for the choice with a negative and critical connotation.
We proceed as before, knowing that in two thousand coin tosses, the “tails” coin and the “heads” coin will appear about a thousand times. We have, in fact;
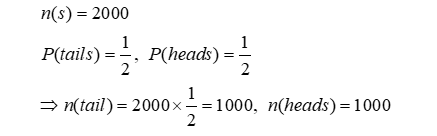
We removed 1,000 from the 1,300 positive votes since, according to the guidelines, if the “tails” coin shows up, folks choose the positive choice (without even reading the question). We will now have;
-
300 people voted for the choice with a positive connotation.
-
700 people voted for the choice with a negative and critical connotation.
So, as a whole, we can say that directly opposed to what was shown at the beginning, most people had a negative perception of that question, and as product managers, we need to find out why.
So, by adding a financial incentive, the number of people who took the survey climbed. On the other hand, by making this simple game, the answers became much more accurate, which means that in the future, more realistic decisions can be made based on the survey results.
Conclusion
According to the topics we discussed, one of the most significant factors to consider while running a questionnaire and collecting data is the accuracy of the data. If the data isn’t collected correctly, it’s clear that its conclusions will be misleading.
Most of the time, the following things cause survey questions to get the wrong answers:
-
The questions are about private things, and the person doesn’t feel safe answering them.
- One of the alternatives doesn’t have a good reputation, which makes people not want to choose it because they don’t want to be judged.
-
Putting a person in a situation where he has to choose between two options
In general, it is the job of the people who creates the survey and the person who collects the data to detect such situations. To solve the problems, the following steps should be taken:
- Creating a language between the person asking the question and the person answering it so that the person answering can confidently choose the right answer.
- Minimizing the area for judgment and providing a secure atmosphere in which the responder may choose the preferred alternative.
By taking the above steps, the quality of data tracking will greatly improve, making it more likely that conclusions and assessments based on this data are proper.
Please feel free to share your thoughts or reading tips in the comments.
Follow me on LinkedIn, and Twitter.
The media shown in this article is not owned by Analytics Vidhya and is used at the Author’s discretion.


Looking forward to reading following articles👌🏻