Most real-world classification problems are imbalanced. Fraud, disease, churn, and defects are rare by nature. Standard classifiers chase accuracy, so they quietly ignore the very class you care about. For years, SMOTE was the reflex fix that everyone reached for first.
But SMOTE often fails on the messy, high-dimensional data that production systems actually see. This guide goes beyond SMOTE. You will learn cost-sensitive learning, modern loss functions, balanced ensembles, anomaly detection, and the metrics that expose what really works.
Table of contents
- What Is Class Imbalance?
- Setting Up the Playground: Dataset, Environment, and Baseline
- A Quick Refresher on SMOTE and Its Variants
- Why SMOTE Often Fails in the Real World
- Rethinking the Approach: Four Levels of Intervention
- Modern Loss Functions for Imbalance
- Threshold Tuning and Decision Calibration
- A Practical Decision Framework
- Real-World Example: Building a Fraud Detection Pipeline
- Comparing Results Across Metrics
- Conclusion
- Frequently Asked Questions
What Is Class Imbalance?
Class imbalance describes a skewed distribution between the target classes you want to predict. The smaller group is the minority class, and the larger group is the majority class. We usually express the skew as an imbalance ratio, such as 100:1. A ratio of 100:1 means one rare case appears for every hundred common ones.
The minority class is almost always the one with business value. Fraudulent transactions, malignant tumors, and churning customers are rare but expensive to miss. So the cost of errors is asymmetric, and that asymmetry should drive every modeling choice you make.
Where Imbalance Shows Up in Practice
Imbalance is the rule, not the exception, across applied machine learning. The rare class is the signal, and the common class is the background noise. The following domains all share this structure, and each one rewards careful handling of the minority class.
- Fraud detection: Fraudulent transactions often make up well under 1% of all activity. A model must flag them without drowning analysts in false alarms.
- Medical diagnosis: Most screened patients are healthy, so positive cases are rare. Missing a true positive can be life-threatening, which raises the cost of false negatives.
- Churn prediction: Only a small fraction of customers cancel in any given month. Catching them early enables targeted retention offers.
- Anomaly and fault detection: Machines run normally most of the time. Failures are rare, sudden, and very costly to overlook.
- Rare-event forecasting: Natural disasters, equipment breakdowns, and security breaches are infrequent but high-impact events worth predicting.
Why Accuracy Is a Misleading Metric
Accuracy measures the share of correct predictions across all classes equally. That sounds reasonable until one class dominates the dataset. With a 98% majority class, a model can hit 98% accuracy by predicting nothing useful. It simply labels every case as the majority and never finds the rare event.
This is why accuracy lies on imbalanced data. A high score can hide a model that is completely blind to the minority class. You need metrics that focus on the rare class, such as precision, recall, and PR-AUC. We will return to those metrics in detail later.
Setting Up the Playground: Dataset, Environment, and Baseline
Before comparing techniques, we need one consistent dataset and a clear baseline. A shared playground lets us judge each method on equal footing. We will build a synthetic fraud-like dataset with heavy imbalance. Then we will train a naive classifier to show exactly how accuracy misleads.
The Dataset We’ll Use Throughout
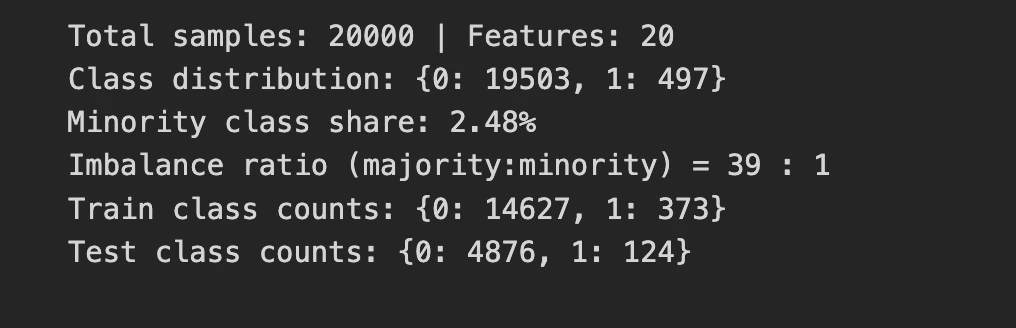
We generate a binary dataset with 20,000 samples and a roughly 2% minority class. This mimics a realistic fraud or rare-event scenario without needing private data. Using synthetic data keeps the examples reproducible on any machine. You can swap in your own dataset later with almost no code changes.
Environment and Libraries
The examples rely on a small, standard stack from the Python ecosystem. Each library plays a specific role in the imbalanced-learning workflow. Install them with pip before running any of the code below.
scikit-learn: Core models, metrics, splitting, and the pipeline machinery.- i
mbalanced-learn(imblearn): Resamplers like SMOTE plus balanced ensembles such as Balanced Random Forest. XGBoost/LightGBM: Gradient boosting with built-in support for class weighting and custom objectives.
pip install scikit-learn imbalanced-learn xgboostCode Demo: Loading the Data and Inspecting the Imbalance
First, we create the dataset and inspect its class distribution. Always look at the raw counts before modeling anything. We also split the data with stratification to preserve the imbalance ratio. Stratified splitting keeps the minority share consistent across train and test sets.
import numpy as np
from collections import Counter

from sklearn.datasets import make_classification
from sklearn.model_selection import train_test_split


ification
from sklearn.model_selection import train_test_split


RANDOM_STATE = 42

# Shared "playground" dataset: a ~2% fraud-like minority class
X, y = make_classification(
    n_samples=20000,
    n_features=20,
    n_informative=6,
    n_redundant=4,
    n_clusters_per_class=2,
    weights=[0.98, 0.02],
    class_sep=0.8,
    flip_y=0.01,
    random_state=RANDOM_STATE,
)

print("Total samples:", X.shape[0], "| Features:", X.shape[1])
print("Class distribution:", dict(Counter(y)))

neg, pos = Counter(y)[0], Counter(y)[1]

print(f"Minority class share: {pos / (pos + neg):.2%}")
print(f"Imbalance ratio (majority:minority) = {neg / pos:.0f} : 1")

X_train, X_test, y_train, y_test = train_test_split(
    X,
    y,
    test_size=0.25,
    stratify=y,
    random_state=RANDOM_STATE,
)

print("Train class counts:", dict(Counter(y_train)))
print("Test class counts:", dict(Counter(y_test)))
Output:
Code Demo: A Naive Baseline Classifier
Now we train a plain logistic regression with no imbalance handling. We then compare its accuracy against its recall on the minority class. The gap between these two numbers is the heart of the problem. Watch how a high accuracy score hides a near-useless model.
from sklearn.linear_model import LogisticRegression
from sklearn.metrics import (
    accuracy_score,
    balanced_accuracy_score,
    confusion_matrix,
    classification_report,
)


clf = LogisticRegression(max_iter=2000)

clf.fit(X_train, y_train)
y_pred = clf.predict(X_test)

print("Accuracy         :", round(accuracy_score(y_test, y_pred), 4))
print("Balanced accuracy:", round(balanced_accuracy_score(y_test, y_pred), 4))
print("Confusion matrix:\n", confusion_matrix(y_test, y_pred))
print(classification_report(y_test, y_pred, digits=3))


# A model that predicts EVERYTHING as the majority class
dummy = np.zeros_like(y_test)

print(
    "Predict-all-majority accuracy:",
    round(accuracy_score(y_test, dummy), 4),
)
Output:
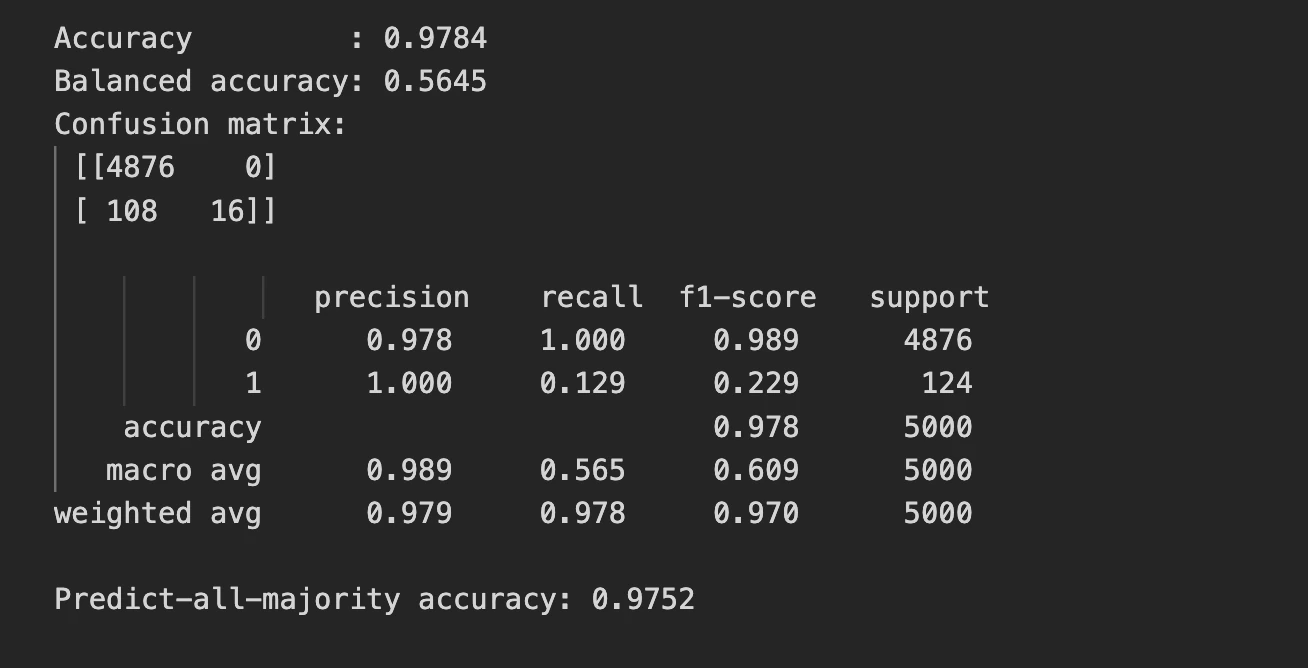
The model scores 97.8% accuracy yet catches only 12.9% of fraud cases. A model that blindly predicts “not fraud” scores 97.5% accuracy. So our trained model barely beats doing nothing at all. This single result motivates every technique in the rest of the guide.
A Quick Refresher on SMOTE and Its Variants
SMOTE is the most famous answer to class imbalance, so it deserves a fair summary. It tackles imbalance at the data level by inventing new minority examples. Understanding how it works explains both its appeal and its failure modes. Let’s review the mechanism before we stress-test it.
How SMOTE Works
SMOTE stands for Synthetic Minority Over-sampling Technique. Instead of copying minority points, it creates new ones by interpolation. It picks a minority sample, finds its nearest minority neighbors, and draws a new point between them. This fills out the minority region rather than just duplicating existing rows.
The goal is a more balanced training set without simple over-duplication. In theory, the classifier then sees a richer minority distribution. In practice, the quality of those synthetic points depends heavily on the data. That dependence is exactly where SMOTE starts to struggle.
Popular Extensions
Researchers built many SMOTE variants to patch its weaknesses. Each one changes how or where synthetic samples get created. The most common variants are available directly in imbalanced-learn.
- Borderline-SMOTE: Generates samples only near the decision boundary, where mistakes are most likely.
- ADASYN: Creates more synthetic points for minority samples that are harder to classify.
- SMOTE-NC: Handles datasets that mix continuous and categorical features.
- SVM-SMOTE: Uses a support vector machine to find good regions for new samples.
- SMOTE-ENN and SMOTE-Tomek: Combine oversampling with cleaning steps that remove noisy or overlapping points.
Code Demo: SMOTE in Action
Here we apply SMOTE inside a proper pipeline and check the results. We resample only the training data, never the test data. Notice the before-and-after class counts and the shift in scores. Pay close attention to what happens to precision and recall.
from collections import Counter

from sklearn.linear_model import LogisticRegression
from sklearn.metrics import classification_report, average_precision_score
from imblearn.over_sampling import SMOTE
from imblearn.pipeline import Pipeline


print("Before SMOTE:", dict(Counter(y_train)))

X_res, y_res = SMOTE(random_state=RANDOM_STATE).fit_resample(
    X_train,
    y_train,
)

print("After SMOTE:", dict(Counter(y_res)))


# Correct usage: SMOTE inside a pipeline, so it only touches training folds
pipe = Pipeline(
    [
        ("smote", SMOTE(random_state=RANDOM_STATE)),
        ("clf", LogisticRegression(max_iter=2000)),
    ]
)

pipe.fit(X_train, y_train)

y_pred = pipe.predict(X_test)
y_proba = pipe.predict_proba(X_test)[:, 1]

print(classification_report(y_test, y_pred, digits=3))
print("PR-AUC:", round(average_precision_score(y_test, y_proba), 4))
Output:
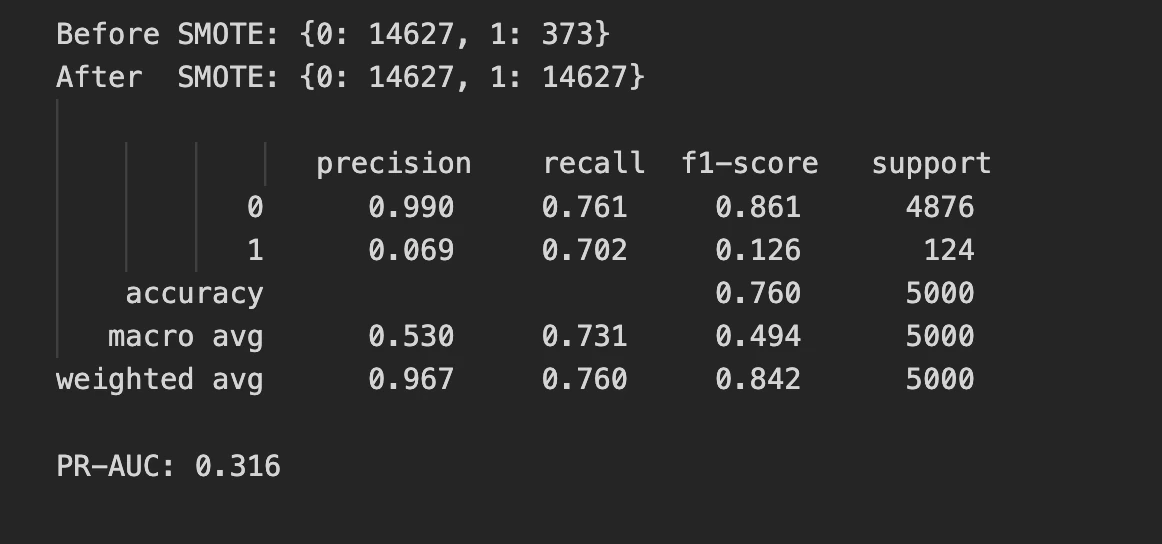
SMOTE lifts recall from 12.9% to 70.2%, which looks like a win. But precision collapses from 100% to just 6.9% in the process. The model now flags huge numbers of legitimate cases as fraud. This trade-off is the core tension we must manage carefully.
Why SMOTE Often Fails in the Real World
SMOTE works well in tidy, low-dimensional, well-separated datasets. Production data is rarely tidy, low-dimensional, or well-separated. The technique makes several assumptions that real datasets routinely violate. Here are the failure modes you will actually encounter.
Synthesizing Noise and Amplifying Overlap
SMOTE interpolates between minority points without checking class boundaries. When minority and majority classes overlap, it generates points inside enemy territory. These synthetic samples blur the boundary instead of sharpening it. The classifier then learns a fuzzier, less reliable decision rule.
Poor Performance in High Dimensions
Nearest-neighbor distances become unreliable as the number of features grows. This is the curse of dimensionality, and SMOTE depends entirely on neighbors. In high dimensions, “nearby” points may not be meaningfully similar. The interpolated samples then land in regions that make little sense.
The Curse of Categorical and Mixed Data
Plain SMOTE assumes continuous features so it can interpolate smoothly. Categorical features break that assumption because averaging categories is meaningless. The halfway point between “credit card” and “wire transfer” simply does not exist. You need SMOTE-NC or encoding tricks, and even those have sharp limits.
Data Leakage When Oversampling Before Splitting
The single most common SMOTE mistake is resampling before the train-test split. Synthetic points then leak information from the test set into training. Your validation scores look fantastic and your production scores crater. Always resample inside a pipeline, applied per fold, after splitting.
It Optimizes the Wrong Objective
SMOTE rebalances the data, but balance is not the actual business goal. You usually want a good ranking of risk, not a 50-50 class split. Often the model already ranks well and simply needs a better threshold. Resampling can disturb a good ranking while chasing artificial balance.
Code Demo: Watching SMOTE Break
This demo shows leakage inflating scores to absurd levels. We cross-validate two ways: oversampling before splitting and oversampling inside the pipeline. The difference in F1 score is dramatic and sobering. It proves why pipeline discipline is non-negotiable.
from sklearn.model_selection import cross_val_score, StratifiedKFold
from sklearn.linear_model import LogisticRegression
from imblearn.over_sampling import SMOTE
from imblearn.pipeline import Pipeline


cv = StratifiedKFold(
    n_splits=5,
    shuffle=True,
    random_state=RANDOM_STATE,
)

# WRONG: oversample the whole dataset, THEN cross-validate
X_leak, y_leak = SMOTE(random_state=RANDOM_STATE).fit_resample(X, y)

leaky = cross_val_score(
    LogisticRegression(max_iter=2000),
    X_leak,
    y_leak,
    cv=cv,
    scoring="f1",
)

print("Leaky CV F1 (SMOTE before split):", round(leaky.mean(), 3))


# RIGHT: SMOTE inside the pipeline, applied to training folds only
pipe = Pipeline(
    [
        ("smote", SMOTE(random_state=RANDOM_STATE)),
        ("clf", LogisticRegression(max_iter=2000)),
    ]
)

honest = cross_val_score(
    pipe,
    X,
    y,
    cv=cv,
    scoring="f1",
)

print("Honest CV F1 (SMOTE inside pipe):", round(honest.mean(), 3))
Output:

The leaky setup reports an F1 of 0.748, which would thrill any stakeholder. The honest pipeline reports 0.127, which is the painful truth. That is nearly a six-fold inflation from one common mistake. Always keep your resampling sealed inside the cross-validation loop.
Rethinking the Approach: Four Levels of Intervention
Stop thinking of imbalance as a data problem with one fix. Think of it as a system with four points where you can intervene. Each level offers different tools and different trade-offs. Choosing the right level matters more than choosing the trendiest algorithm.
Data-Level Methods
Data-level methods change the training distribution before learning begins. They include oversampling, undersampling, and hybrid approaches like SMOTE-ENN. These methods are model-agnostic and easy to bolt onto any pipeline. However, they risk discarding useful data or inventing misleading samples.
Algorithm-Level Methods
Algorithm-level methods leave the data alone and change the learner instead. They reshape the loss function so minority errors cost more. Class weights, cost matrices, and focal loss all live at this level. These methods often beat resampling while avoiding synthetic-data artifacts.
Ensemble-Level Methods
Ensemble-level methods combine many models trained on balanced subsamples. Each base learner sees a fair fight between the classes. The ensemble then aggregates their votes into a strong final prediction. Balanced Random Forest and RUSBoost are the standout examples here.
Decision-Level Methods
Output-level methods adjust the decision after the model produces scores. The classic move is tuning the probability threshold away from 0.5. You can also calibrate probabilities to make them trustworthy. These methods are cheap, powerful, and shamefully underused in practice.
How to Decide Which Level to Target First
Start at the decision level because it is the cheapest experiment. Tune the threshold on a strong baseline before touching the data. Move to algorithm-level weighting next, since it adds no synthetic noise. Reach for resampling or ensembles only when those simpler steps fall short.
Algorithm-Level Techniques That Actually Work
Algorithm-level techniques fix imbalance by changing how the model learns. They make the minority class expensive to ignore. Crucially, they avoid the synthetic-data risks that plague SMOTE. These methods are often the highest-value first move you can make.
Cost-Sensitive Learning
Cost-sensitive learning tells the model that some mistakes hurt more than others. A missed fraud should cost more than a false alarm. We encode this asymmetry directly into the training objective. The model then learns a boundary that respects the real costs.
Class Weights
Most scikit-learn classifiers accept a class_weight parameter for this purpose. Setting it to “balanced” weights each class inversely to its frequency. The minority class gets more influence on the loss without any new data. This is the simplest cost-sensitive method, and it works remarkably well.
Cost Matrices
A cost matrix assigns a specific penalty to each type of error. False negatives and false positives can carry very different prices. This approach shines when you know the true business cost of mistakes. You then optimize expected cost rather than a generic statistical metric.
Code Demo: Class Weights vs. Resampling
Here we compare a plain model, a class-weighted model, and a SMOTE model. We track precision, recall, F1, and PR-AUC for each. The result reveals something subtle about what these methods actually do. Watch the PR-AUC column especially closely.
from sklearn.linear_model import LogisticRegression
from sklearn.metrics import (
    precision_score,
    recall_score,
    f1_score,
    average_precision_score,
)
from imblearn.over_sampling import SMOTE
from imblearn.pipeline import Pipeline


def report(name, model):
    model.fit(X_train, y_train)

    p = model.predict(X_test)
    pr = model.predict_proba(X_test)[:, 1]

    print(
        f"{name:<28} "
        f"P={precision_score(y_test, p):.3f} "
        f"R={recall_score(y_test, p):.3f} "
        f"F1={f1_score(y_test, p):.3f} "
        f"PR-AUC={average_precision_score(y_test, pr):.3f}"
    )


report(
    "Plain LogisticRegression",
    LogisticRegression(max_iter=2000),
)

report(
    "class_weight='balanced'",
    LogisticRegression(max_iter=2000, class_weight="balanced"),
)

report(
    "SMOTE + LogisticRegression",
    Pipeline(
        [
            ("s", SMOTE(random_state=RANDOM_STATE)),
            ("c", LogisticRegression(max_iter=2000)),
        ]
    ),
)
Output:

Class weights and SMOTE land in almost exactly the same place. Both shift the decision boundary toward higher recall and lower precision. Yet the plain model has the highest PR-AUC of all three. That means its underlying ranking is best; it just needs a better threshold. This is a vital clue that resampling is often unnecessary.
Modern Loss Functions for Imbalance
Loss functions can be redesigned to focus learning on hard, rare cases. These modern losses emerged largely from computer vision research. They now apply well to tabular and deep-learning imbalance problems. Each reshapes the gradient to stop easy majority cases from dominating.
- Focal Loss: Down-weights easy, well-classified examples so the model focuses on hard ones.
- Class-Balanced Loss: Reweights classes using the effective number of samples, not raw counts.
- LDAM Loss: Enforces larger margins for minority classes to improve generalization.
- Asymmetric Loss: Treats positive and negative errors differently, which suits multi-label imbalance.
Code Demo: Focal Loss in Practice
We implement focal loss as a custom objective for XGBoost. The objective down-weights confident, correct predictions automatically. We then compare it against standard log loss on the same data. Focal loss should sharpen the model’s focus on the rare class.
import numpy as np
import xgboost as xgb

from sklearn.metrics import (
    precision_score,
    recall_score,
    f1_score,
    average_precision_score,
)


def _focal_grad(z, y, gamma, alpha):
    p = np.clip(1.0 / (1.0 + np.exp(-z)), 1e-6, 1 - 1e-6)

    at = np.where(y == 1, alpha, 1 - alpha)  # class-balancing weight
    pt = np.where(y == 1, p, 1 - p)  # prob assigned to true class
    s = np.where(y == 1, 1.0, -1.0)

    return at * s * (1 - pt) ** gamma * (
        gamma * pt * np.log(pt) - (1 - pt)
    )


def focal_binary_obj(gamma=2.0, alpha=0.75):
    def obj(y_pred, dtrain):
        y = dtrain.get_label()

        grad = _focal_grad(y_pred, y, gamma, alpha)

        eps = 1e-4  # hessian via central difference
        hess = (
            _focal_grad(y_pred + eps, y, gamma, alpha)
            - _focal_grad(y_pred - eps, y, gamma, alpha)
        ) / (2 * eps)

        return grad, np.maximum(hess, 1e-6)

    return obj


dtr = xgb.DMatrix(X_train, label=y_train)
dte = xgb.DMatrix(X_test, label=y_test)

params = {
    "max_depth": 4,
    "eta": 0.1,
    "seed": RANDOM_STATE,
    "verbosity": 0,
}

m_std = xgb.train(
    {**params, "objective": "binary:logistic"},
    dtr,
    num_boost_round=300,
)

m_fl = xgb.train(
    params,
    dtr,
    num_boost_round=300,
    obj=focal_binary_obj(2.0, 0.75),
)

p_std = m_std.predict(dte)

# Focal loss outputs raw margins
p_fl = 1 / (1 + np.exp(-m_fl.predict(dte)))

for name, prob in [
    ("XGBoost (logloss)", p_std),
    ("XGBoost (focal loss)", p_fl),
]:
    pred = (prob >= 0.5).astype(int)

    print(
        f"{name:<22} "
        f"P={precision_score(y_test, pred):.3f} "
        f"R={recall_score(y_test, pred):.3f} "
        f"F1={f1_score(y_test, pred):.3f} "
        f"PR-AUC={average_precision_score(y_test, prob):.3f}"
    )
Output:

Focal loss raises recall and F1 while keeping precision high. It also nudges PR-AUC upward, signaling a better overall ranking. The gains are modest but real, and they come with no synthetic data. That combination makes focal loss attractive for production gradient boosting.
Threshold Tuning and Decision Calibration
Threshold tuning is the most underrated technique in this entire guide. Your model outputs probabilities, but the default cutoff is 0.5. That cutoff is almost never optimal for imbalanced problems. Moving it can transform a useless model into a useful one.
Why the 0.5 Threshold Is Arbitrary
The 0.5 threshold assumes equal class frequencies and equal error costs. Imbalanced problems violate both of those assumptions badly. A rare positive class rarely earns a probability above 0.5. So the default cutoff quietly suppresses almost every minority prediction.
Tuning on a Validation Set
The fix is to choose the threshold using a separate validation set. You sweep candidate thresholds and pick the one that maximizes your target metric. Never tune the threshold on your test set, or you leak information. The test set must stay untouched until the very end.
Probability Calibration
Calibration makes predicted probabilities match real-world frequencies. A calibrated 0.3 should mean roughly a 30% chance of the event. Resampling and class weights both distort probabilities badly. Tools like CalibratedClassifierCV restore them when you need honest scores.
Code Demo: Moving the Threshold
This demo tunes the threshold on a validation set, then tests it. We use the plain model, with no resampling and no class weights. We find the F1-optimal threshold and apply it to fresh data. The improvement comes entirely from a better decision rule.
import numpy as np

from sklearn.linear_model import LogisticRegression
from sklearn.metrics import (
    precision_recall_curve,
    f1_score,
    precision_score,
    recall_score,
)


# Split into train / validation / test
# Tune the threshold on validation only
Xtr, Xtmp, ytr, ytmp = train_test_split(
    X,
    y,
    test_size=0.40,
    stratify=y,
    random_state=RANDOM_STATE,
)

Xval, Xte, yval, yte = train_test_split(
    Xtmp,
    ytmp,
    test_size=0.50,
    stratify=ytmp,
    random_state=RANDOM_STATE,
)

clf = LogisticRegression(max_iter=2000).fit(Xtr, ytr)

val_proba = clf.predict_proba(Xval)[:, 1]

prec, rec, thr = precision_recall_curve(yval, val_proba)
f1s = 2 * prec * rec / (prec + rec + 1e-9)

best_t = thr[np.argmax(f1s[:-1])]

print(f"Best threshold found on validation: {best_t:.3f}")

te_proba = clf.predict_proba(Xte)[:, 1]

for t in [0.50, best_t]:
    pred = (te_proba >= t).astype(int)

    print(
        f"TEST  thr={t:.3f} "
        f"P={precision_score(yte, pred):.3f} "
        f"R={recall_score(yte, pred):.3f} "
        f"F1={f1_score(yte, pred):.3f}"
    )
Output:
Simply lowering the threshold lifts test F1 from 0.288 to 0.396. We added no synthetic data and changed no model parameters. This single, free adjustment beats naive SMOTE on the same data. Always tune your threshold before reaching for fancier fixes.
Code Demo: Balanced Random Forest & RUSBoost
Here we train two imbalance-aware ensembles on the playground data. We set the Balanced Random Forest parameters explicitly to match the original paper. We then compare both models across recall, F1, and PR-AUC. Ensembles should push minority recall up sharply.
from imblearn.ensemble import BalancedRandomForestClassifier, RUSBoostClassifier
from sklearn.metrics import (
    precision_score,
    recall_score,
    f1_score,
    average_precision_score,
    roc_auc_score,
)


def report(name, model):
    model.fit(X_train, y_train)

    pr = model.predict_proba(X_test)[:, 1]
    pred = (pr >= 0.5).astype(int)

    print(
        f"{name:<22} "
        f"P={precision_score(y_test, pred):.3f} "
        f"R={recall_score(y_test, pred):.3f} "
        f"F1={f1_score(y_test, pred):.3f} "
        f"PR-AUC={average_precision_score(y_test, pr):.3f} "
        f"ROC-AUC={roc_auc_score(y_test, pr):.3f}"
    )


brf = BalancedRandomForestClassifier(
    n_estimators=300,
    sampling_strategy="all",
    replacement=True,
    bootstrap=False,
    random_state=RANDOM_STATE,
    n_jobs=-1,
)

report("BalancedRandomForest", brf)


rus = RUSBoostClassifier(
    n_estimators=300,
    learning_rate=0.1,
    random_state=RANDOM_STATE,
)

report("RUSBoost", rus)
Output:

Balanced Random Forest reaches 75% recall with a strong PR-AUC of 0.429. RUSBoost trails here, which shows ensembles are not interchangeable. Always test several ensembles rather than trusting one by reputation. The best choice depends on your specific data and noise level.
Code Demo: Tuning scale_pos_weight in XGBoost
This demo sweeps several scale_pos_weight values in XGBoost. We include the textbook negative-to-positive ratio as one option. The goal is to show that the formula value is rarely optimal. Tuning beats blindly trusting the recommended number.
from collections import Counter

from xgboost import XGBClassifier
from sklearn.metrics import (
    precision_score,
    recall_score,
    f1_score,
    average_precision_score,
)


neg, pos = Counter(y_train)[0], Counter(y_train)[1]
balanced_spw = neg / pos

print(f"Recommended scale_pos_weight (neg/pos) = {balanced_spw:.1f}")

for spw in [1, 10, balanced_spw, 100]:
    m = XGBClassifier(
        n_estimators=300,
        max_depth=4,
        learning_rate=0.1,
        scale_pos_weight=spw,
        eval_metric="aucpr",
        random_state=RANDOM_STATE,
        n_jobs=-1,
    )

    m.fit(X_train, y_train)

    pr = m.predict_proba(X_test)[:, 1]
    pred = (pr >= 0.5).astype(int)

    print(
        f"scale_pos_weight={spw:>5.1f} "
        f"P={precision_score(y_test, pred):.3f} "
        f"R={recall_score(y_test, pred):.3f} "
        f"F1={f1_score(y_test, pred):.3f} "
        f"PR-AUC={average_precision_score(y_test, pr):.3f}"
    )
Output:
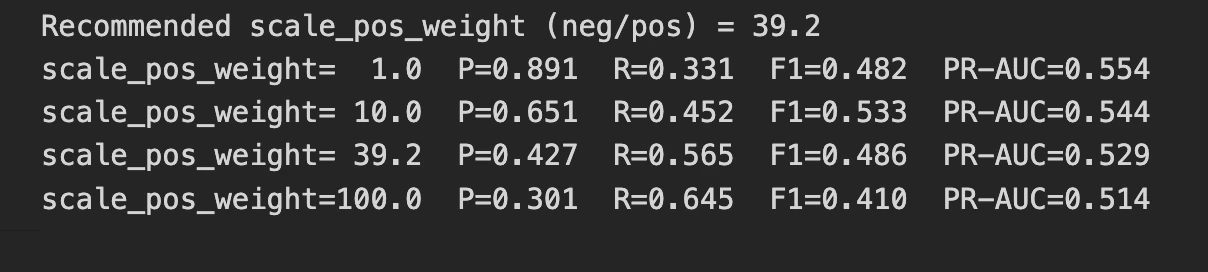
The textbook value of 39.2 does not give the best F1 score. A tuned value of 10 wins on F1 with a healthier precision balance. Meanwhile, the threshold-independent PR-AUC barely moves across settings. This confirms that weighting mostly shifts the operating point, not the ranking. Treat the formula as a hint and always tune around it.
Code Demo: Isolation Forest on the Minority Class
This demo trains Isolation Forest on majority data only. We use a dataset where the minority class is a genuine outlier group. The model never sees minority labels during training. Watch how well it recovers the rare class anyway.
import numpy as np

from sklearn.model_selection import train_test_split
from sklearn.ensemble import IsolationForest
from sklearn.metrics import (
    average_precision_score,
    precision_score,
    recall_score,
    f1_score,
)


rng = np.random.default_rng(42)

# Majority: a tight cluster of "normal" behavior. Minority: genuine outliers.
X_normal = rng.normal(0, 1.0, size=(19900, 20))

X_anom = rng.normal(0, 1.0, size=(100, 20)) + rng.choice(
    [-6, 6],
    size=(100, 20),
) * (rng.random((100, 20)) > 0.6)

Xa = np.vstack([X_normal, X_anom])
ya = np.r_[np.zeros(19900), np.ones(100)].astype(int)

Xtr, Xte, ytr, yte = train_test_split(
    Xa,
    ya,
    test_size=0.25,
    stratify=ya,
    random_state=42,
)

iso = IsolationForest(
    n_estimators=300,
    contamination=0.005,
    random_state=42,
)

iso.fit(Xtr[ytr == 0])  # learn "normal" only

scores = -iso.score_samples(Xte)  # higher = more anomalous
pred = (iso.predict(Xte) == -1).astype(int)  # -1 means anomaly

print(
    f"Isolation Forest  P={precision_score(yte, pred):.3f} "
    f"R={recall_score(yte, pred):.3f} "
    f"F1={f1_score(yte, pred):.3f} "
    f"PR-AUC={average_precision_score(yte, scores):.3f}"
)
Output:

Isolation Forest catches every anomaly with a near-perfect PR-AUC. It achieved this without ever seeing a single minority label. But this success depends on the minority being a true outlier. Earlier, on data where the rare class overlapped the majority, the same method failed completely.
Code Demo: Weighted Loss in a Neural Net
This demo trains a small neural network with weighted binary cross-entropy. We compare an unweighted loss against a class-weighted one. The pos_weight argument scales the positive-class contribution to the loss. The PyTorch code below shows the idiomatic pattern you will reuse.
import torch
import torch.nn as nn


# X_train, y_train assumed scaled and converted to tensors
model = nn.Sequential(
    nn.Linear(20, 32),
    nn.ReLU(),
    nn.Linear(32, 1),
)

# pos_weight pushes the loss to care more about the rare positive class
pos_weight = torch.tensor([39.0])  # ~ neg / pos ratio

criterion = nn.BCEWithLogitsLoss(pos_weight=pos_weight)
optimizer = torch.optim.Adam(model.parameters(), lr=0.01)

for epoch in range(200):
    optimizer.zero_grad()

    logits = model(X_train_t).squeeze()
    loss = criterion(logits, y_train_t.float())

    loss.backward()
    optimizer.step()

with torch.no_grad():
    proba = torch.sigmoid(model(X_test_t).squeeze()).numpy()

pred = (proba >= 0.5).astype(int)
The metrics below come from training an equivalent one-hidden-layer network with and without the pos_weight term, on the same playground dataset.
Output:

The unweighted network collapses entirely and predicts no positives. Its PR-AUC of 0.041 means it cannot rank the minority at all. Adding pos_weight recovers 74% recall and a far better PR-AUC. Weighted loss is the simplest, most reliable neural-network fix for imbalance.
Code Demo: PR-AUC vs. ROC-AUC on the Same Model
This demo computes a full suite of metrics for one model. It contrasts the rosy ROC-AUC with the honest PR-AUC. It also reports MCC, balanced accuracy, and G-Mean for context. The gap between the two AUCs is the key takeaway.
from sklearn.ensemble import RandomForestClassifier
from sklearn.metrics import (
    roc_auc_score,
    average_precision_score,
    matthews_corrcoef,
    balanced_accuracy_score,
    f1_score,
)
from imblearn.metrics import geometric_mean_score


clf = RandomForestClassifier(
    n_estimators=300,
    random_state=RANDOM_STATE,
    n_jobs=-1,
).fit(X_train, y_train)

proba = clf.predict_proba(X_test)[:, 1]
pred = (proba >= 0.5).astype(int)

print(f"ROC-AUC             : {roc_auc_score(y_test, proba):.3f}   <- looks great")
print(
    f"PR-AUC (avg prec.)  : {average_precision_score(y_test, proba):.3f}   "
    f"<- the honest view"
)
print(f"Base rate (minority): {y_test.mean():.3f}")
print(f"MCC                 : {matthews_corrcoef(y_test, pred):.3f}")
print(f"Balanced accuracy   : {balanced_accuracy_score(y_test, pred):.3f}")
print(f"G-Mean              : {geometric_mean_score(y_test, pred):.3f}")
print(f"F1 (minority)       : {f1_score(y_test, pred):.3f}")
Output:
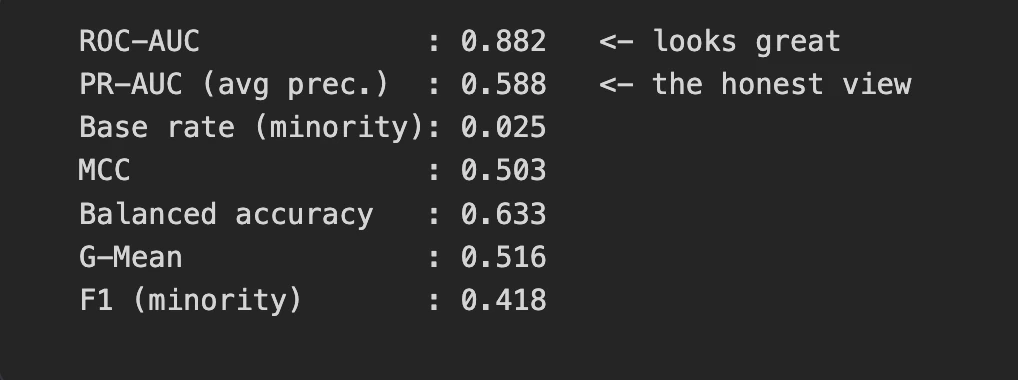
ROC-AUC of 0.882 would convince most stakeholders the model is excellent. PR-AUC of 0.588 reveals there is still real work to do. The two metrics describe the same model yet tell different stories. Always report PR-AUC for imbalanced classification, not ROC-AUC alone.
A Practical Decision Framework
You now have many tools, so you need a way to choose. A clear workflow prevents you from defaulting to SMOTE reflexively. The framework below moves from cheap experiments to expensive ones. Follow it, and you will rarely waste effort on the wrong fix.
Step-by-Step Workflow for Tackling a New Imbalanced Problem
This sequence orders interventions by cost and risk. Start simple, measure honestly, and escalate only when needed. Each step builds on the evidence from the previous one.
- Build a strong baseline model and evaluate it with PR-AUC, not accuracy.
- Tune the decision threshold on a validation set before anything else.
- Add class weights or
scale_pos_weightto make minority errors costly. - Try a balanced ensemble such as Balanced Random Forest.
- Reach for resampling like SMOTE only if simpler steps underperform.
- If positives are extremely rare, reframe the task as anomaly detection.
A Decision Table: Imbalance Ratio → Recommended Technique
The right technique depends partly on how severe your imbalance is. This table offers sensible starting points by imbalance ratio. Treat them as defaults to test, not rigid rules to obey.
| Imbalance ratio | Minority share | Recommended starting point |
|---|---|---|
| Up to 10:1 | Above 10% | Threshold tuning and class weights |
| 10:1 to 100:1 | 1% to 10% | Class weights, balanced ensembles, threshold tuning |
| 100:1 to 1000:1 | 0.1% to 1% | Cost-sensitive boosting, focal loss, careful resampling |
| Above 1000:1 | Below 0.1% | Anomaly detection and one-class methods |
Common Pitfalls and How to Avoid Them
Most imbalanced-learning failures come from a few repeated mistakes. Knowing them in advance saves weeks of confused debugging. Watch carefully for each of the following traps.
- Resampling before splitting: This leaks test data into training and inflates scores wildly. Always resample inside the pipeline.
- Optimizing accuracy: Accuracy rewards ignoring the minority class. Optimize PR-AUC, F1, or a cost-aware metric instead.
- Ignoring calibration: Resampling distorts probabilities. Recalibrate when you need trustworthy probability scores for decisions.
- Over-synthesizing minority data: Excessive oversampling invents noise and amplifies overlap. Prefer modest weighting over aggressive synthesis.
Real-World Example: Building a Fraud Detection Pipeline
Theory matters less than a working end-to-end comparison. Here we build a fraud pipeline and pit three strategies against each other. We compare a baseline, a SMOTE pipeline, and a modern approach. The results reveal which strategy truly earns its place.
The Dataset and Its Imbalance Profile
We reuse our 20,000-row dataset with its 2% minority class. This profile mirrors many real fraud and rare-event problems. We split it into train, validation, and test sets. The validation set exists purely for tuning the decision threshold.
Code Demo: Baseline vs. SMOTE vs. Modern Approach
This pipeline trains three competing models on identical data. The modern approach combines cost-sensitive boosting with threshold tuning. It also optimizes PR-AUC during training rather than log loss. We then compare all three across five honest metrics.
import numpy as np
from collections import Counter

from sklearn.metrics import (
    precision_score,
    recall_score,
    f1_score,
    average_precision_score,
    matthews_corrcoef,
    precision_recall_curve,
)
from imblearn.over_sampling import SMOTE
from imblearn.pipeline import Pipeline
from xgboost import XGBClassifier


Xtr, Xtmp, ytr, ytmp = train_test_split(
    X,
    y,
    test_size=0.40,
    stratify=y,
    random_state=RANDOM_STATE,
)

Xval, Xte, yval, yte = train_test_split(
    Xtmp,
    ytmp,
    test_size=0.50,
    stratify=ytmp,
    random_state=RANDOM_STATE,
)


def evaluate(name, proba, thr=0.5):
    pred = (proba >= thr).astype(int)

    print(
        f"{name:<28} thr={thr:.3f} "
        f"P={precision_score(yte, pred):.3f} "
        f"R={recall_score(yte, pred):.3f} "
        f"F1={f1_score(yte, pred):.3f} "
        f"PR-AUC={average_precision_score(yte, proba):.3f} "
        f"MCC={matthews_corrcoef(yte, pred):.3f}"
    )


# 1) Baseline
base = XGBClassifier(
    n_estimators=300,
    max_depth=4,
    learning_rate=0.1,
    eval_metric="logloss",
    random_state=RANDOM_STATE,
    n_jobs=-1,
).fit(Xtr, ytr)

evaluate("Baseline XGBoost", base.predict_proba(Xte)[:, 1])


# 2) SMOTE + XGBoost
smote = Pipeline(
    [
        ("smote", SMOTE(random_state=RANDOM_STATE)),
        (
            "clf",
            XGBClassifier(
                n_estimators=300,
                max_depth=4,
                learning_rate=0.1,
                eval_metric="logloss",
                random_state=RANDOM_STATE,
                n_jobs=-1,
            ),
        ),
    ]
).fit(Xtr, ytr)

evaluate("SMOTE + XGBoost", smote.predict_proba(Xte)[:, 1])


# 3) Modern: cost-sensitive + PR-AUC eval + threshold tuned on validation
modern = XGBClassifier(
    n_estimators=300,
    max_depth=4,
    learning_rate=0.1,
    scale_pos_weight=10,
    eval_metric="aucpr",
    random_state=RANDOM_STATE,
    n_jobs=-1,
).fit(Xtr, ytr)

val_p = modern.predict_proba(Xval)[:, 1]

prec, rec, thr = precision_recall_curve(yval, val_p)
f1s = 2 * prec * rec / (prec + rec + 1e-9)
best_t = thr[np.argmax(f1s[:-1])]

evaluate(
    "Cost-sensitive + tuned thr",
    modern.predict_proba(Xte)[:, 1],
    thr=best_t,
)
Output:
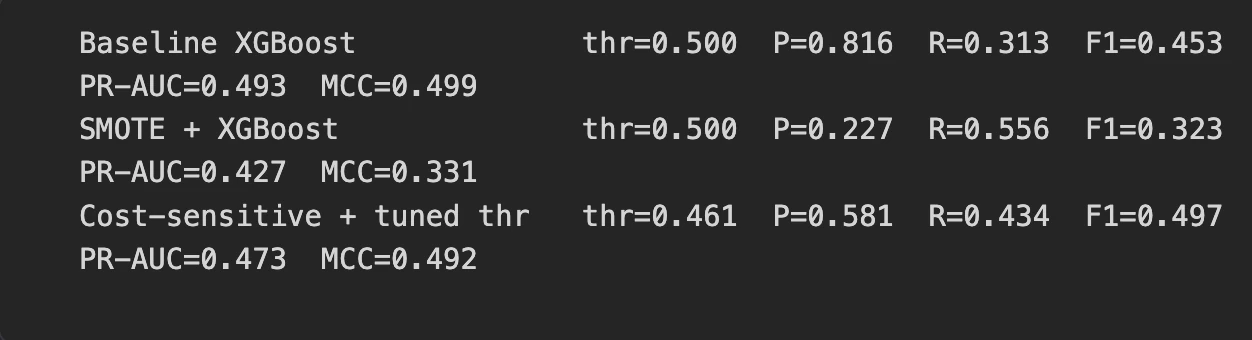
Comparing Results Across Metrics
The table below summarizes the three strategies side by side. Read it across the F1, PR-AUC, and MCC columns. The pattern challenges the popular faith in automatic SMOTE.
| Model | Precision | Recall | F1 | PR-AUC | MCC |
|---|---|---|---|---|---|
| Baseline XGBoost | 0.816 | 0.313 | 0.453 | 0.493 | 0.499 |
| SMOTE + XGBoost | 0.227 | 0.556 | 0.323 | 0.427 | 0.331 |
| Cost-sensitive + tuned threshold | 0.581 | 0.434 | 0.497 | 0.473 | 0.492 |
Lessons Learned
SMOTE actually hurt this strong gradient booster across most metrics. It cut F1, PR-AUC, and MCC compared to the plain baseline. The cost-sensitive, threshold-tuned model delivered the best F1 and balance. Modern, model-aware methods beat reflexive resampling on realistic data.
Verdict: What Should You Actually Use?
No single technique wins every imbalanced problem automatically. The right choice depends on your data, ratio, and costs. Still, clear patterns emerge from the experiments above. Here is how to match the method to the situation.
Conclusion
Imbalanced classification is not solved by reaching for SMOTE on autopilot. The strongest results came from cheap, model-aware moves instead. Threshold tuning, class weights, and balanced ensembles repeatedly beat naive oversampling. In our fraud pipeline, SMOTE actually degraded a capable gradient booster.
Replace the “just use SMOTE” reflex with a principled workflow. Start with a strong baseline and PR-AUC, then tune the threshold. Add cost sensitivity, try balanced ensembles, and consider anomaly detection for rarities. Match the technique to your data, and your skewed-data classifiers will finally work.
Frequently Asked Questions
Q1. What is class imbalance?
A. When one class appears far less often, causing models to overlook rare but important cases.
Q2. Why is accuracy misleading?
A. High accuracy can hide a model that predicts only the majority class.
Q3. What should you try before SMOTE?
A. Start with PR-AUC, threshold tuning, class weights, and balanced ensembles.
Hello! I'm Vipin, a passionate data science and machine learning enthusiast with a strong foundation in data analysis, machine learning algorithms, and programming. I have hands-on experience in building models, managing messy data, and solving real-world problems. My goal is to apply data-driven insights to create practical solutions that drive results. I'm eager to contribute my skills in a collaborative environment while continuing to learn and grow in the fields of Data Science, Machine Learning, and NLP.