This article was published as a part of the Data Science Blogathon.
Once upon a time, there was an individual trader named Anand. He was a novice in the finance industry, and like many traders, he struggled to find a consistent and profitable trading strategy. Anand was determined to improve his skills and searched for new techniques to help him make better investment decisions.
One fine day, while browsing the Instagram reels, he came across a reel about the benefits of Exploratory Data Analysis (EDA) in the finance industry. Intrigued, he began researching EDA and how it could be applied to his trading.
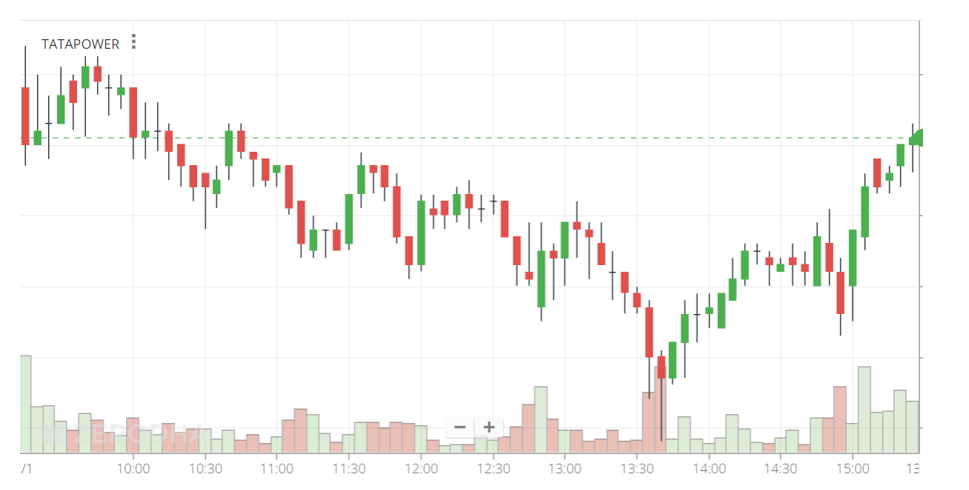
Anand knew that to be successful in trading or investing; he needed to have a deep understanding of the market and the stocks. He gathered and analyzed data on his target stocks, using various data visualization techniques such as line charts, scatter plots, and bar plots to understand their historical performance.
As he delved deeper into the data, Anand discovered something unexpected. He found that the stocks he was interested in strongly correlated with certain macroeconomic indicators such as GDP, inflation rate, investor activity, etc. This realization sparked his curiosity, and he decided to investigate further.
He began to use EDA to gather and analyze data on macroeconomic indicators and their relationship to the stock market. Using this approach, Anand was able to identify market trends and make more informed investment decisions.
Excited by his newfound understanding, Anand began incorporating macroeconomic analysis into his trading strategy. With his new strategy in place, he could make more profitable trades, and his portfolio began to grow.
This story illustrates how EDA can be beneficial for individual traders; by providing a deeper understanding of the market and how macroeconomic indicators and stock performance are related, traders can make more informed investment decisions that can lead to better returns. EDA continues to be an important tool in the arsenal of individual traders or investors, allowing them to stay ahead in the market.
So, the question is, What is EDA?
There are several important parts of data science/analytics projects, but some key ones include:

Exploratory Data Analysis (EDA) typically comes after acquiring and cleaning the data and before choosing and training a model. It is an essential step in understanding the characteristics of the data, discovering patterns, and identifying potential issues
Exploratory Data Analysis (EDA) is an approach to analyzing and summarizing datasets, aiming to identify patterns, outliers, and other exciting data features. EDA typically involves a combination of visual and numerical techniques, such as plotting, summary statistics, and data cleaning. The main goal of EDA is to uncover insights and generate hypotheses about the data.
During EDA, a data analyst/scientist will typically use various techniques, such as visualizations and statistical summaries, to explore the data. The goal is to gain a deeper understanding of the data’s underlying structure and identify any peculiarities or patterns that may be important for subsequent analysis.
This understanding allows the data scientist to make better decisions about preprocessing the data, which features to use in the model, and which algorithms are most likely to perform well. It also enables the data scientist to identify potential issues with the data, such as outliers, missing values, or errors, that need to be addressed before training a model.
There are so many ways an investor or trader can use EDA, but some unique ways are:-
Here is a step-by-step process on how a trader or investor can use EDA:
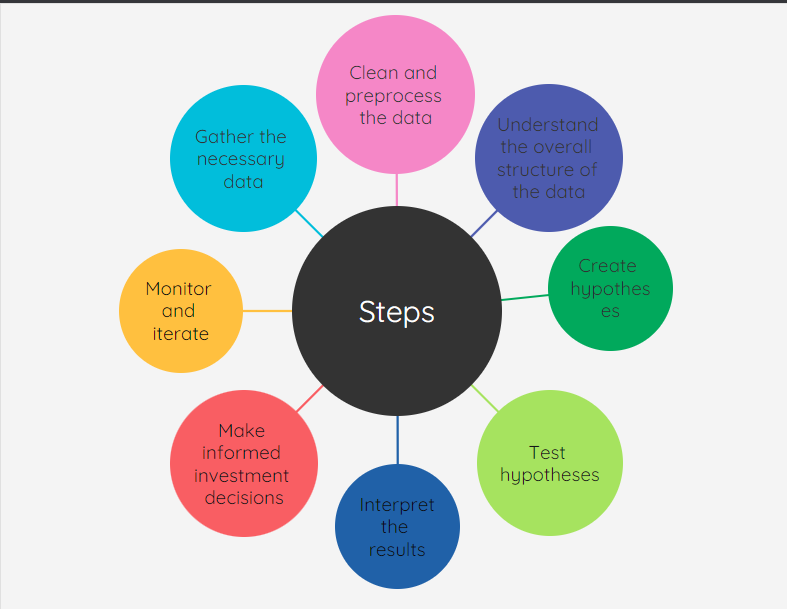
1. Gather the necessary data: Collect the relevant data to the investment decisions you are trying to make. This can include financial statements, stock prices, market data, economic indicators, and other relevant information.
2. Clean and preprocess the data: Ensure that the data is clean and in a format that can be easily analyzed. This may involve removing missing values, handling outliers, and standardizing the data.
3. Understand the overall structure of the data: Use visualization techniques such as histograms, scatter plots, and box plots to get a sense of the overall distribution of the data. This will help you to identify any unusual values or patterns in the data.
4. Create hypotheses: Based on the initial analysis of the data, formulate hypotheses about the relationships between the variables and the potential causes of any patterns you have identified.
5. Test hypotheses: Use statistical techniques to test your hypotheses and determine their validity. This may involve calculating correlation coefficients, conducting t-tests, or using other statistical methods.
6. Interpret the results: Use the results of your analysis to interpret the relationships and patterns that you have identified. This can help you understand the patterns’ underlying causes and identify potential investment opportunities.
7. Make informed investment decisions: Based on your analysis, make informed investment decisions. This can include buying or selling stocks, creating a diversified portfolio, or making other investment decisions.
8. Monitor and iterate: Continuously monitor your investments and repeat the EDA process to identify new patterns and relationships. This will allow you to make adjustments to your investment strategy as needed.
Several Python libraries can be used to perform exploratory data analysis (EDA) on the Indian stock market. Some popular options include:
1. Pandas: A powerful data manipulation and analysis library that can load, clean, and manipulate stock market data.
2. Numpy: A library for working with arrays and numerical operations. It can be used in conjunction with Pandas to perform numerical computations on stock market data.
3. Matplotlib: A plotting library that can be used to create visualizations of stock market data, such as line charts, scatter plots, and histograms.
4. Seaborn: A data visualization library built on top of Matplotlib that provides an easy-to-use interface for creating visually appealing plots.
5. yfinance: A library to download financial market data from Yahoo Finance. This can be used to download stock market data from India as well as other global markets.
Here’s an example of how you can use the above-mentioned libraries to perform some basic EDA on Indian stock market data:
To install the necessary libraries
!pip install pandas
 !pip install numpy
 !pip install matplotlib
 !pip install seaborn
 !pip install yfinance
Import the libraries:
import pandas as pd
 import numpy as np
 import matplotlib.pyplot as plt
 import seaborn as sns
 import yfinance as yf
Download the historical stock data for a specific company listed on the Indian stock market using yfinance library:
# stock symbol for example
 symbol = 'RELIANCE.NS'
 # download the data
 data = yf.download(symbol, start='2010-01-01', end='2022-12-31')
Clean the data and perform basic calculations:
#drop unnecessary columns
 data.drop(['Open', 'High', 'Low','Volume','Dividend','Split'], axis=1, inplace=True)
 #rename the column
 data.rename(columns={'Adj Close':'Adj_Close'}, inplace=True)
 #calculate the daily returns
 data['returns'] = data['Adj_Close'].pct_change()
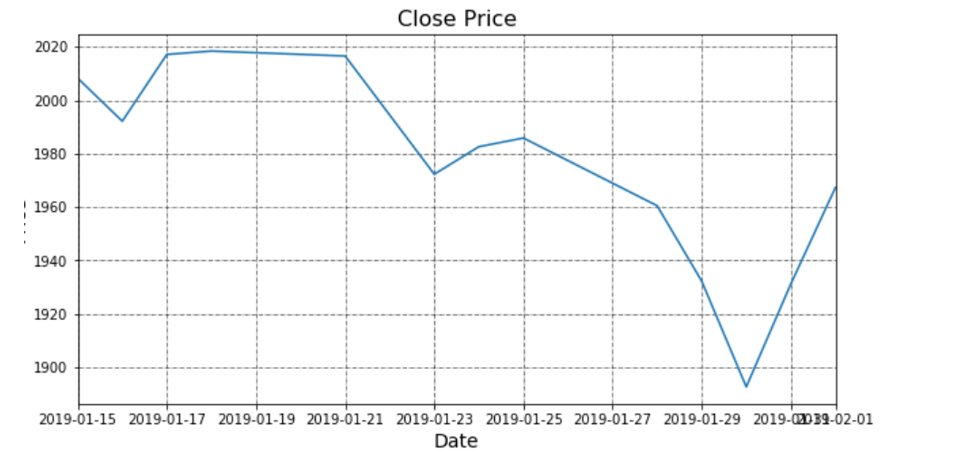
Perform visualization:
# plot the closing price
 plt.figure(figsize=(10,5))
 sns.lineplot(data=data, x='Date', y='Adj_Close')
 plt.title(f'{symbol} Closing Price')
 plt.show()
 # histogram of returns
 plt.figure(figsize=(10,5))
 sns.histplot(data=data, x='returns', binwidth=0.005)
 plt.title('Return Distribution')
 plt.xlabel('Returns')
 plt.show()
To summarize, exploratory Data Analysis (EDA) is a powerful tool that investors and traders can use to gain insights and make informed decisions. It allows them to analyze historical data and identify patterns and trends that can inform their trading and investment decisions. It also involves using a combination of visual and numerical techniques to explore and summarize datasets, with the goal of identifying patterns, outliers, and other interesting data features.
Overall, EDA is an essential tool for individual traders and investors looking to stay ahead in the market.
“I am wrapping up my blog. See you soon with another one!”
The media shown in this article is not owned by Analytics Vidhya and is used at the Author’s discretion.
Lorem ipsum dolor sit amet, consectetur adipiscing elit,


