Swarm architecture brings together specialized AI agents that collaborate to solve complex data problems. Inspired by natural swarms, it pairs a Data Analyst agent for processing with a Visualization agent for chart creation, coordinated to deliver clearer and more efficient insights.
This collaborative design mirrors teamwork, where each agent focuses on its strength to improve results. In this article, we explore swarm fundamentals and walk through designing and building a practical analytics agent system step by step.
Table of contents
What Are Swarm Agents?
Swarm agents function as self-operating AI entities who perform dedicated duties while working together according to defined procedures instead of using a central command system. The system uses this methodology to reproduce the swarm intelligence which exists in natural environments such as ant colonies and bird flocks.
Swarm agents use their incomplete information base to operate their system, which requires them to communicate with others in order to produce better results. The design process creates an efficient system which handles content and system errors while delivering high-quality results in data analysis and visualization tasks.
Core Principles of Swarm Agents
Swarm systems rely on some foundational principles that enable coordination without centralized intelligence. Understanding these principles helps you design robust agent architectures.
- Decentralized Decision Making
Agents operate independently without a single controlling authority. They share information and coordinate through communication, allowing flexible task distribution and faster decision making. - Role-Specialized Agents
Each agent focuses on a specific responsibility, such as data analysis or visualization. Clear role separation improves efficiency and ensures high-quality results. - Communication & Coordination Patterns
Agents coordinate through structured communication patterns like sequential or parallel workflows. Shared context or messaging keeps tasks aligned. - Fault Tolerance and Scalability
Workloads are distributed across agents, allowing the system to scale easily. If one agent fails, others continue operating without disruption.
Designing a Data Analyst & Data Visualization Swarm
Before coding, we design the system at a high level. The swarm will include at least two roles: a Data Analyst Agent, and a Data Visualization Agent. The coordinator directs queries to specialists and collects their outputs. Below is an overview of the architecture and data flow.
High-Level System Architecture
We implement our system through an orchestrator-worker framework. The user query first reaches the Lead agent. The agent divides the task into parts which it assigns to specialized agents.
The design resembles team formation because the coordinator functions as team lead who delegates tasks to specialists. Each agent has access to shared context (e.g. the query, previous results, etc.) which enables them to maintain a comprehensive understanding of the situation while they take their turn to solve the issue. The system architecture has the following appearance:
- Data Analyst Agent: Fetches and analyses raw data according to query.
- Data Visualization Agent: Receives analysis results and generates charts.
This modular setup can be extended with more agents if needed:
Agent Roles and Responsibilities
Data Analyst Agent
The Data Analyst Agent manages end-to-end data processing, including cleaning datasets, pulling data from sources like CSV files or databases, and running statistical analyses. It uses Python libraries and database tools to compute metrics and return clear numerical insights.
Its system prompt guides it to act as a data analysis expert, answering questions through structured computation. Using tools like statistical and regression functions, it extracts relevant patterns and summarizes results for downstream agents.
Data Visualization Agent
The Data Visualization Agent converts analysis results into clear visual charts such as bar, line, or pie graphs. It selects appropriate chart types to highlight patterns and comparisons in the data.
Guided by a prompt that frames it as a visualization expert, the agent uses plotting tools to generate charts from incoming results. It outputs visuals as embedded charts or image links that directly support the user’s query.
Orchestrator / Coordinator Agent
The Orchestrator Agent functions as the initial access point for users. The system processes user inquiries to choose which specific agents will assist with the task. Then, uses its handoff function to distribute its work tasks. It first analyses the user query through parsing before it determines which data analysis and visualization tasks require execution by the Data Analyst Agent.
Data Flow Between Agents
- User Query to Coordinator: The user submits a query (e.g. “What is the average sales per region and show it”). The coordinator agent takes this as input.
- Coordinator to Data Analyst: The coordinator uses a handoff tool to call the Data Analyst Agent, passing the query and any needed context (like a dataset reference).
- Data Analyst Processes Data: The Data Analyst Agent loads or queries the relevant data, performs computations (e.g. grouping by region, computing averages) and returns results (e.g. a table of averages).
- Coordinator to Visualization Agent: The coordinator now invokes the Data Visualization Agent, supplying it with the analysis results.
For Example: The Data Analyst completes its work by delivering results which are then added to shared context. The Visualization Agent uses this completed work to determine which data it should display. The system uses this handoff pattern because it enables agents to work through their specific tasks in an organized manner. The shared context object functions in code as a common state which agents use to transfer information during their function calls.
Implementing the Swarm Agent System
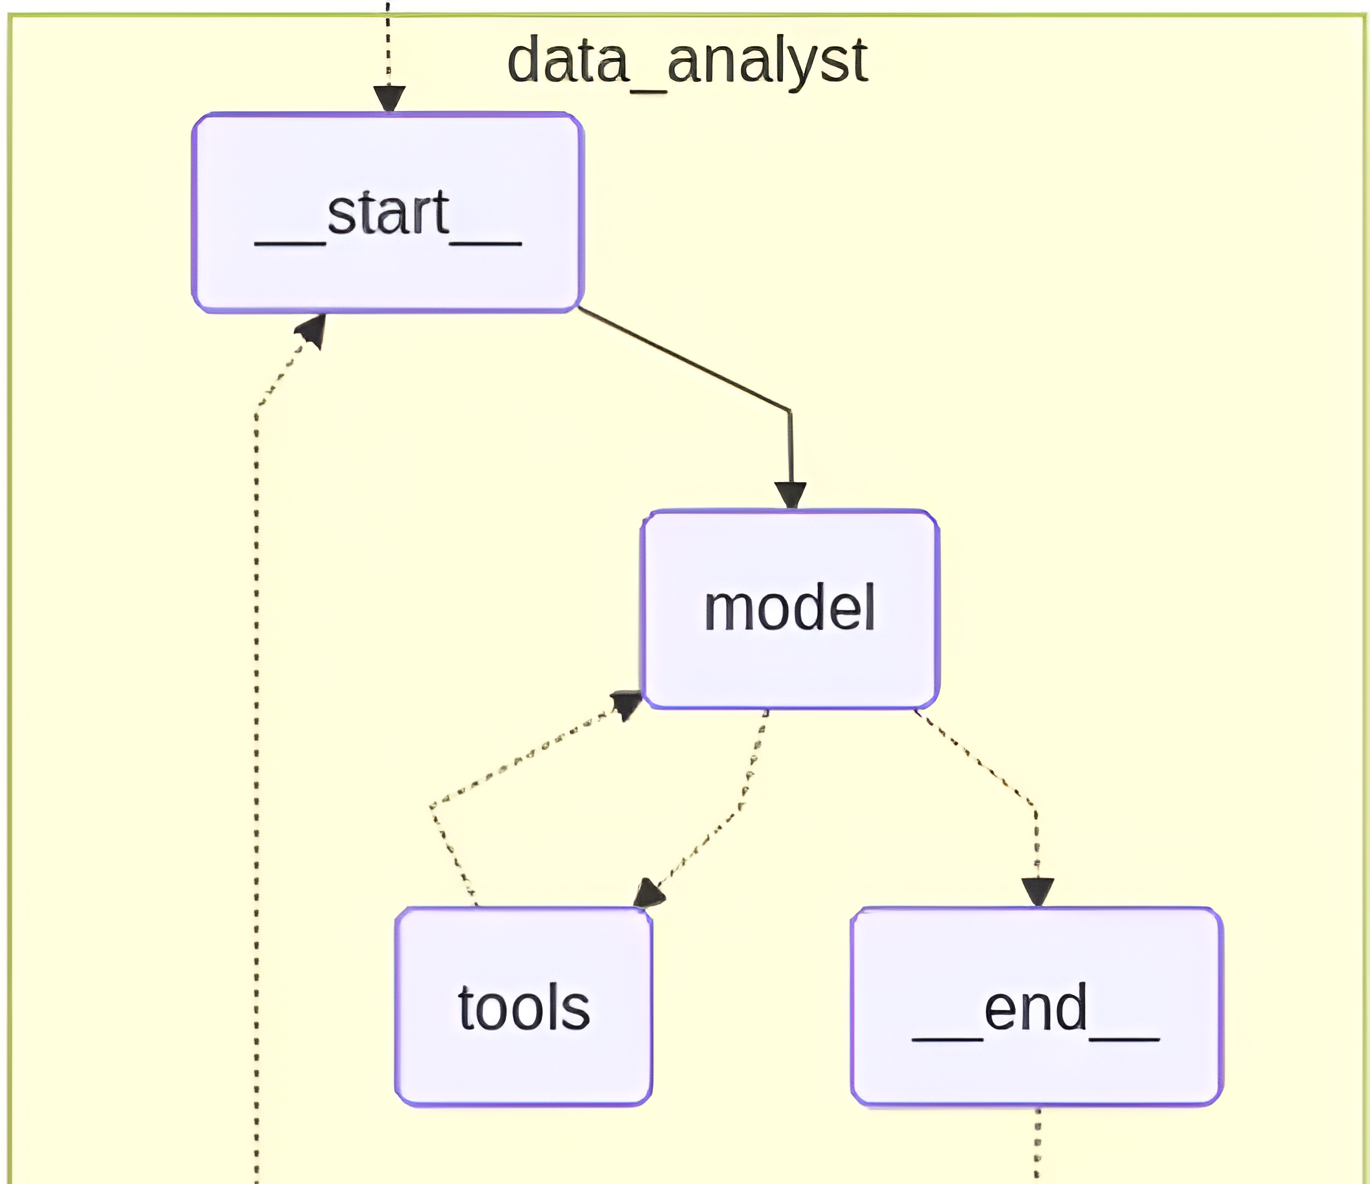
The team needs to carry out their implementation work using LangGraph Swarm based on its details which exist in the provided notebook.
The system operates through two agents which include a Text-to-SQL Data Analyst Agent and an EDA Visualization Agent who analyze a real banking database. The swarm allows agents to work together by using structured handoff methods which replace the need for prebuilt operational systems.
Environment Setup and Dependencies
We will begin the process by installing all necessary dependencies for our project. The project requires LangChain and LangGraph Swarm and OpenAI models together with standard data science libraries.
pip install langchain==1.2.4 \
           langgraph==1.0.6 \
           langgraph-swarm \
           langchain-openai==1.1.4 \
           langchain-community==0.4.1 \
           langchain-experimental==0.4.0
We also install SQLite since the system queries a local banking database.
apt-get install sqlite3 -y Once installed, we import the required modules for agent orchestration, SQL querying, and visualization.
from langchain_openai import ChatOpenAI
from langgraph_swarm import create_swarm, create_handoff_tool, SwarmState
from langgraph.checkpoint.memory import MemorySaver
from langchain_community.utilities import SQLDatabase
from langchain_community.agent_toolkits import SQLDatabaseToolkit
from langchain_experimental.utilities import PythonREPL
At this stage, we also initialize the LLM and database connection.
llm = ChatOpenAI(model="gpt-4.1-mini", temperature=0)
db = SQLDatabase.from_uri("sqlite:///banking_insights.db")
sql_toolkit = SQLDatabaseToolkit(db=db, llm=llm)
sql_tools = sql_toolkit.get_tools()
This gives our agents structured access to the database without writing raw SQL manually.
Defining Agent System Prompts
The LangGraph Swarm system uses prompts to dictate agent actions throughout its operational framework. Each agent has a very clear responsibility.
Data Analyst Agent Prompt
The Data Analyst agent transforms spoken questions into SQL queries which it uses to generate result summaries.
DATA_ANALYST_PROMPT = """

You are a Data Analyst specialized in SQL queries for retail banking analytics.

Your primary tasks:
- Convert user questions into correct SQL queries
- Retrieve accurate data from the database
- Provide concise, factual summaries
- Hand off results to the EDA Visualizer when visualization is needed
"""
This agent never plots charts. Its job is purely analytical.
EDA Visualizer Agent Prompt
The EDA Visualizer agent transforms query results into charts using Python.
EDA_VISUALIZER_PROMPT = """

You are an EDA Visualizer — an expert in data analysis and visualization.

Your responsibilities:
- Create clear and business-ready charts
- Use Python for plotting
- Return visual insights that support decision-making
"""
This separation ensures each agent stays focused and predictable.
Creating Handoff Tools Between Agents
Swarm agents communicate using handoff tools instead of direct calls. This is one of the key strengths of LangGraph Swarm.
handoff_to_eda = create_handoff_tool(
    agent_name="eda_visualizer",
    description="Transfer to the EDA Visualizer for charts and visual analysis",
)

handoff_to_analyst = create_handoff_tool(
    agent_name="data_analyst",
    description="Transfer back to the Data Analyst for additional SQL analysis",
)
These tools allow agents to decide when another agent should take over.
Creating the Agents
Now we create the actual agents using create_agent.
data_analyst_agent = create_agent(
   llm,
   tools=sql_tools + [handoff_to_eda],
   system_prompt=DATA_ANALYST_PROMPT,
   name="data_analyst"
)
The Data Analyst agent gets:
- SQL tools
- A handoff tool to the visualizer
eda_visualizer_agent = create_agent(
   llm,
   tools=[python_repl_tool, handoff_to_analyst],
   system_prompt=EDA_VISUALIZER_PROMPT,
   name="eda_visualizer"
)
The Visualizer agent gets:
- A Python REPL for plotting
- A handoff tool back to the analyst
This two-way handoff enables iterative reasoning.
Building the Swarm Graph
With agents ready, we now assemble them into a LangGraph Swarm.
workflow = create_swarm(
   agents=[data_analyst_agent, eda_visualizer_agent],
   default_active_agent="data_analyst",
   state_schema=SwarmState
)
The Data Analyst agent is set as the default entry point. This makes sense because every request starts with data understanding. We also enable memory so the swarm can retain conversational context.
checkpointer = MemorySaver()
swarm_graph = workflow.compile(checkpointer=checkpointer)
Execution Function
The following function acts as the public interface to the swarm.
def run_banking_analysis(query: str, thread_id: str = "default", verbose: bool = True):
    return swarm_graph.invoke(
        {"messages": [("user", query)]},
        config={"configurable": {"thread_id": thread_id}},
    )
Running the Swarm: End-to-End Example
Now, let’s walk through a real example to understand how the swarm behaves.
result4 = run_banking_analysis(
   "Start with customers grouped by state, then drill down into branches    within that state, and finally into account types under each branch —    showing the number of accounts at each level",
   thread_id="test4",
   verbose=True
)
Response:
======================================================================
SWARM ANALYSIS: 'Start with customers grouped by state, then drill down into branches within that state, and finally into account types under each branch — showing the number of accounts at each level'
======================================================================

USER: Start with customers grouped by state, then drill down into branches within that state, and finally into account types under each branch — showing the number of accounts at each level
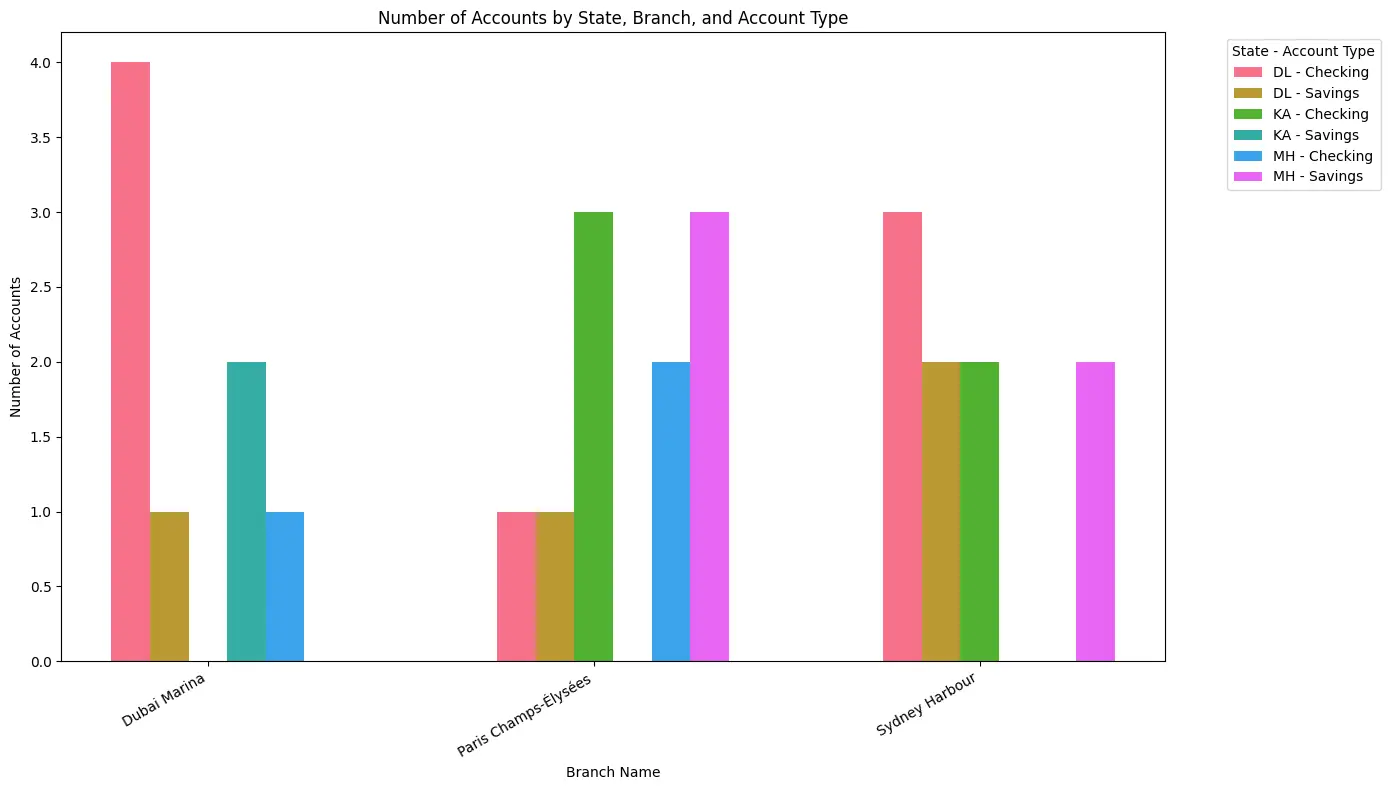
EDA VISUALIZER: I have created a grouped bar chart showing the number of accounts by customer state, branch, and account type. Each group of bars represents a branch, with bars colored and labeled by the combination of state and account type.

Insights:
- The Dubai Marina branch has a higher number of checking accounts in the DL state compared to savings accounts.
- Paris Champs-Élysées shows a balanced distribution of checking and savings accounts across states, with MH state having the highest savings accounts there.
- Sydney Harbour branch has a notable number of checking accounts in DL and KA states, while savings accounts are more prominent in MH and DL states.

This visualization helps identify which branches and states have more accounts by type, enabling targeted marketing or resource allocation for account management.

If you want, I can also prepare a hierarchical treemap or sunburst chart to better visualize the drill-down structure from state to branch to account type. Would you like me to do that? ======================================================================

EXECUTION COMPLETE (3 steps) ======================================================================
Read more: Build an Earnings Report Agent using Swarm Architecture
Conclusion
The combination of specialist agents enables us to create intelligent pipelines through swarm-based multi-agent systems. This guide demonstrates how to create a swarm system which includes a Data Analyst Agent and a Data Visualization Agent controlled by an orchestrator. Swarm agents provide organizations with two advantages because they enable teams to make decisions without any central control and they let team members take on distinct responsibilities which enables them to complete complex projects more efficiently and reliably.
The defined agent roles and communication patterns exist as coded elements which we implemented to develop a system that takes a user query and produces both analysis and visual output.
Frequently Asked Questions
Q1. What is a swarm architecture in AI?
A. It is a system where specialized AI agents collaborate, each handling tasks like analysis or visualization, to solve complex data problems efficiently.
Q2. What roles do the agents play in this swarm system?
A. The Data Analyst processes and analyzes data, while the Visualization Agent creates charts, coordinated by an orchestrator that manages task flow.
Q3. Why use swarm agents instead of a single AI agent?
A. Swarm agents improve scalability, fault tolerance, and task specialization, allowing complex workflows to run faster and more reliably.
Hello! I'm Vipin, a passionate data science and machine learning enthusiast with a strong foundation in data analysis, machine learning algorithms, and programming. I have hands-on experience in building models, managing messy data, and solving real-world problems. My goal is to apply data-driven insights to create practical solutions that drive results. I'm eager to contribute my skills in a collaborative environment while continuing to learn and grow in the fields of Data Science, Machine Learning, and NLP.


