Overview
- Google AI has launched the ‘What-If Tool’ to make machine learning experiments a code-free experience
- The tool is part of Google’s open-source Tensorboard web application
- There are plenty of features available, including automatic plot generation and watching changes in the model’s performance in real-time
Introduction
Building a machine learning model is not a one-step process. As a data scientist, you need to ask several questions during this process and perform multiple iterations before finalizing your model.
How much should you tune a hyperparameter? How is the accuracy going to be affected if you drop a variable? How diverse is the dataset? These are just some of the questions you should be asking during the model building process. But finding answers to these questions is no walk in the park, either. You need to perform experiments for each idea, and that means line upon line of code. Doesn’t sound like an efficient method, does it?
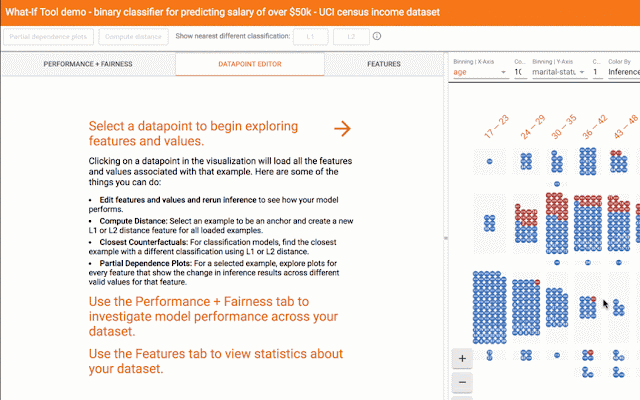
Google’s AI research team has designed a What-If Tool which is part of their open-source Tensorboard web application. The tool lets users analyze their machine learning models without the need of writing code. The UI is exemplary and offers a rich interactive interface for exploring different model results.
Source: Google AI blog
The tool has plenty of features packed in, including:
- The option to manually edit examples from your dataset and see the effects of those changes in real time
- Automatic plot generation which shows how the model’s results change when individual features are changed
- Visualizing your dataset automatically!
The code for What-If is open-source and available on GitHub. A few demo examples using pretrained models are available in the GitHub repository. These include detecting misclassification, analyzing a model’s performance across multiple subgroups, and assessing bias in binary classification models.
Intrigued? We are as well. The below video takes a few examples to explain how you can use the tool on your own machine:
Our take on this
I can see this becoming an integral part of most data science operations very soon (it’s already in full-fledged use at Google). One use case I can think of is ranking your models from worst to best performing as you tweak certain hyperparameters. The visual aspect certainly makes the case for using this tool even more appealing.
Where do you plan to use this tool? Let me know in the comments section below!
Subscribe to AVBytes here to get regular data science, machine learning and AI updates in your inbox!
Senior Editor at Analytics Vidhya.Data visualization practitioner who loves reading and delving deeper into the data science and machine learning arts. Always looking for new ways to improve processes using ML and AI.


Hi Pranav, thanks for the article here. So I was looking into how to put this into use, and realized that the models need to be only from tensorflow. ( Scikit models won't work ). Do you have any link to suggest where the integration between an existing tensorflow code and the visualization is explained.