-
Infographic: Must Read Books in Analytics / Data Science
Here is the infographic showing must read data science books in analytics, web analytics, data visualization books for all analytics readers and learners.
Analytics Vidhya 19 Jul, 2020
-
Use of variables in QlikView to create powerful data stories
Using variables in QlikView dashboard can help you deliver powerful applications with dynamic charts. Learn using qlikview variables to create data stories.
Sunil Ray 19 Jul, 2020
-
Data visualization guide for SAS
Simple data visualization guide for SAS beginners and learners. It includes various data visualisation methods, and application with implementation in SAS.
Shuvayan 19 Jul, 2020
-
All out beginner’s guide to MongoDB
MongoDB beginners guide to learn mongodb, its structural aspects like data model, sharding with comparison of database and steps for how to install mongodb.
Shuvayan 19 Jul, 2020
-
Why Business Intelligence Should Be a Piece of the Security Puzzle?
Security analytics and business intelligence tools have a major impact on securing data security in organization. These tools can predict attacks.
Guest Blog 16 Sep, 2015
-
Interview with Daniel Graham, General Manager, Teradata
This interview features Daniel Graham, talking about the product offerings of Teradata & how they have made use of technologies to stay ahead
Kunal Jain 24 Sep, 2015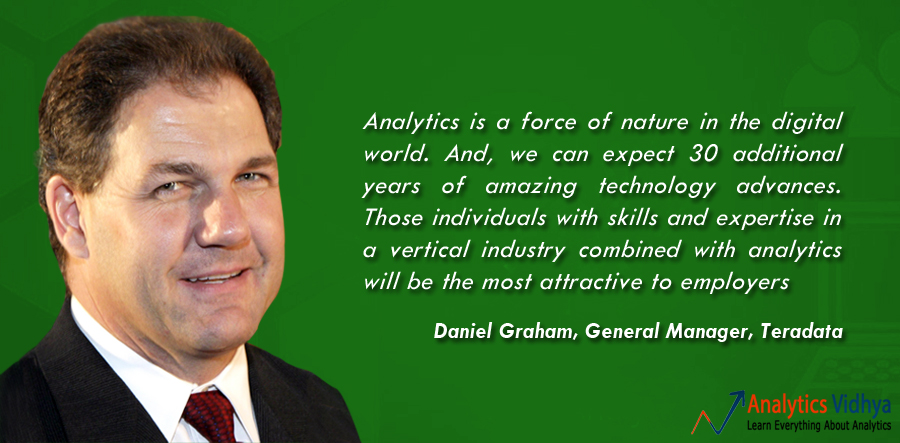
-
Ultimate resource for understanding & creating data visualization
Ultimate guide to create data visualization and resources for understanding various data visualization methods used in graphs, charts, heatmap, box plot etc
Sunil Ray 26 Jun, 2020
-
Effective data exploration / processing using FIRST. & LAST. in SAS PDV
Learn the use of First. and Last. variables in SAS for data processing using examples. These variables are formed in SAS PDV, when BY and SET are used together.
Guest Blog 19 Jul, 2020
-
Comprehensive guide for Data Exploration in SAS (using Data step and Proc SQL)
Data exploration in SAS is performed using the DATA step and PROC SQL. A complete guide to data exploration and data munging methods for preparation in SAS.
Sunil Ray 19 Jul, 2020
-
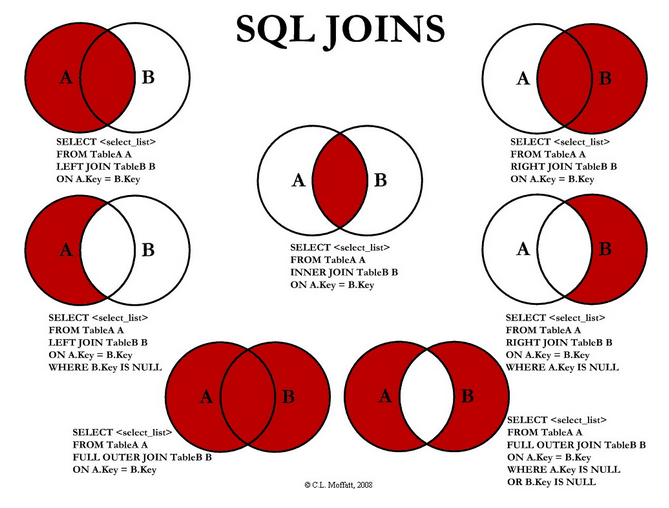
Basics of SQL and RDBMS – must have skills for data science professionals
SQL is a standard programming language used to retrieve, merge, extract data from RDBMS. This article SQL basics, SQL commands, uses of sql, CAP Theorem
Analytics Vidhya 19 Jul, 2020