-
The Ultimate Plan to Become a Data Scientist in 2016
Here's an infographic which shows yearly plan of 2016 to become a data scientist using a structured path and focus on analytics interview tips
Kunal Jain 31 Jan, 2017
-
Important Job Roles in Data Science Industry Today – Who Does What ?
Here is complete description of job roles in data science analytics industry with job skills, talent, roles & responsibility, salary globally
Guest Blog 23 May, 2018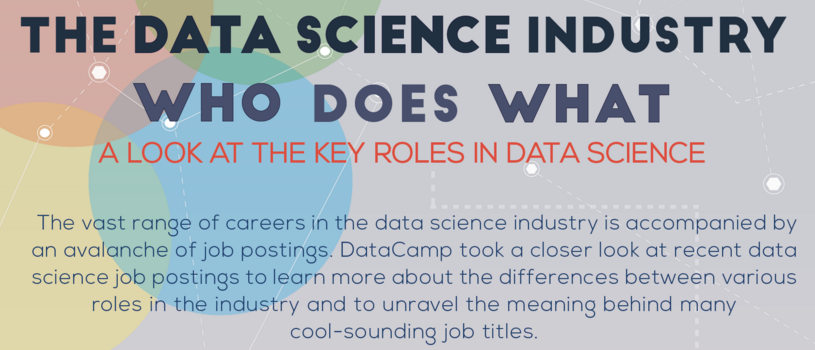
-
Job Comparison – Data Scientist vs Data Engineer vs Statistician
This infographic compares the hot jobs of global data science analytics industry with roles of Data Scientist vs data engineer vs statistician
Analytics Vidhya 24 Jun, 2019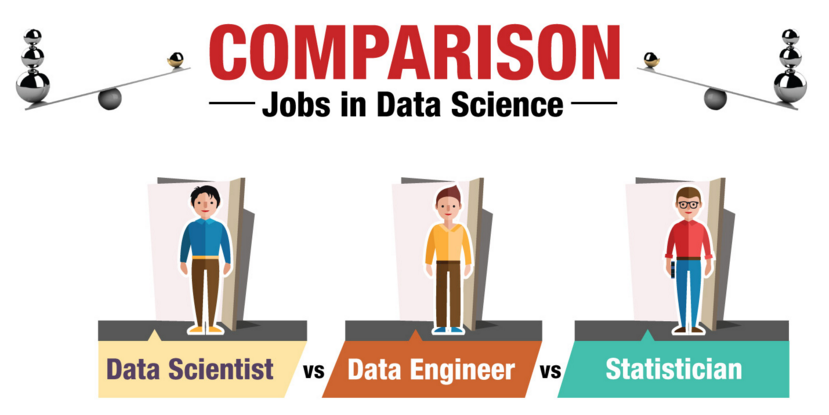
-
Cheatsheet – 11 Steps for Data Exploration in R (with codes)
This cheat sheet highlights the list of data exploration steps in R. Data Exploration is useful to extract hidden insights and trends in data
Analytics Vidhya 11 Dec, 2015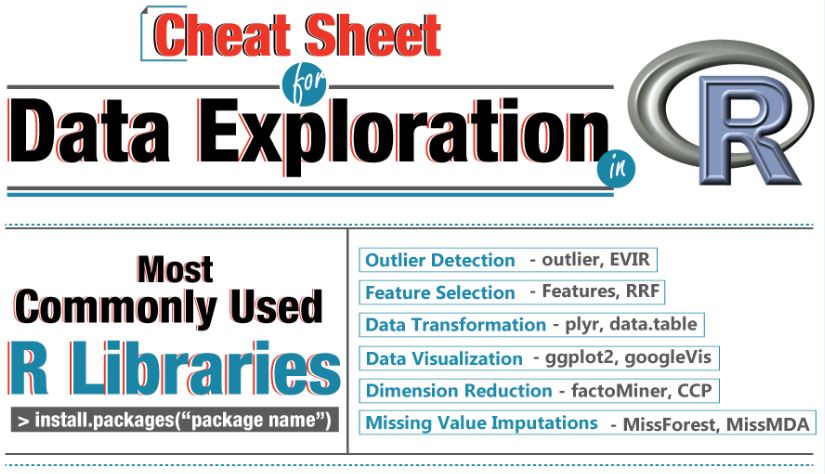
-
Cheatsheet – Python & R codes for common Machine Learning Algorithms
Python and R cheat sheets for machine learning algorithms. It contains codes on data science topics, decision trees, random forest, gradient boost, k means.
Analytics Vidhya 26 Jun, 2020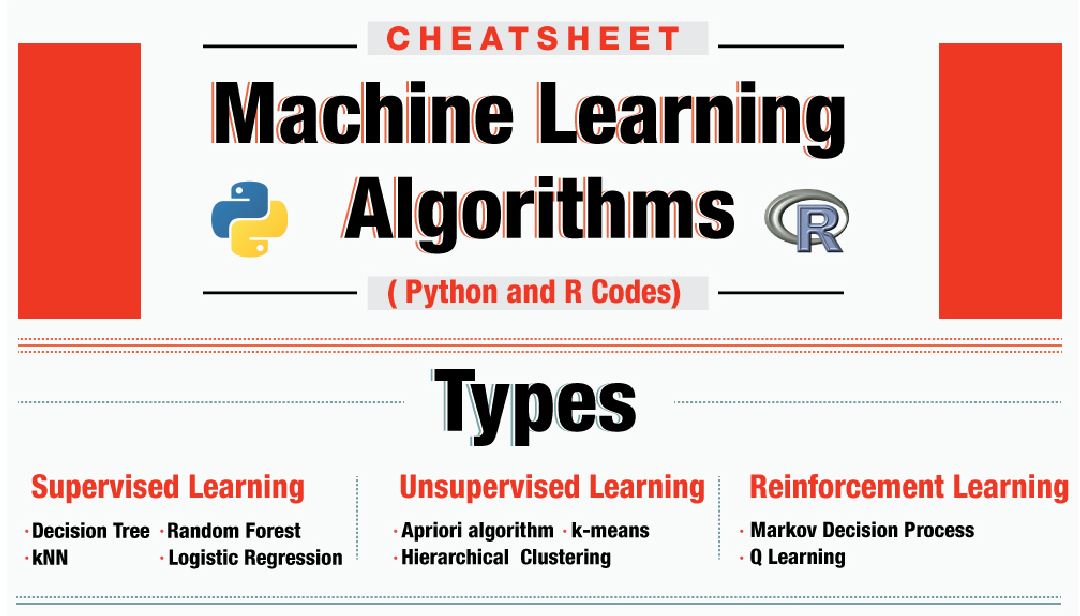
-
Infographic: Data Visualization Tools For Data scientists & analysts
Here's an infographic which displays most commonly used tools for data visualization by data scientists and data analysts for all sort of uses
Kunal Jain 11 Dec, 2015
-
R-analyst Cheat sheet: Data Visualization in R
Cheat sheet for creating data visualizations in R - Histogram, Bar Chart, Line chart, box plot, scatter plot, mosaic plot, heat map, correlogram
Sunil Ray 01 Aug, 2024
-
CheatSheet: Data Exploration using Pandas in Python
Pandas data exploration cheat sheet displays the codes used to perform data analysis in python using pandas to perform data exploration operations.
Kunal Jain 12 Jul, 2020
-
Simple infographic to help you compete in Data Science Competitions!
Data Science Competitions such as Kaggle competitions are illustrated with their difficulty level. Here are some useful tips to win them.
Kunal Jain 12 Jul, 2020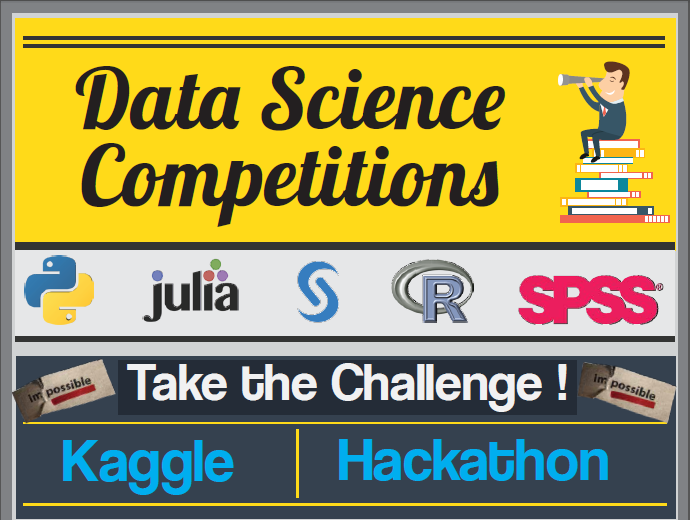
-
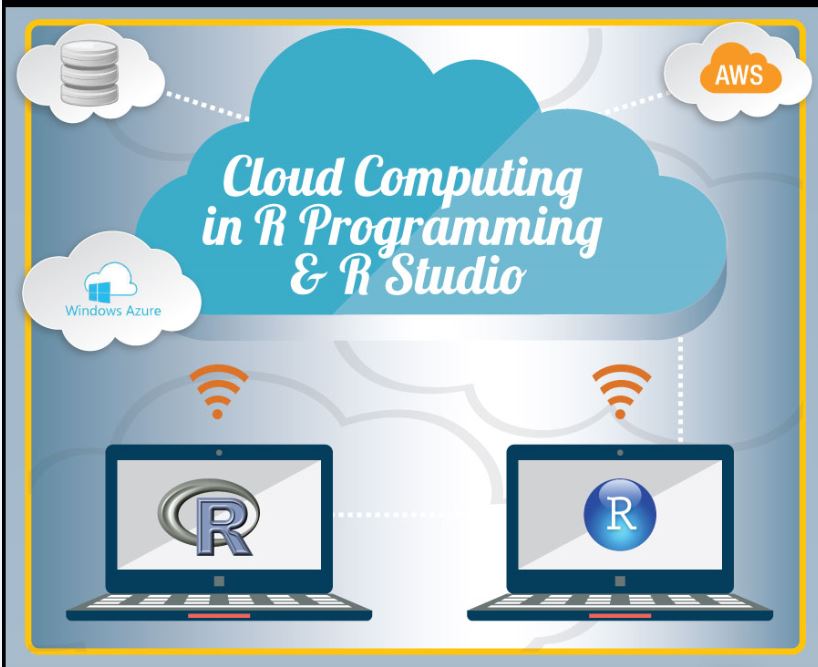
The guide to quickly learn Cloud Computing in R Programming
This infographic is a quick guide to learn cloud computing in r programming using aws server, other services. Benefits & future of cloud computing and best services
Analytics Vidhya 12 Jul, 2020