This article was published as a part of the Data Science Blogathon.
Overview
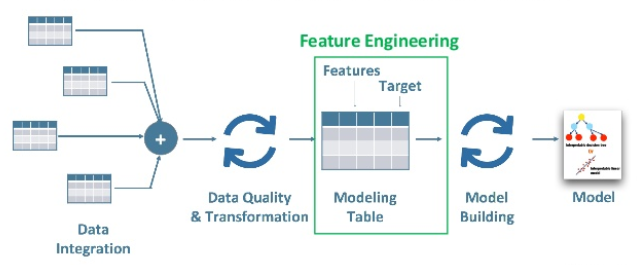
Machine learning algorithms take features of a dataset as input, determine patterns inside it, and create output. The performance of a model depends upon the different types of input variables that we pass to the build model.
Feature engineering is an essential part of building an intelligent system. Feature Engineering is an art as well as a science, this is the reason a typical data scientist spends 70 – 80% of his time cleaning and preparing the data which can improve model quality.
Peter Norvig, Google’s Research Director said “We don’t have better algorithms than anyone else, we just have more data.” (Source: Forbes)
Through this article, I hope that people can get an idea of different types of feature engineering techniques and can use these techniques to improve model performance.
Table of Content
- What is feature engineering?
- Binning
- Splitting feature
- Working with Time-Series data
- Creating a new feature by combining new feature
- Transformation to make data normally distributed
What is feature engineering?
The features you use influence more than everything else the result. No algorithm alone, to my knowledge, can supplement the information gain given by correct feature engineering.
— Luca Massaron
Feature engineering is a process of using domain knowledge to create/extract new features from a given dataset by using data mining techniques. It helps machine learning algorithms to understand data and determine patterns that can improve the performance of machine learning algorithms.
Steps to do feature engineering
- Brainstorm features.
- Create features.
- Check how the features work with the model.
- Start again from first until the features work perfectly
Creating new features are very much dependent on the underlying problem and feature present in raw data.
Better features result in faster training and more accurate predictions. Take, for example, an algorithm to predict the sales at a fashion store with time. The fashion sales peak during the winter especially around Christmas. Adding a feature that tells how many days we are away from Christmas gives the algorithm a lot more intuition than the date itself.
Binning
While working with numeric data we come across some features where distributions of variables are skewed in the sense that some sets of values will occur a lot and some will be very rare. Directly using this type of feature may cause issues or can give inaccurate results.

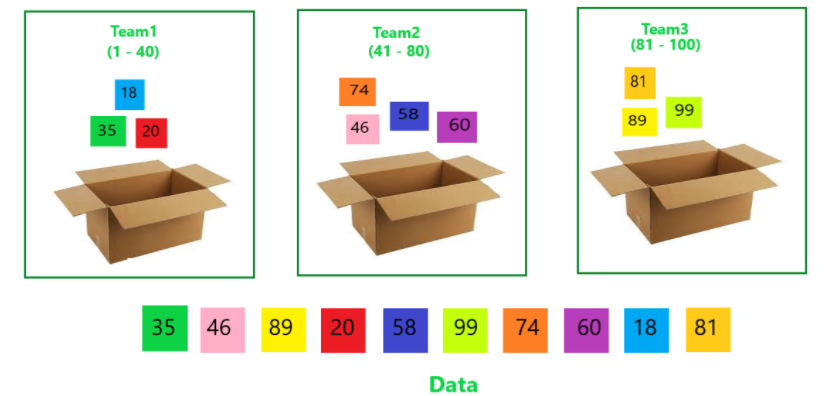
Binning is a way to convert numerical continuous variables into discrete variables by categorizing them on the basis of the range of values of the column in which they fall. In this type of transformation, we create bins. Each bin allows a specific range of continuous numerical values. It prevents overfitting and increases the robustness of the model.
Let’s understand this using an example. We have scores of 10 students as 35, 46, 89, 20, 58, 99, 74, 60, 18, 81. Our task is to make 3 teams. Team 1 will have students with scores between 1-40, Team 2 will have students with scores between 41-80, and Team 3 will have students with scores between 81-100.
Binning can be done in different ways listed below.
- Fixed – Width Binning
- Quantile Binning
- Binning by Instinct
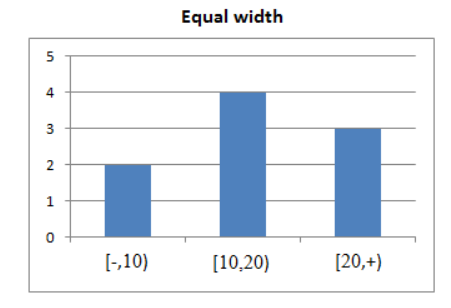
1. Fixed – Width Binning
Just like the name indicates, in fixed-width binning, we have specific fixed widths for each of the bins which are usually pre-defined by the user analyzing the data. Each bin has a pre-fixed range of values that should be assigned to that bin on the basis of some domain knowledge, rules, or constraints.
Let’s take an example to understand it better, we can group a person’s age interval to 10 years(decades). 0- 9 years will be in bin-1, 10-19 in bin-2 similarly 20-29 in bin-3
This can be achieved by the below code in python.
import pandas as pd

#reading file
df_bin = pd.read_csv('stroke_prediction.csv')

#Creating bins and labels
bins = [1,10,20,30,40]
labels = ['bin-1','bin-2','bin-3','bin-4']

df_bin['age_range'] = pd.cut(df_bin['age'],bins = bins, labels = labels)
2. Quantile Binning
If there are a large number of gaps in the range of numerical feature fix-width binning will not be that effective, there will be many empty bins with no data. In such cases binning is done on the basis of quantile distribution.
Quantiles divide data into equal portions. The Median divides data into two parts, half of the data is smaller than the median, and half of the data is large than the median. Quartiles divide into quarters and deciles into tenth etc.
3. Binning by Instinct
This actually involves a manual process of binning manually based on your own personal insight of the data and setting ranges we would like to bin our data into.
Let’s take an example to understand it better, we can group a person’s age into interval where 1-18 falls under a minor, 19- 29 under young, 30-49 under old, and 50-100 in very old.
![]()
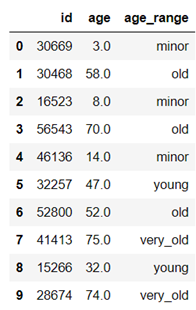
This can be achieved by the below code in python.
 import pandas as pd

#reading file
df_bin = pd.read_csv('stroke_prediction.csv')

#Creating bins and labels
bins = [1,19,30,50,100]
labels = ['minor','young','old','very_old']

df_bin['age_range'] = pd.cut(df_bin['age'],bins = bins, labels = labels)
Splitting feature
Most of the time the dataset contains complex features i.e combination of two or more features. By extracting and creating more meaningful features can improve model performance by uncovering potential information.
It can be applied to both continuous and categorical features.
For example: Given that in the housing price dataset there is a feature ‘floors’ whose values are in float and integer part represents the number of floors and 0.5 decimal part indicates if there it is a penthouse or not.
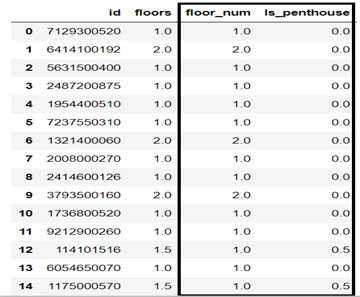
import pandas as pd

#reading file
df = pd.read_csv('housing_price.csv')

# Separating integer part and fractional part to create two new features
df['floor_num'] = df['floors'].apply(lambda x:x//1)
df['Is_penrhouse'] = df['floors'].apply(lambda x:x%1)
Working with Time-Series data
Date columns provide valuable information about the model target, they are neglected as an input for the machine learning algorithms.
Building relationship between the values is very challenging for a machine learning algorithm if you leave the date columns without manipulation
- We can extract parts of date into different columns like Year, month, day, a week, etc.
- We can find the number of days between two dates.
- We can create new features like if the day is weekend or weekday.
- We can create features like if it’s a holiday or not.
This can be achieved by pandas function ‘strftime’ and ‘DatetimeIndex’
Below is an example where I have extracted month and week of the year. Similarly, we can create more features like day, year, weekend, etc

import pandas as pd

#reading file
df = pd.read_csv('housing_price.csv')
df['date'] = pd.to_datetime(df['date'])
df['month'] = pd.DatetimeIndex(df['date']).month
df['week'] = pd.DatetimeIndex(df['date']).week
Creating a new feature by combining multiple features
In this type of feature engineering technique, we create new features by combining two or more features which can give us more insights.
For example, We have a stroke prediction dataset where we need to predict if a person will have a stroke or not.
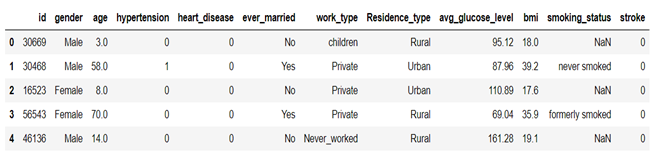
Here we can see and also can confirm by EDA that people with higher age have more chances of stroke, similarly person with a higher BMI and avg_gulcose_level is more likely to have a stroke.
We can create new features like if person age > 50 and avg_gulcode_level > 180 then populate 1
Also, we can create features if a person is having hypertension and heart disease then create another feature for that.
import pandas as pd

#reading file
df = pd.read_csv('stroke_prediction.csv')

# creating new feature with person having hypertension and heart_disease
a = (df["hypertension"]=="1")
b=(df["heart_disease"]=="1")
df['hypertension_heart_patient'] = a&b
df = df.replace(True, 1)
df = df.replace(False, 0)
Transformation to make data normally distributed
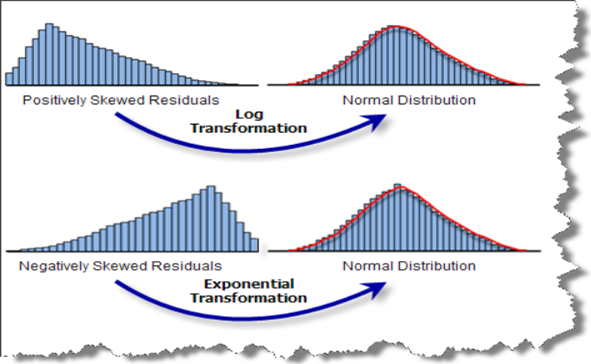
Some machine learning models, like linear and logistic regression, have an assumption that the variable is following a normal distribution. More likely, variables in datasets have skewed distribution. To remove skewness of variable and make it normal or near to normal distribution we apply different transformations to increase the performance of our model.
The most commonly used methods of transforming variables are listed below:
- Logarithmic transformation
- Reciprocal transformation
- Exponential or power transformation
- Box-cox transformation
- Yeo-Johnson transformation
1. Logarithmic transformation
This is the most popular transformation among all transformations and also, it is the most simple one.’
Generally, it is implemented on right-skewed distributions to make it normal distribution or similar to normal distribution.
F(x) = ln(x)
This transformation can only be performed if there are all positive values in the variable.
import pandas as pd
import numpy as np
from sklearn.preprocessing import FunctionTransformer

#Load data
df = pd.read_csv('anydata.csv')

#create columns variables to hold the columns that needs transformation
columns = ['col_1','col_2','col_3']

#create the function transformer object with Logarithm transformation
logarithm_transfer = FunctionTransformer(np.log, validate = True)

#Apply the transformation
data_new = logarithm_transfer.transform(data[columns])
2. Reciprocal Transformation:
Reciprocal transformation transforms large values to small values of the same sign and reverses the order among values of the same sign.
f(x) = 1/x
This can be achieved by the sklearn FunctionTransformer function. Below is a snippet of code implementation using the same function.
import pandas as pd
import numpy as np
from sklearn.preprocessing import FunctionTransformer

#Load data
df = pd.read_csv('anydata.csv')

#create columns variables to hold the columns that needs transformation
columns = ['col_1','col_2','col_3']

#create the function transformer object with Logarithm transformation
reciprocal_transfer = FunctionTransformer(np.reciprocal, validate = True)

#Apply the transformation
data_new = reciprocal_transfer.transform(data[columns])
3. Exponential Transformation
Generally, it is implemented on left-skewed distributions to make it normal distribution or similar to normal distribution.
We can use square, cube, square root, etc exponential transformation depend on the distribution of the variable.
F(x) = x^2
F(x) = x^3
F(x) = x^n
Below is a snippet of code implementation using the same function.
import pandas as pd
import numpy as np
from sklearn.preprocessing import FunctionTransformer

#Load data
df = pd.read_csv('anydata.csv')

#create columns variables to hold the columns that needs transformation
columns = ['col_1','col_2','col_3']

# create the function transformer object with  your exponent transformation
# Using x^3 is arbitrary here, you can choose any exponent
exponential_transfer = FunctionTransformer(lambda x:x**(3), validate = True)

#Apply the transformation
data_new =exponential_transfer.transform(data[columns])
End Note
In this article, we saw a simple code pattern for creating any number of “features” from raw input data, as well as some suggestions for useful transformations.
For reference visit “https://github.com/pravar-jain/Feature-engineering-stroke-data/blob/main/Feature%20engineering-%20stroke%20data.ipynb”.I have implemented a few feature engineering techniques on stroke prediction data.
So, keep practicing and applying your learning!


It is very well written and insightful.