Overview
- Learn how to build an accurate forecast in Excel – a classic technique to have for any analytics professional
- We’ll work on a real-world case study to design and forecast sales in Microsoft Excel
Introduction
I first came across the term forecasting, in the real-world business sense, in the popular TV show ‘Shark Tank’. The enigmatic Mr. Wonderful always asked – “What is your sales forecast for this year?” It’s such a simple question yet it started a conversation about the entire business model, framework, suitability, etc.

Given the scalable nature of business these days, I used to wonder how in the world are these guys forecasting their sales numbers? For someone who wasn’t yet acquainted with forecasting, this sure was an intriguing topic.
And let’s face it – forecasting is at the core of what we do in analytics and/or data science. As Shark Tank alludes to throughout the show, if you can’t perform a forecast for your business/product/service, you’re heading for trouble, folks.
Forecasting is everywhere – sales, marketing, operations, finance, etc. Analytics professionals are at the forefront of designing forecasts – quite a significant advantage to have!

Here’s the thing – Microsoft Excel is one of the most versatile and easily-accessible tools for drawing up these business forecasts. Anyone from analysts and managers to executives and investors can leverage the power of Excel to create these forecasts for the business.
I love this! Excel brings the predictive power of forecasting to everyone without any knowledge of statistics and programming. So why not learn how to build forecasts in Excel yourself?
In this article, we will be working on a very interesting case study of a local sweet shop. We will be forecasting the sales for the remaining months of 2020 and will also see the effect of coronavirus on our forecast.
If you are a beginner in the world of data science and analytics I would recommend these free courses to get started:
Table of Contents
- What is Forecasting?
- Why is Forecasting Important for an Analyst?
- Important Functions to Know Before Performing Forecasting in Excel
- Forecasting in Excel – Let’s Get Going!
What is Forecasting?
The million-dollar question (sometimes literally) – what in the world is forecasting?
In the simplest terms, it is the process of predicting the future while analyzing the past and present data. We do Quantitative Forecasting majorly on time-series data. So let’s understand a few key time-series terms before I move forward.
Time series is generally data that is collected over time and is dependent on the time component. For example, here we have a time-series data of the number of passengers flying every year:
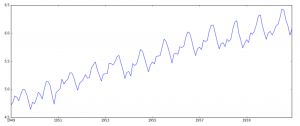
Some of the great time-series I have seen consist of some component, and it’s really important to get through them once we begin:
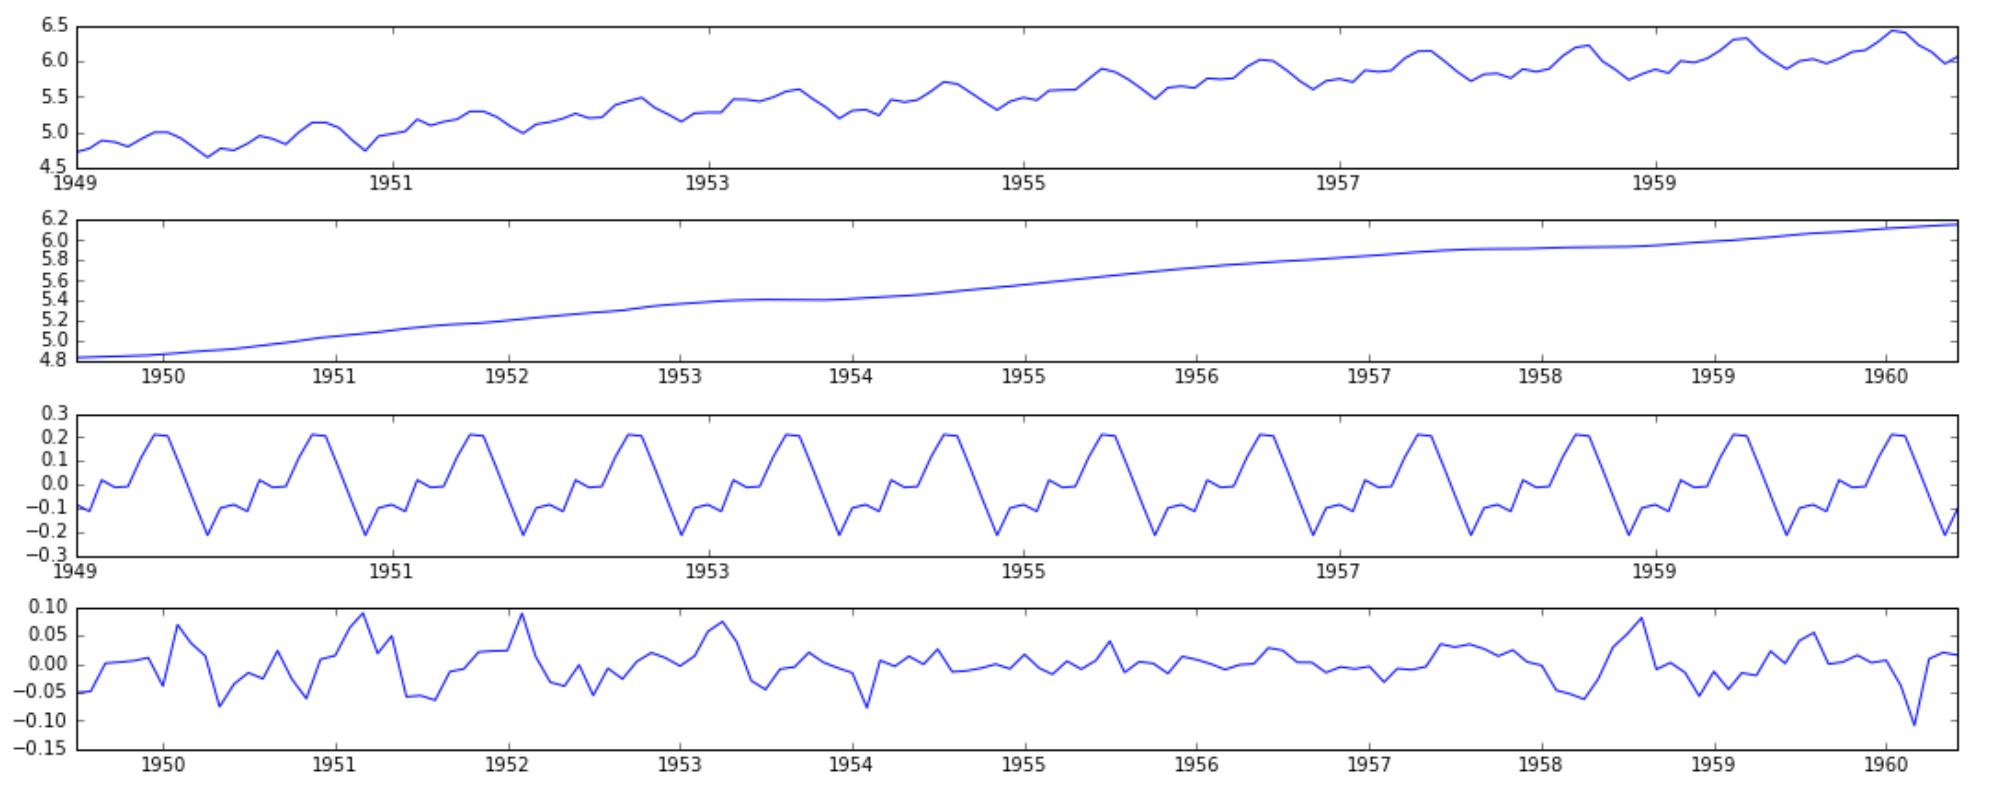
- Trend – Trend is a general direction in which something is developing or changing. In the above example, we see an increasing trend in the time series which means that the number of passengers flying on planes is increasing. The second visualization represents the trend in the below image
- Seasonality – Another clear pattern that can be seen in the above time series is that the pattern is repeating at a regular time interval. This is known as seasonality. Any predictable change or pattern in a time-series that recurs or repeats over a specific interval of time can be said to be seasonality. The third visualization represents the seasonal component.
The last visualization depicts the noise or error in the time-series.
Why is Forecasting Important for an Analyst?
As I mentioned in the introduction earlier, forecasting is one of the most basic techniques that can help you predict future values, trends, and opportunities. Companies as well as startups use these techniques to make crucial decisions. Here are a few examples:
- Business managers use forecasting to predict the sales and accordingly plan their budgets, hiring plans, and so on
- Economists may use forecasting to predict future recessions, economic ups-and-downs, and accordingly recommend a future plan
- Governments use forecasting to plan and build their policies
These are a few examples where forecasting is used in day-to-day lives. If you are planning to become a business analyst, it is recommended that you brush up your forecasting skills.
To perform forecasting for the scope of this tutorial, you won’t be requiring any prior knowledge of statistics or programming. We will be using the most commonly used tools in analytics – Microsoft Excel.
If you want to dive deeper into time-series data, this article is for you:
Important Functions to Know before Performing Forecasting in Excel
We will start with the most simple function available in Excel:
forecast.linear()
It predicts or calculates values by using existing or past values. We will be predicting y by looking at x values. The linear regression function calculates this.
While this function works best if there’s a linear trend in your data, i.e., y is linearly dependent on x values, there’s a caveat. This function won’t give a good idea if there’s seasonality (read the definition above) present.
Don’t worry, Excel gives us another great function for advanced forecasting:
forecast.ets()
This function forecasts values by using existing values, i.e, historic values. It does this prediction by using the triple exponential smoothing method. While I won’t be going deep into the method, I will mention a few must-know points:
- forecast.ets function or the triple exponential smoothing method takes seasonality into account
- This method is a weighted method and the weightage of the past value decreases exponentially, which means – the older the value the lessers is its importance
- Most importantly, the timeline must be spread uniformly, or else it will give an error. For example, they can be monthly data, daily data, yearly data, etc.
- Excel is great for beginning your forecasting journey as it automates a lot of things like detecting the seasonality cycle. You can manually input the seasonality and other inputs but only do so if you know forecasting and the business very well
forecasting.ets.seasonality()
It returns the number of seasonal patterns that Excel detects in the timeline.
forecasting.ets.confint()
It returns a confidence interval for the predicted value at the specified target date. The default confidence interval is 95%. This means that 95% of the future values will lie in this range of values. It can be overwhelming to understand all the functions so let us begin by practically working on a case study.
Build your Forecasting Model in Excel
Let’s begin with the most awaited section of the article. We have a dataset of a local sweet shop – Barfi. It consists of monthly sales data of their products starting from Jan 2018 till August 2020. We’ll be forecasting Barfi’s sales for the remaining months of the year so that the shop owner can prepare his inventory and staff accordingly.
Here’s the sample data:
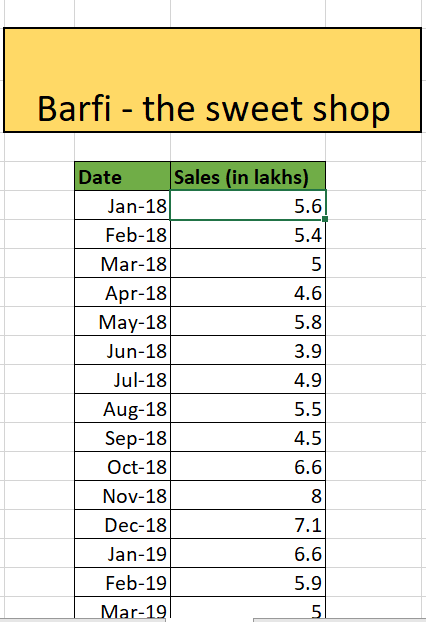
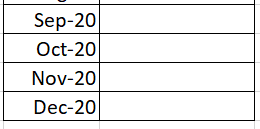
We’ll predict sales value for 4 months – September, October, November, December:
We’ll start with forecasting steps for Excel versions older than 2016.
Forecasting in Pre-2016 Excel
In Excel versions older than 2016, we will be applying our ever-gold forecasting function:
You can check the seasonality and confidence interval using the function.
Forecasting in Excel 2016 Onwards
Performing forecasting in Excel versions 2016 and newer can be much more intuitive and fun. We’ll be performing the steps using the forecasting sheet.
Step 1 – Select Forecast Sheet
Go to Data and select Forecast Sheet:
Step 2 – Select the necessary options
Then you can select necessary options such as – end date, confidence interval, and perform many more customizations! The forecast sheet provides us with tabular values such as forecast, lower confidence value, and upper confidence value along with a graphical view of the data:
Congratulations! You have made your first forecast model in Excel! It is simple, isn’t it?
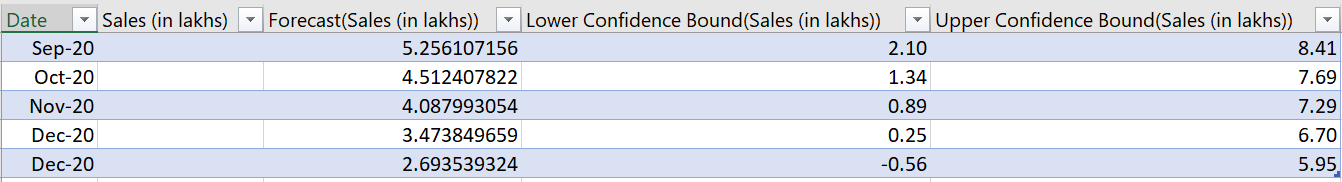
Let us discuss the result of our analysis:
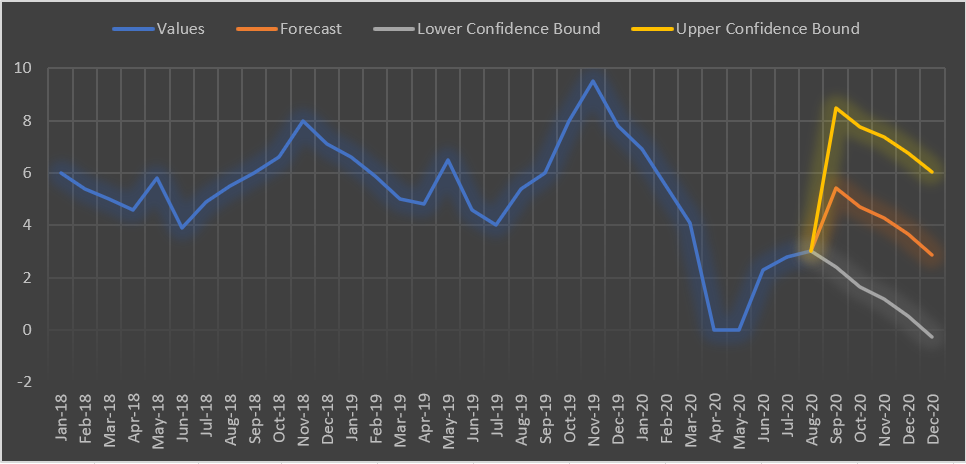
By eyeballing our data, we notice that there are usually peaks in the month of November and the neighboring months probably due to festive seasons.
Coming to the month of April and May, the store has seen zero revenue! That’s tough. The sales have picked up in the proceeding months of July and August.
Our forecast suggests that this trend will be growing in the month of September with a sales value of 5.4 lakhs. The store can now look at the forecasting data of the coming months to prepare their inventory. They can also look at the confidence levels and get an idea of how the fluctuation might look like.
End Notes
Whew – we covered a lot of ground in this article. We understood the importance of forecasting and how we can build a forecasting model in Excel.
Hope you all found it useful and will apply this amazing technique to your corporate life (and your personal daily affairs!).
There is a lot of difference in the data science we learn in courses and self-practice and the one we work in the industry. I’d recommend you to go through these crystal clear free courses to understand everything about analytics, machine learning, and artificial intelligence:
- Introduction to AI/ML Free Course | Mobile app
- Introduction to AI/ML for Business Leaders Mobile app
- Introduction to Business Analytics Free Course | Mobile app
Let me know where we can we apply forecasting techniques in other business scenarios in the comments section below.
Product Growth Analyst at Analytics Vidhya. I'm always curious to deep dive into data, process it, polish it so as to create value. My interest lies in the field of marketing analytics.


Good
Easy to follow illustration for beginners.
Great, clear and concise. Thanks a lot Ram! Carlos