-
Guide to Geospatial Analysis using Folium
Explore Folium: Easy map tool. Install, plot maps, markers, paths, layers, & plugins. Visualize COVID-19 hotspots & NYC bus traffic.
Abhishek Sharma 26 Jun, 2024
-
Learn How to Visualize Geospatial Data in Jupyter using kepler.gl
Visualizing geospatial data using kepler.gl for jupyter notebooks. In this article we'll learn about kepler.gl and use it for visualizing geospatial data.
Abhishek Sharma 23 Oct, 2024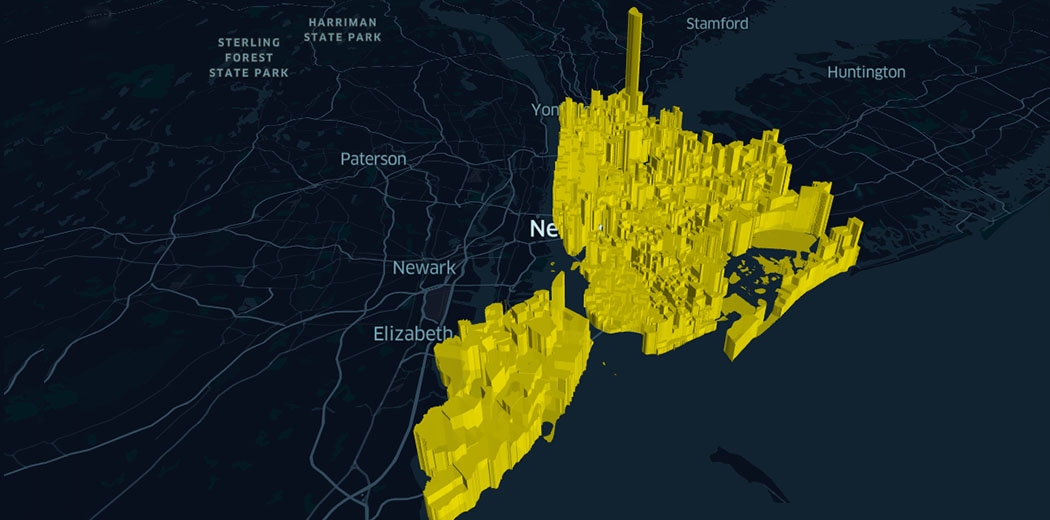
-
Tableau vs. Qlik Sense – Which Analytics and Business Intelligence Tool Should you Use?
Tableau vs Qlik Sense the two popular business intelligence platforms. A guide for qlik sense and tableau comparison to help you choose your analytics tool.
Abhiraj Suresh 12 Jul, 2020
-
10 matplotlib Tricks to Master Data Visualization in Python
Matplotlib is a popular data visualization library widely used by Python users. Here is the list of 10 Matplotlib tricks and tips in Python.
Abhishek Sharma 24 Oct, 2024
-
Running Low on Time? Use PyCaret to Build your Machine Learning Model in Seconds
Simplify your machine learning journey with Pycaret, the comprehensive platform for beginners and experts in the field. Explore Pycaret Now!
Lakshay arora 14 Dec, 2023
-
What is Data Storytelling?
Learn what Data Storytelling is, its benefits, key components, and best practices. Discover how to create impactful data stories using effective strategies .
Aayush Tyagi 04 Apr, 2025
-
10 Powerful and Time-Saving Data Exploration Hacks, Tips and Tricks!
Data exploration can often by time consuming in data science. These 10 data exploration tips, tricks and hacks will save you a lot of time.
Ram Dewani 14 Apr, 2020
-
6 Python Libraries to Interpret Machine Learning Models and Build Trust
Python libraries for interpretable machine learning models. Interpreting machine learning models plays a big role in a data science project.
Purva Huilgol 01 Apr, 2020
-
A Beginner’s Guide to Random Forest Hyperparameter Tuning
Master Random Forest hyperparameter tuning! Explore max_depth, n_estimators, min_samples_split, & more to optimize ML models effectively.
Sharoon Saxena 17 Dec, 2024
-
6 Essential Data Visualization Python Libraries – Matplotlib, Seaborn, Bokeh, Altair, Plotly, GGplot
Data visualization libraries python. In this article learn 6 python data visualization libraries matplotlib, seaborn, bokeh, altair, plotly and ggplot.
Mohd Sanad Zaki Rizvi 25 Jun, 2020
