-
Creating Interactive data visualization using Shiny App in R (with examples)
An introduction to Shiny App and data visualization using this app in R. It contains detailed explanations in UI.R and Server.R along with codes.
saurav kaushik 05 Jul, 2020
-
18 Free Exploratory Data Analysis Tools For People who don’t code so well
This article enlists free data analysis tools for non programmers. These are the best data analysis tools in data science & machine learning.
Analytics Vidhya 05 Jul, 2020
-
10 Questions R Users always ask while using ggplot2 package
This is a tutorial on creating maps, scatter plots, bar plots, box plots, heat maps, area chart, correlogram using ggplot package in R
Analytics Vidhya 24 Jun, 2022
-
A Complete Tutorial to learn R Programming for Data Science from Scratch
Learn R Programming For Data Science, data manipulation, machine learning, with our guide covering everything from installation to predictive modeling.
Analytics Vidhya 06 Oct, 2025
-
Quick Insights: India Analytics and Big Data Salary Report 2016
Here are quick insights from India analytics & big data salary report 2016. Salary trends by data science tools, techniques, skills and location
Kunal Jain 05 Aug, 2016
-
Launching learning path to master D3.js
Learning path to master d3.js which includes best resources to learn html, css, javascript to create advanced visualizations
Kunal Jain 03 Feb, 2016
-
A Complete Tutorial on SAS Macros For Faster Data Manipulation
A SAS program is a combination of Data steps, global statements, SAS Component Language (SCL), SQL statements and SAS Macro statements.
Sunil Ray 25 Jun, 2019
-
10 Ultimate Tips and Tricks on Data Visualization in QlikView
Use these tricks and keyboard shorts to create dashboards faster for data visualization in qlikview. it includes conditional enable shortcuts
Sunil Ray 21 Dec, 2015
-
Infographic: Data Visualization Tools For Data scientists & analysts
Here's an infographic which displays most commonly used tools for data visualization by data scientists and data analysts for all sort of uses
Kunal Jain 11 Dec, 2015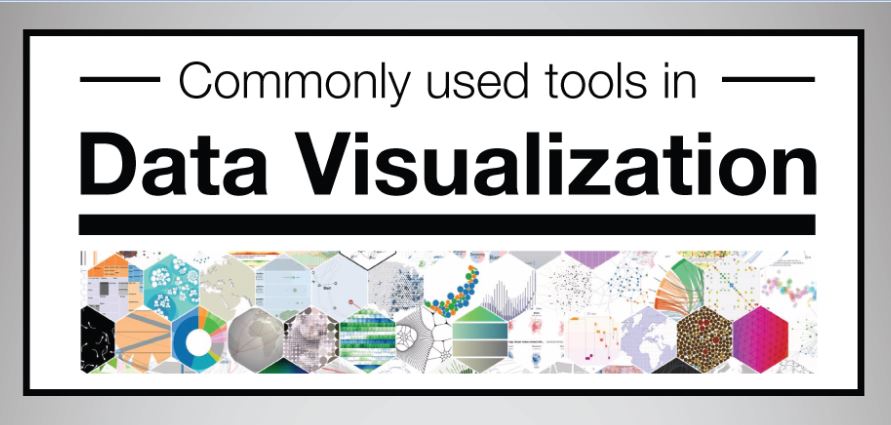
-
Interactive Data Visualization using Bokeh (in Python)
Bokeh is a Python library for interactive visualization that targets web browsers for representation.
Sunil Ray 25 Jun, 2019