-
Ultimate resource for understanding & creating data visualization
Ultimate guide to create data visualization and resources for understanding various data visualization methods used in graphs, charts, heatmap, box plot etc
Sunil Ray 26 Jun, 2020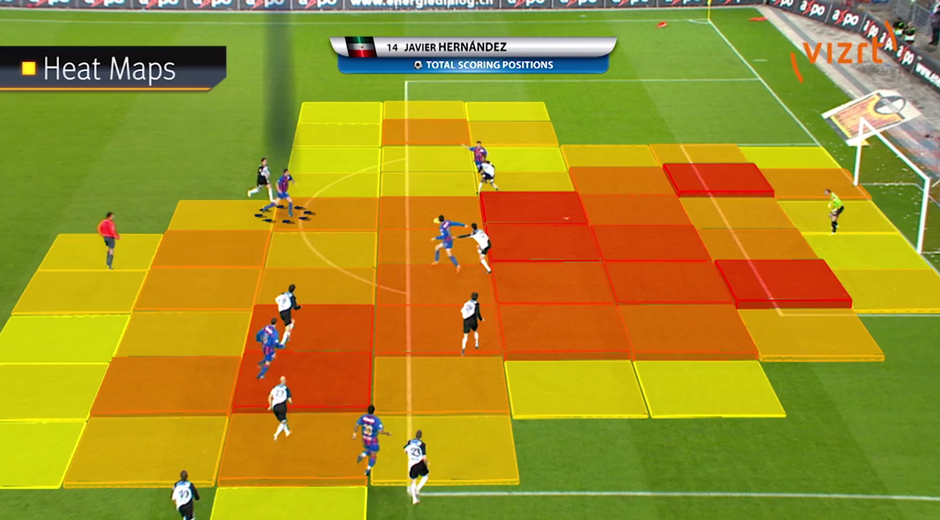
-
Ultimate Guide for Data Exploration in Python using NumPy, Matplotlib and Pandas
This article is the ultimate guide to data exploration in Python using NumPy, Seaborn, Matplotlib and Pandas in iPython comprehensively.
Sunil Ray 14 Oct, 2024
-
2 Simple Hacks to improve information density in your QlikView dashboards
How to use container and conditional formatting to improve information density in your QlikView dashboards. Step by step guide to improve dashboard!
Sunil Ray 25 Sep, 2015
-
How to create Box-Plot chart in Qlikview?
A simple tutorial on what is a box plot and how to create a boxplot in Qlik view to summarize distributions and compare them in Qlikview using a case study.
Sunil Ray 26 Jul, 2020
-
QlikView learning path – the only resource you need to master QlikView
Analytics Vidhya launches a learning path for qlikview data visualization, which enables qlikview starters to learn and become qlikview experts.
Kunal Jain 26 Jul, 2020
-
Data Science trends 2015 to help you plan your learning!
Here are some new data science trends you should know. In this article learn about the trending data science topics of 2015.
Kunal Jain 25 Jun, 2020 -
QlikView Section Access for defining data access in your applications
Defining right data access is critical in any BI application. In this article learn about section access in qlikview and defining data access in qlikview.
Sunil Ray 26 Jul, 2020 -
How to remove Synthetic Key using Concatenation & Link table in QlikView?
Synthetic keys can be a result of a bad data model in QlikView. Learn how to remove synthetic keys in qlikview using Concatenation and Link Table.
Sunil Ray 26 Jul, 2020 -
Applications of SAS Proc IML in Analytics
SAS IML is handy to solve iterative or matrix related problems. Here is an article which brings out a bunch of applications of SAS PROC IML.
Tavish Srivastava 26 Jul, 2020 -
Mining YouTube using Python & performing social media analysis (on ALS ice bucket challenge)
Step by step guide to extract data from YouTube using python and analyse it to measure the effect of a social media campaign on ALS ice bucket challenge.
Kunal Jain 17 Apr, 2015
