-
Confusion Matrix Is No More A Confusion for Data Science Aspirants!
After training our model and have predicted the outcomes, we need to evaluate the model's performance. And here comes our Confusion Matrix.
RASHMI 05 Oct, 2020
-
What Does Gradient Descent Actually Mean
We will see what actually gradient Descent is and why it became popular and why most of the algorithms in AI and ML follow this technique.
Phani Ratan 23 Dec, 2020
-
How to Improve Your Business With Exploratory Data Analysis!
Exploratory Data Analysis is an approach to discover the insights in the data. It is one of the best practices in data science today.
Muthu 05 Oct, 2020
-
A Simple Explanation of K-Means Clustering
K-means clustering is a powerful unsupervised machine learning algorithm. It is used to solve many complex machine learning problems.
ADITYA KUMAR 16 Jan, 2025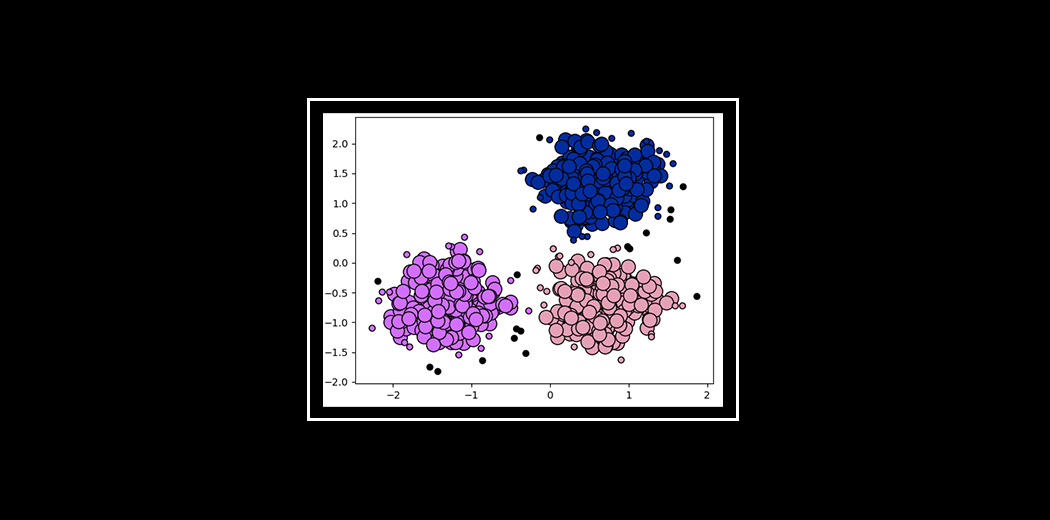
-
Headstart to Plotting Graphs using Matplotlib library
Matplotlib is the best library to plot graphs in Python. Learn about Plotting graphs using matplotlib and draw graphs as per your data
Abhijeet 23 Oct, 2024
-
Optimizing Exploratory Data Analysis using Functions in Python!
Functions help in saving a lot of time by reducing repetitive coding especially in EDA. Learn how to optimize exploratory Data Analysis
Rohit 11 Jan, 2021
-
The Data Science Blogathon is in Full Swing – Participate and Build your Brand!
The Data Science Blogathon by Analytics Vidhya is a chance to showcase your data science skills as well as your writing prowess.
Ram Dewani 05 Oct, 2020
-
Predicting NYC AirBnB Rental Prices with TensorFlow
Airbnb is an online marketplace that lets people rent their properties. Predict the rental prices of AirBnb with TensorFlow and Python
Tim 11 Jan, 2021
-
Space Weather Dashboard – Build Your Own Custom Dashboard to Analyze and Predict Space Weather
In this article learn how to build your own custom space weather dashboard using python dash to analyze and predict space weather.
Guest Blog 11 Jan, 2021
-
Gradient Descent Algorithm: How Does it Work in Machine Learning?
Learn about Cost Functions, Gradient Descent, its Python implementation, types, plotting, learning rates, local minima, and the pros and cons.
Crypto 04 Apr, 2025
