Managing stocks and ETFs across accounts gets messy fast, and guessing your gains or sector exposure is no way to invest. Centralize everything, track real performance, and get notified when something needs your attention instead of reacting late. This guide walks you through pulling live stock prices, calculating gains and losses, monitoring sector exposure, and setting alerts for meaningful price changes. And here’s the thing: this comprehensive guide will show you how to build an investment portfolio tracker in Excel to monitor all your holdings in one place and send automated email alerts for significant market moves.
Table of contents
1. Design The Column Structure
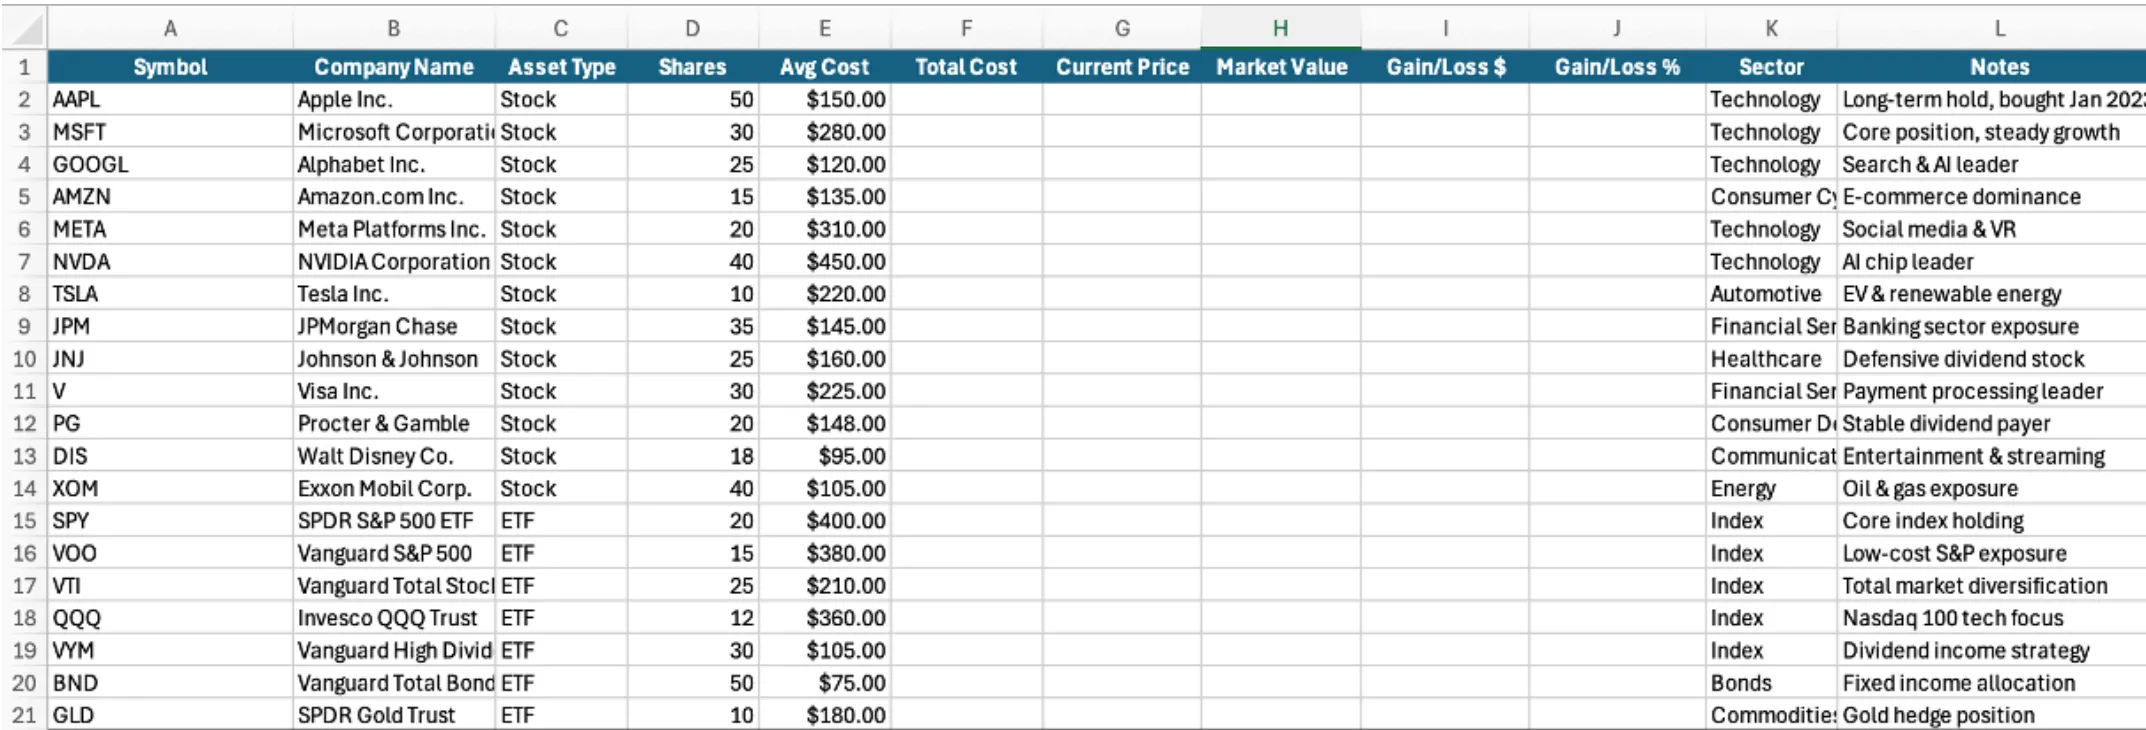
Open MS Excel and decide on the column structure based on the investment details you want to track. Fill in the header rows. I have used the structure below:
A1: Symbol - Stock ticker (AAPL, MSFT, SPY)

B1: Company Name - Full company/fund name

C1: Asset Type - Stock, ETF, Bond, Crypto

D1: Shares - Number of shares owned

E1: Avg Cost - Average purchase price per share

F1: Total Cost - Total investment amount

G1: Current Price - Live market price (auto-updated)

H1: Market Value - Current total value

I1: Gain/Loss $ - Profit or loss in dollars

J1: Gain/Loss % - Return percentage

K1: Sector - Industry sector (Technology, Healthcare, etc.)

L1: Notes - Purchase date, strategy notes
2. Fill in Sample Data
Insert a sample of 20 diverse stock and ETF holdings across multiple sectors. Include technology stocks, financial services, healthcare, consumer goods, energy, and index ETFs to create a diversified portfolio. Leave Columns F through J empty initially, as they will be filled automatically with formulas in the upcoming steps.
Sample Holdings:
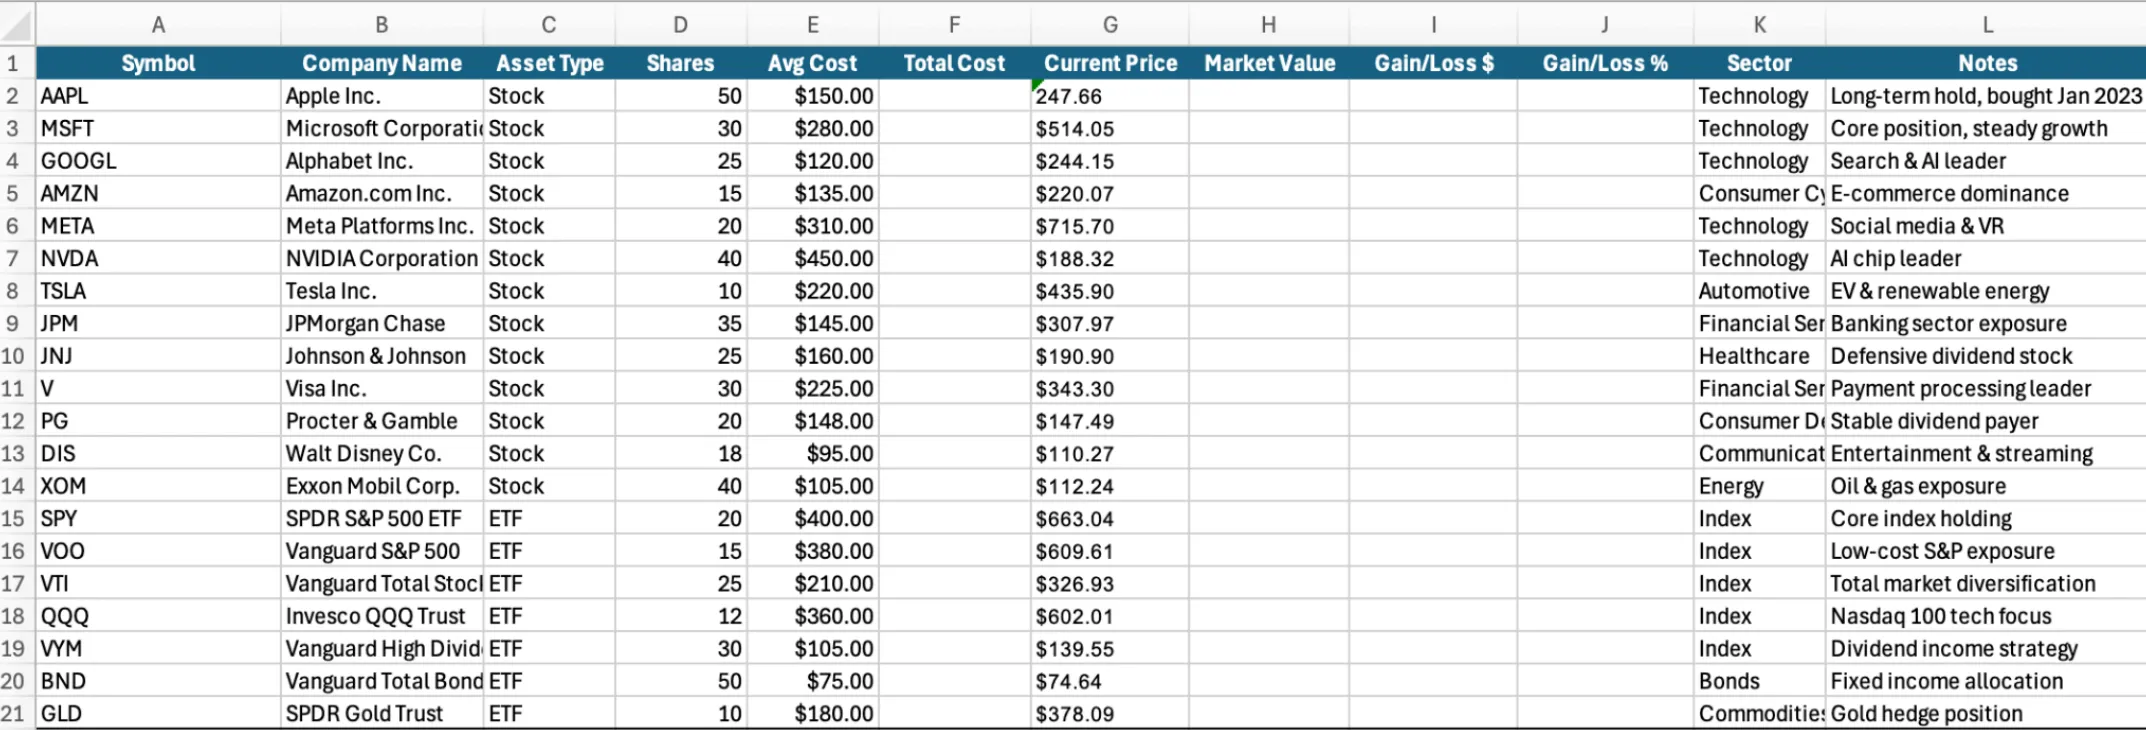
3. Getting Live Stock Prices
Now we’ll set up automatic price feeds. Excel Desktop has multiple methods, but we’ll use the most reliable approach for consistent results.
Method 1: Using Stock Data Types
Follow the following steps below:
- Select ticker symbols in column A (A2:A21)
- Go to Data tab
- Click Stocks button
- Wait for conversion (10-15 seconds for all 20 stocks)
- Verifyy success by seeing a small icon next to each ticker
Extract Current Price in Column G:
Click cell G2 and enter this formula: =A2.Price
This extracts the live current price from the Stock data type. Copy this formula down to G3:G21.
Method 2: Alternative Solution for Compatibility Issues
Sometimes the “STOCK” Function in excel depends upon the latest version and geography. If Stock data types don’t work on your system, use this STOCKHISTORY function:
Click cell G2 and enter: =INDEX(STOCKHISTORY(A2,TODAY()-1,TODAY()),1,5)
This pulls the most recent closing price. Copy down to G3:G21.
4. Building Smart Calculation Formulas
Now we’ll add formulas to automatically calculate your investment performance. These formulas update instantly whenever prices change.
A. Total Cost Formula (Column F)
Click cell F2 and enter this formula: =D2*E2
This calculates: Shares × Average Cost = Total Investment
Copy this formula down to F3:F21.
B. Market Value Formula (Column H)
Click cell H2 and enter this formula: =D2*G2
This calculates: Shares × Current Price = Current Market Value
Copy down to H3:H21.
C. Gain/Loss in Dollars (Column I)
Click cell I2 and enter this formula: =H2-F2
This calculates: Market Value – Total Cost = Profit/Loss
Copy down to I3:I21.
D. Gain/Loss Percentage (Column J)
Click cell J2 and enter this formula: =IF(F2=0,0,(I2/F2)*100)
Then format column J as Percentage
This calculates: (Gain/Loss ÷ Total Cost) = Return Percentage
Copy down to J3:J21.
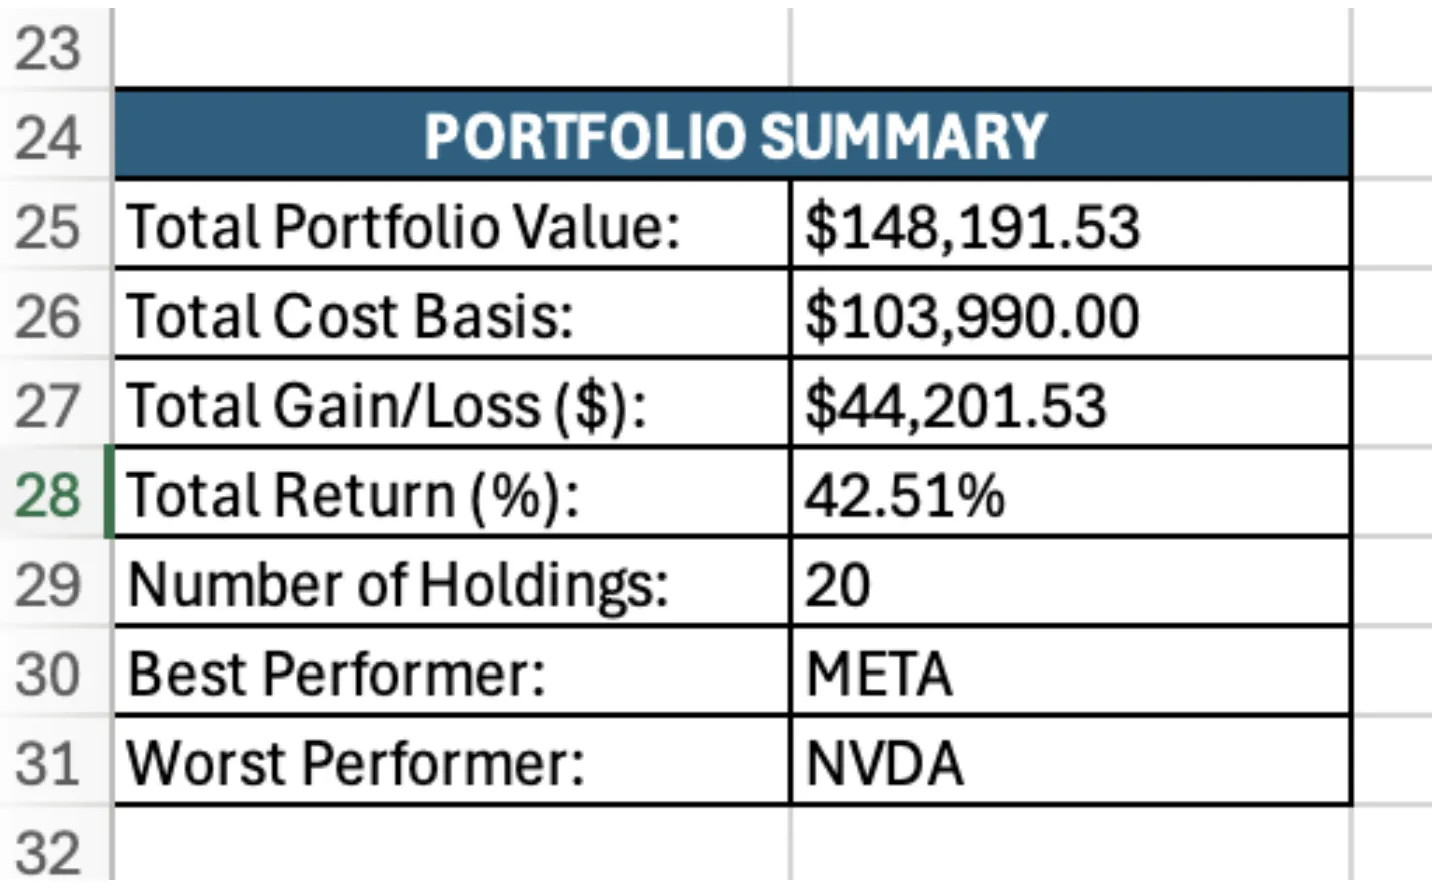
5. Build A Summary Dashboard
Add a portfolio summary section starting at row 24 to track key metrics:
A. Total Portfolio Value (In USD)
Add this formula to calculate total current value: =SUM(H2:H21)
B. Total Cost Basis (In USD)
Add this formula to calculate total investment: =SUM(F2:F21)
C. Total Gain/Loss ($)
Add this formula to calculate total profit/loss: =B27-B28
(Assuming B27 has portfolio value and B28 has cost basis)
D. Total Return (%)
Add this formula to calculate overall return percentage: =(B29/B28)
E. Number of Holdings
Add this formula to count active positions: =COUNTA(A2:A21)
F. Best Performer
Add this formula to identify top gainer: =INDEX(A2:A21,MATCH(MAX(J2:J21),J2:J21,0))
G. Worst Performer
Add this formula to identify biggest loser: =INDEX(A2:A21,MATCH(MIN(J2:J21),J2:J21,0))
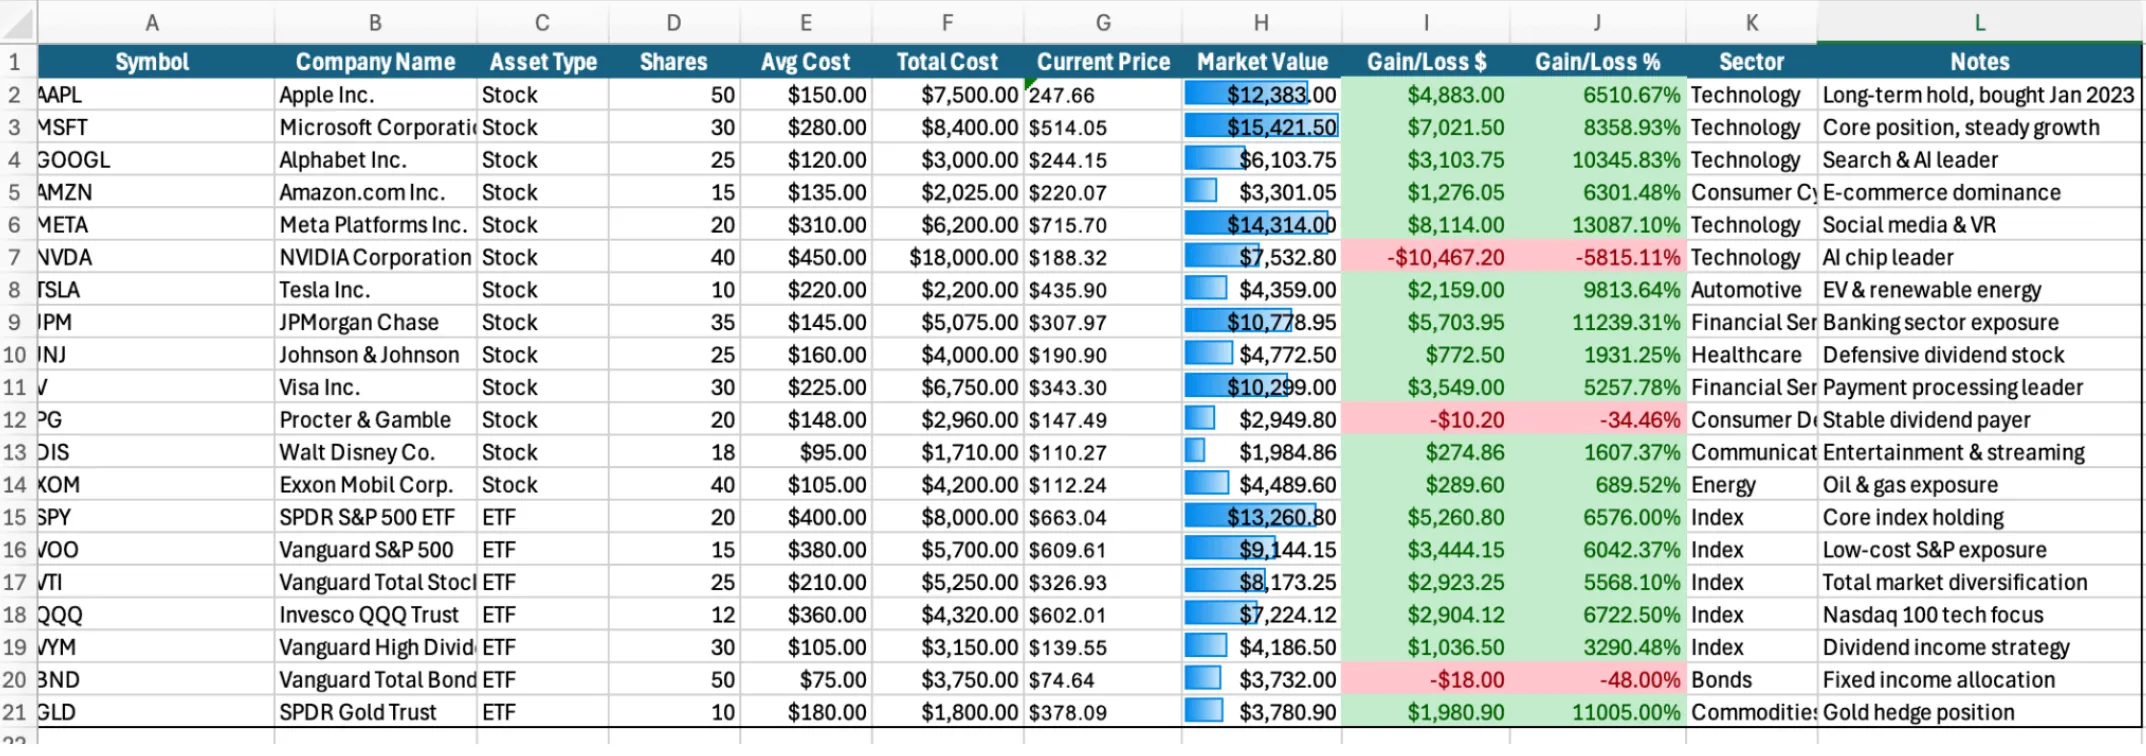
6. Creating Visual Alerts with Conditional Formatting
Now set up conditional formatting to highlight significant movements and performance:
Format Gain/Loss $ Column (I):
- Select column I (I2:I21)
- Go to Home : Conditional Formatting : New Rule
- Format cells > 0: Light green fill with dark green text
- Add another rule for < 0: Light red fill with dark red text
Format Gain/Loss % Column (J):
Repeat the same green/red formatting process for column J.
Add Data Bars to Market Value (Column H):
- Select H2:H21
- Conditional Formatting : Data Bars : Blue Gradient Fill
This creates visual bars showing the relative size of each position.
Now your tracker will automatically highlight gains in green and losses in red, making it easy to spot performance at a glance.
7. Set up Automated Email Alerts
Since Excel Desktop doesn’t have built-in email automation, we’ll use Google App Script for automated email alerts.
Steps for Setting Up Google Apps Script:
- Export to CSV: From Excel, save as CSV
- Upload to Google Sheets: Import the CSV file
- Add GOOGLEFINANCE: Replace column G with
=GOOGLEFINANCE(A2,"price") - Access Apps Script: In Google Sheets, go to Extensions : Apps Script
- Delete Default Code: Remove existing code
- Rename Project: Click “Untitled project” and rename to “Portfolio Alerts”
Paste this complete script into the Code.gs file:
function checkStockAlerts() {
const sheet = SpreadsheetApp.getActiveSheet();
const data = sheet.getDataRange().getValues();
const headers = data[0];
// Find column indices
const symbolCol = headers.indexOf('Symbol');
const companyCol = headers.indexOf('Company Name');
const priceCol = headers.indexOf('Current Price');
const dayChangeCol = headers.indexOf('Day Change %');
const gainLossCol = headers.indexOf('Gain/Loss %');
const sharesCol = headers.indexOf('Shares');
const marketValueCol = headers.indexOf('Market Value');
let alerts = [];
// Loop through each row (skip header)
for (let i = 1; i < data.length; i++) {
const symbol = data[i][symbolCol];
const company = data[i][companyCol];
const currentPrice = data[i][priceCol];
const dayChange = data[i][dayChangeCol];
const gainLoss = data[i][gainLossCol];
const shares = data[i][sharesCol];
const marketValue = data[i][marketValueCol];
// Skip if no symbol
if (!symbol) continue;
// Alert if day change > 5% or < -5%
if (Math.abs(dayChange) >= 5) {
alerts.push({
symbol: symbol,
company: company,
type: 'Daily Movement',
message: `${symbol} (${company}): ${dayChange.toFixed(2)}% day change`,
details: `Current Price: ${currentPrice.toFixed(2)} | Shares: ${shares} | Value: ${marketValue.toFixed(2)}`
});
}
// Alert if gain/loss milestone reached
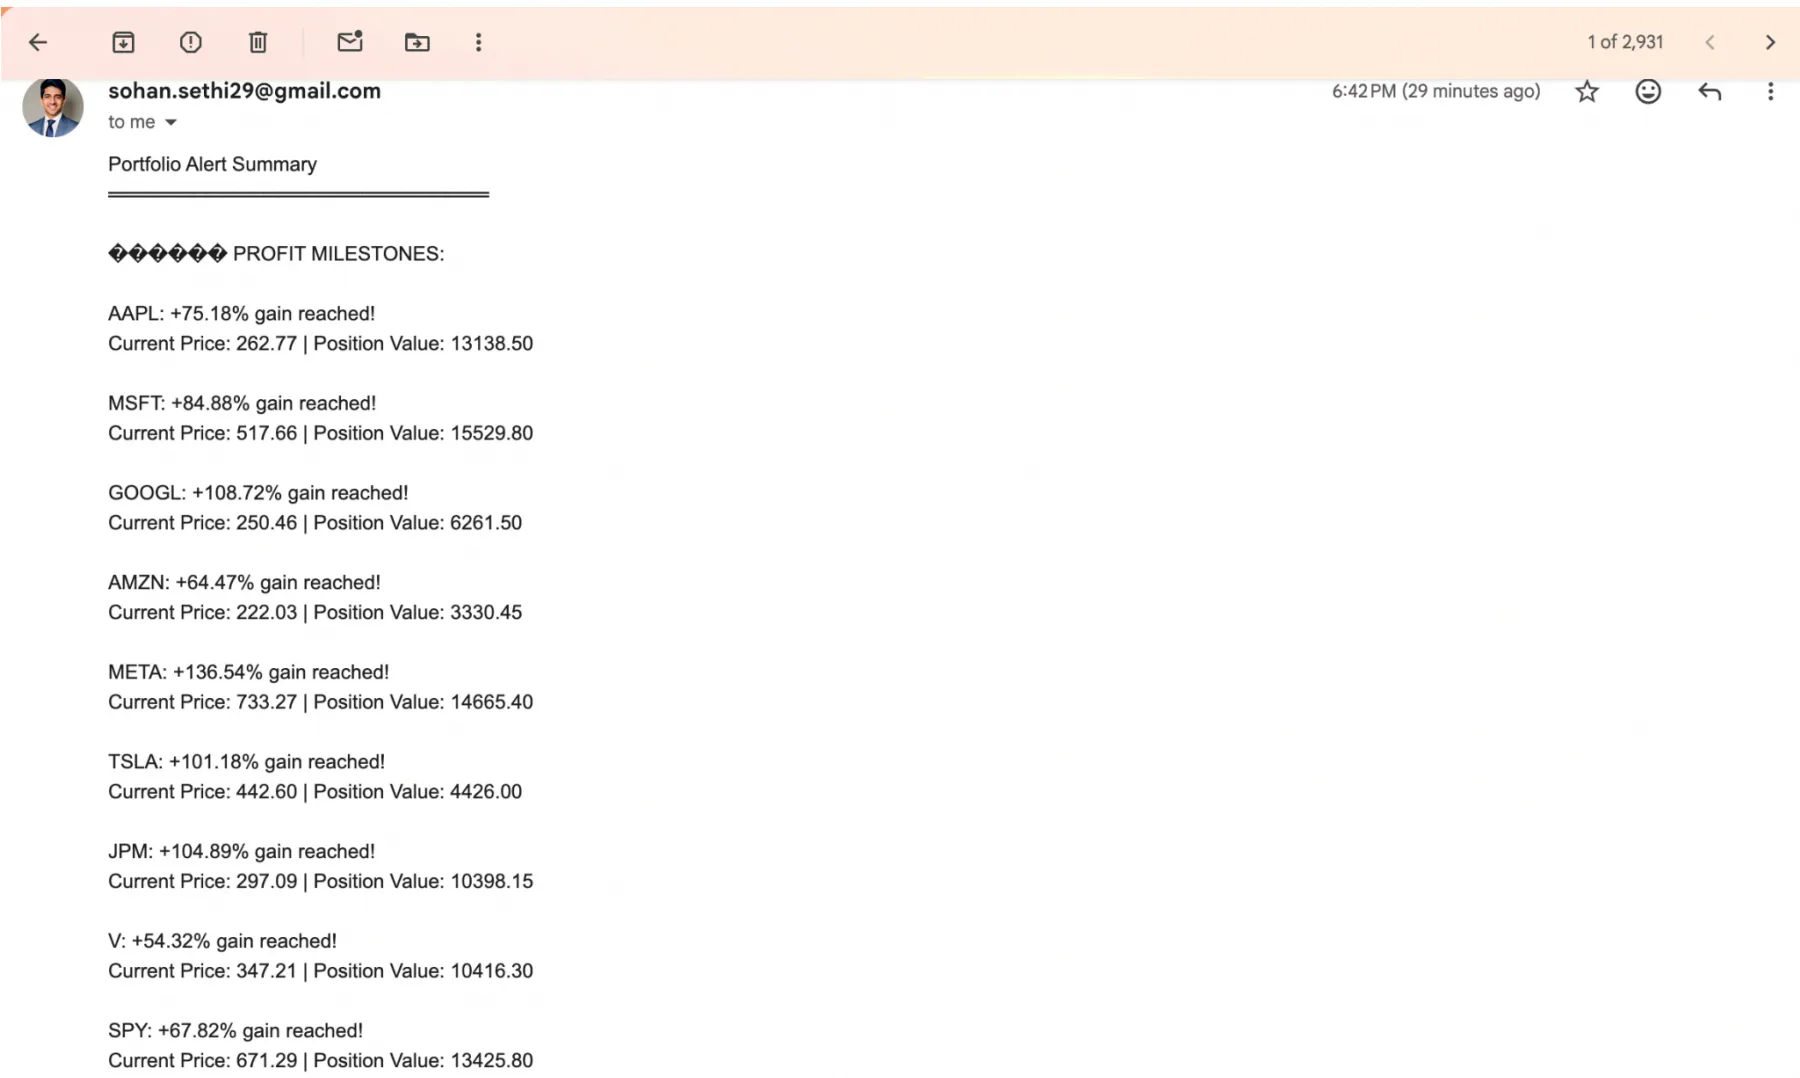
if (gainLoss >= 50) {
alerts.push({
symbol: symbol,
company: company,
type: 'Profit Milestone',
message: `${symbol}: +${gainLoss.toFixed(2)}% gain reached!`,
details: `Current Price: ${currentPrice.toFixed(2)} | Position Value: ${marketValue.toFixed(2)}`
});
} else if (gainLoss <= -20) {
alerts.push({
symbol: symbol,
company: company,
type: 'Loss Warning',
message: `${symbol}: ${gainLoss.toFixed(2)}% loss alert`,
details: `Current Price: ${currentPrice.toFixed(2)} | Position Value: ${marketValue.toFixed(2)}`
});
}
}
// Send email if alerts exist
if (alerts.length > 0) {
sendAlertEmail(alerts);
Logger.log('Alert email sent with ' + alerts.length + ' alert(s)');
} else {
Logger.log('No alerts to send at this time');
}
}
function sendAlertEmail(alerts) {
// CHANGE THIS TO YOUR EMAIL ADDRESS
const emailAddress = '[email protected]';
// Build email subject
const subject = '🚨 Stock Alert: ' + alerts.length + ' Position(s) Require Attention';
// Build email body
let body = 'Portfolio Alert Summary\n';
body += '═══════════════════════════\n\n';
// Group alerts by type
const dailyMovement = alerts.filter(a => a.type === 'Daily Movement');
const profitMilestones = alerts.filter(a => a.type === 'Profit Milestone');
const lossWarnings = alerts.filter(a => a.type === 'Loss Warning');
// Daily movement alerts
if (dailyMovement.length > 0) {
body += '📊 SIGNIFICANT DAILY MOVEMENTS:\n\n';
dailyMovement.forEach(alert => {
body += alert.message + '\n';
body += alert.details + '\n\n';
});
}
// Profit milestone alerts
if (profitMilestones.length > 0) {
body += '💰 PROFIT MILESTONES:\n\n';
profitMilestones.forEach(alert => {
body += alert.message + '\n';
body += alert.details + '\n\n';
});
}
// Loss warning alerts
if (lossWarnings.length > 0) {
body += '⚠️ LOSS WARNINGS:\n\n';
lossWarnings.forEach(alert => {
body += alert.message + '\n';
body += alert.details + '\n\n';
});
}
// Add footer
body += '═══════════════════════════\n';
body += 'Alert generated: ' + new Date().toLocaleString() + '\n';
body += 'Check your portfolio tracker for full details.\n';
// Send the email
try {
GmailApp.sendEmail(emailAddress, subject, body);
} catch (error) {
Logger.log('Error sending email: ' + error);
}
}
function testEmailAlert() {
// Test function to verify email works
const testAlerts = [
{
symbol: 'TEST',
company: 'Test Company',
type: 'Daily Movement',
message: 'TEST: 5.5% day change (This is a test)',
details: 'Current Price: $100.00 | Shares: 10 | Value: $1,000.00'
}
];
sendAlertEmail(testAlerts);
Logger.log('Test email sent');
}Important: Next to const emailAddress = Replace [email protected] with your Gmail address.
Authorize and Test the Script:
- Save the script (press Ctrl+S or Cmd+S)
- Select function: Choose
testEmailAlertfrom dropdown - Click Run button
- Grant permissions when prompted:
- Click “Review permissions”
- Choose your Google account
- Click “Advanced” : “Go to [Project Name] (unsafe)”
- Click “Allow”
- Check your email for the test message
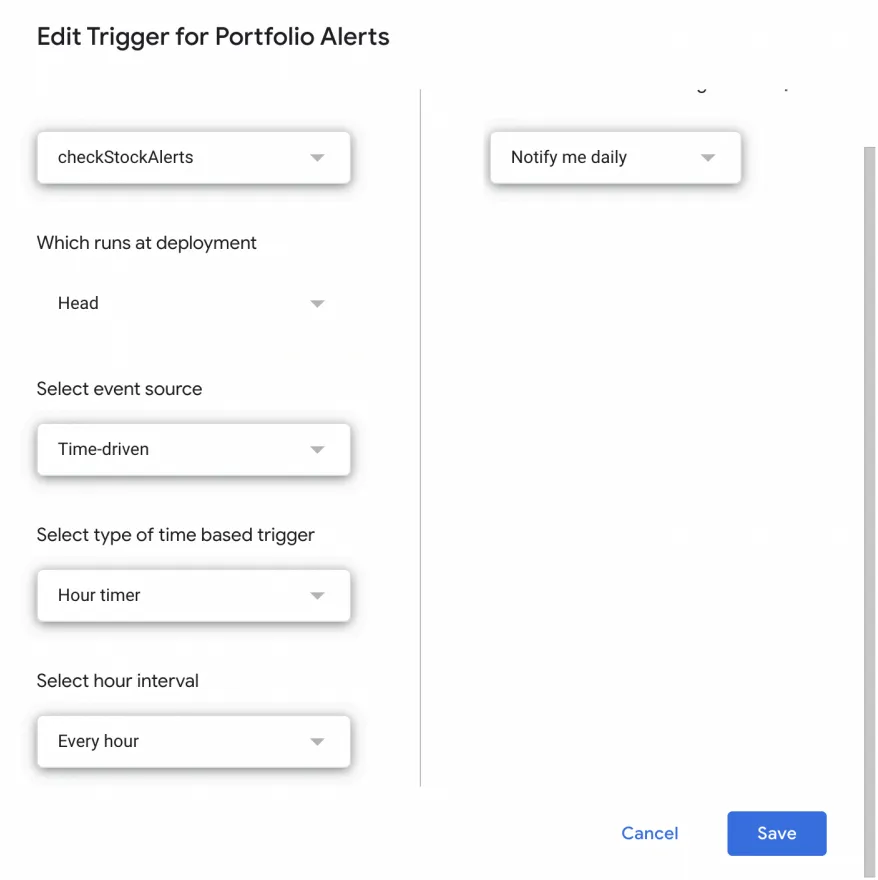
Set Up Automatic Trigger:
- Click the Clock icon in the left sidebar (Triggers)
- Click “+ Add Trigger”
- Configure trigger:
- Function:
checkStockAlerts - Event source: Time-driven
- Type: Hour timer
- Interval: Every hour (or your preference)
- Click Save
Best Practices for Maintenance
Here are some pointers you can follow to keep your investment tracker running smoothly:
- Weekly Review: Open tracker and review performance, check email alerts from the past week & note any significant changes
- Quarterly Analysis: Review sector allocation, assess individual holdings performance and consider rebalancing opportunities
- Annual Audit: Generate annual performance report, export transactions for tax preparation & review and update investment strategy
Conclusion
With multiple investment accounts and dozens of stocks it can be difficult to keep track of your complete portfolio performance. However, now with the help of this Excel tracker with live data feeds, you can be on top of your investments and make informed decisions. With the help of this knowledge, you can now:
- Build a comprehensive investment tracker in Excel Desktop with live stock prices
- Automate calculations for gains, losses, and returns across all positions
- Set up automated email alerts using Google Apps Script for significant price movements
- Track transactions and maintain accurate cost basis for tax purposes
- Monitor portfolio performance across multiple sectors and asset classes
With this system, you’ll never lose track of your investment performance again and can make informed decisions based on real-time data and comprehensive analytics.
Read more:
- Microsoft Excel for Data Analysis
- Advanced Excel for Data Analysis
- 50+ Excel Questions to Ace Your Interview
Frequently Asked Questions
Q1. Should I use Excel Desktop or Excel Online for this tracker?
A. Excel Desktop is strongly recommended for the best experience. It has full Stock data type support for automatic live price feeds. Excel Online has limitations with live data. If you don’t have Excel Desktop, Google Sheets is a better free alternative than Excel Online, as GOOGLEFINANCE works reliably worldwide.
Q2. How many stocks can this tracker handle?
A. The tracker can easily handle 100+ stocks. Excel Desktop performs well with 200+ holdings. Google Sheets handles 1,000+ stocks smoothly. For optimal performance, keep under 200 holdings in Excel, or consider splitting into multiple sheets by account type.
Q3. I’m seeing unrealistic percentages like 6510% in Gain/Loss %. How do I fix this?
A. This error occurs when:
1. The Total Cost formula (Column F) isn’t working: Ensure F2 = =D2*E2
2. Wrong formula in Gain/Loss %: Should be =IF(F2=0,0,I2/F2) not I2/E2
3. Double percentage multiplication: If using Percentage format, remove *100 from formula
Sohan Sethi is a Data Analytics Manager and Content creator passionate about using data, technology, and storytelling to create meaningful impact. With experience in healthcare, analytics, and workflow automation, he has built tools and platforms that streamline processes for thousands of users, combining technical expertise in SQL, Python, Excel, SharePoint, and Power Platform with a people-first approach to problem-solving.
Beyond his professional career, Sohan is dedicated to empowering job seekers and international students through free resources, mentorship, and thought leadership. He has given a TEDx talk and featured in multiple media platforms including Business Insider, CNBC, Fox News, etc. He regularly shares strategies on job search, career growth, and adapting to challenges. His work has inspired professionals worldwide to unlock opportunities and reach their goals.