-
From Scratch to a Story – Introduction to Tableau (Part 1)
Tableau is a very powerful data visualization and analysis tool where you can create business-standard dashboards to visualize & draw insights
Sejal 09 Apr, 2021
-
Data Scientists built a Random Forest Model to predict the World Cup 2018 Winner
Researchers from the University of Dortmund built a random forest model to predict the outcome of every single game of this year's World Cup.
Pranav Dar 10 May, 2019
-
Learning Time Series Analysis & Modern Statistical Models
This blog covers Time-series analysis as a powerful tool for understanding and forecasting patterns and trends in data over time.
Gayathri 25 Jan, 2023
-
10 Jupyter Notebook Tips and Tricks for Beginners
Discover Python tricks in Jupyter Notebook to enhance coding experience and productivity. Learn the magic of Jupyter notebook.
Yana Khare 30 Apr, 2024
-
NoSQL Databases : Simplified
NoSQL databases provide ways to handle Big Data efficiently and flexibility to scale easily. This article introduces types of NoSQL databases.
Tavish Srivastava 26 Jul, 2020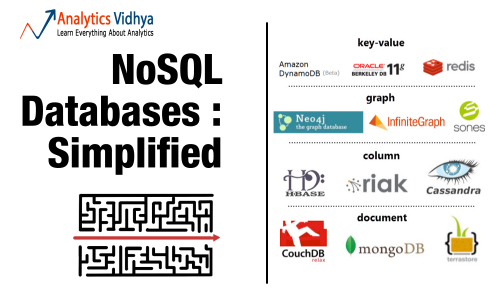
-
Create Your First Dashboard in Tableau
In this article, we are going to design our first dashboard in Tableau to help the superstore team understand the sales number a deeper level
Shipra Saxena 11 Dec, 2023
-
Embed PowerBI report in Jupyter Notebook using “powerbiclient”
In this article, we utilized the powerbiclient to embed the report in the Jupyter notebook using URL and report/group ID.
Himanshu 18 Jun, 2021
-
EMO AI by Alibaba: An Audio-driven Portrait-video Generation Framework
Alibaba's EMO AI, an innovative model in the AI race, bringing your portraits to life with talking or singing animations.
Pankaj Singh 01 Mar, 2024
-
Optimizing Portfolios with the Mean Variance Method in Python
Learn what portfolio optimization is, and how to build a portfolio optimization code using mean variance method in Python.
Likith Chandra 15 Jun, 2023
-
Data Cleansing: How To Clean Data With Python!
Data Cleansing is the process of analyzing data for finding incorrect, corrupt, and missing values to make it suitable for data analytics.
Siddharth 11 Jun, 2021