-
Building a DataFrame from Multiple Files
In this article we see how to build a dataframe using multiple files in Python. It has immense applications and brings in efficiency
Bala 28 Oct, 2024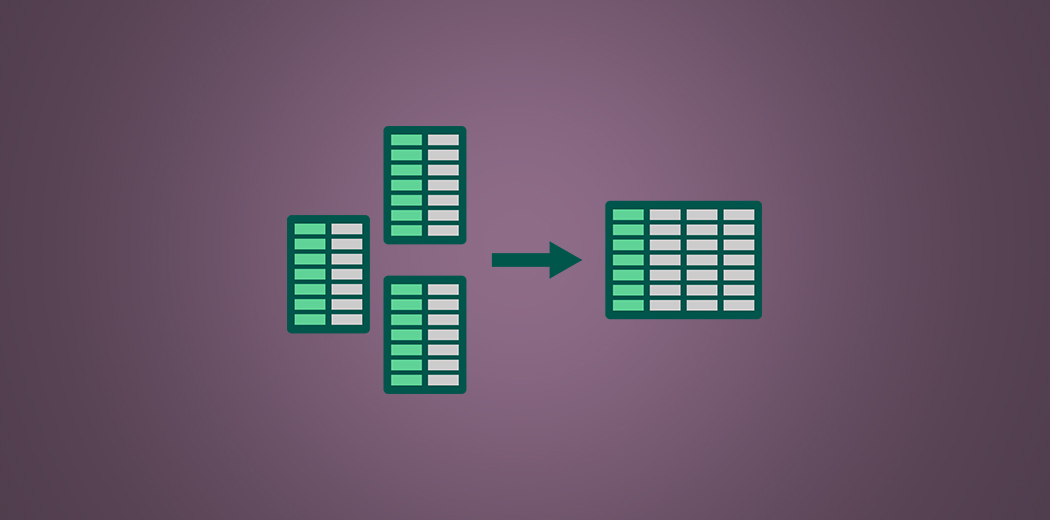
-
An Intuitive Guide to Data Visualization in Python
Data visualization in python is one of the most utilized features for data science. This is a guide to data visualization in python
Aishwarya 12 Nov, 2024
-
Time Series Data Visualization using Heatmaps in Python
Heatmap represents values for the first variable of interest across two axis variables. Lets visualize time series forecasting using heatmaps
niyut 01 Mar, 2021
-
Multicollinearity: Problem, Detection and Solution
Understand multicollinearity, its problems, and measurement methods. Learn how to fix it in your model and calculate VIF with R and Python.
ananyab 17 Jan, 2025
-
Machine Learning Model Deployment using Django
Model Deployment puts you model into use. In this article, you will learn Machine Learning model deployment using Django.
Aniket 21 Oct, 2024
-
How to Create a Donut Chart in Tableau?
Donut chart in Tableau is a super useful chart in any setting. Here is a tutorial on how you can create a donut chart in Tableau with ease.
Pranav Dar 29 Sep, 2023
-
Essential Statistical Concepts for Data Cognizance
Statistical Concepts not only enables us to fathom the data we have but also gives better direction to Analysis and better decision making
Asmath 13 Feb, 2021
-
A Beginner’s Guide To Seaborn: The Simplest Way to Learn
Seaborn’s greatest strengths are its diversity of plotting functions. This article is a step-by-step guide to getting started with Seaborn.
Shelvi 27 Oct, 2024
-
Introduction to Exploratory Data Analysis (EDA)
Explore types of Exploratory Data Analysis: Univariate, Bivariate, & Multivariate. Learn techniques to handle missing data and gain insights!
Nikhil 01 May, 2025
-
Diminishing the Dimensions with PCA!
This article will give you clarity on what is PCA for dimensionality reduction, its need, and how it works with implementation in Python
Prathamesh 21 Oct, 2024
