-
Understanding Data Science from a Beginner’s Lens
Data Science is the field of study of data, which in its raw form is meaningless. Let us understand data science further in this article.
Ayan 16 Mar, 2021
-
Beginner’s Guide to Support Vector Machine(SVM)
In this article, we are going to see what is SVM and how SVM works and the different kernel functions used by the algorithm to predict
Shipra Saxena 12 Mar, 2021
-
Kaggle Grandmaster Series – Exclusive Interview with Kaggle Notebooks Grandmaster Tarun Paparaju (#Rank 25)
In the 22nd edition of the Kaggle Grandmaster Series, we are thrilled to be joined by Kaggle Notebooks Grandmaster Tarun Paparaju
Analytics Vidhya 08 Mar, 2021
-
Customer Loyalty Program with Python
Let's build a customer loyalty program with python-Dash to segment our customers to make data-driven decisions to improve customer loyalty.
Amit 17 Mar, 2021
-
Stock Options Chain Analysis Using Excel
In this article, we will be focusing on one particular type of stock analysis termed as the Options Chain analysis using Excel. Read Now!
[email protected] 27 Sep, 2024
-
Data Scientist’s Guide to Logistic regression
Logistic Regression is a mathematical model used in statistics to estimate the probability of an event occurring using some previous data
Shipra Saxena 05 Mar, 2021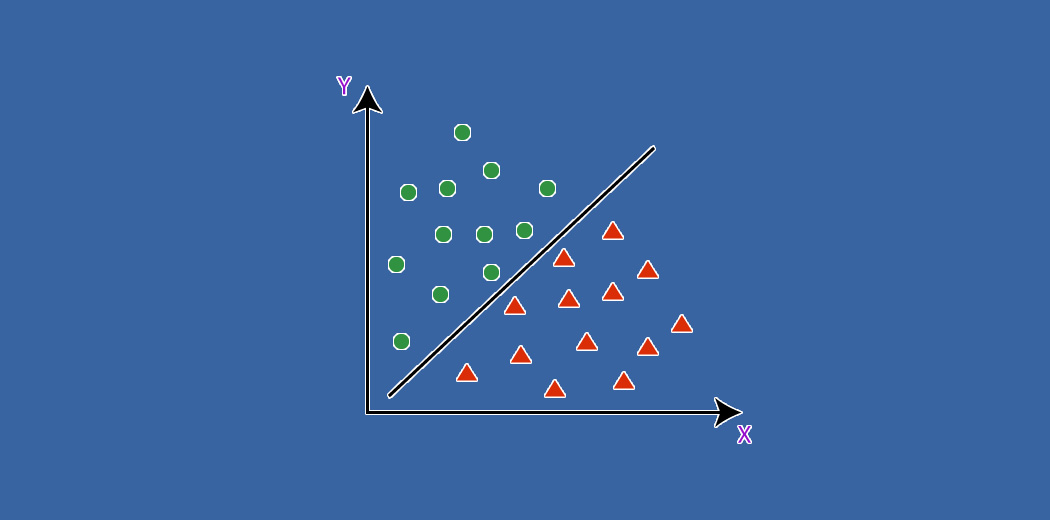
-
Axioms of Probability Every Data Scientist Should Know!
Axioms of probability is one of the fundamental concepts of probability. In this article we understand the 3 axioms of probability in detail
Himanshi Singh 12 Mar, 2021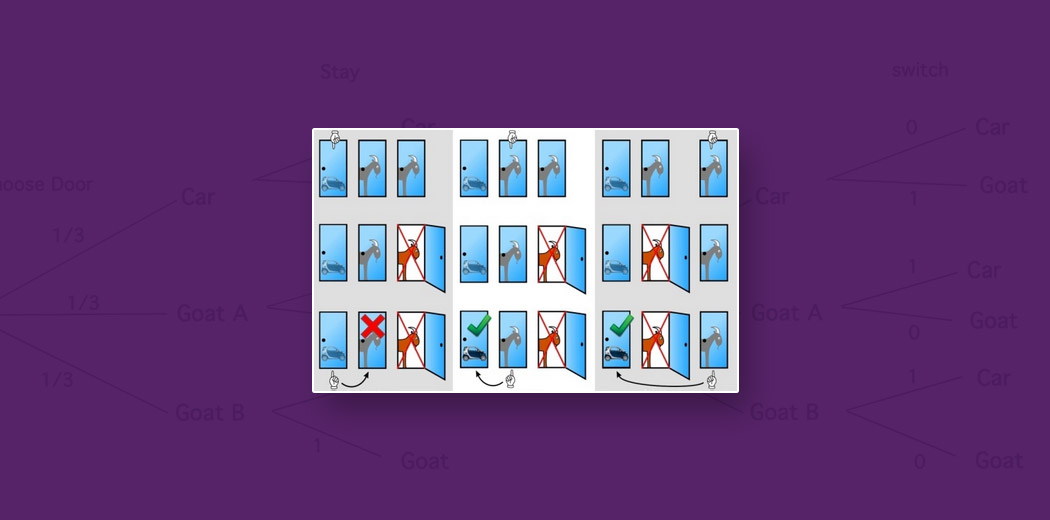
-
Data Validation and Data Verification – From Dictionary to Machine Learning
Data validation and verification are often used interchangeably when we talk about data quality. Learn the difference between them
aditya 16 Mar, 2021
-
International Space Station(ISS) Detector using Python
In this article we are going to create our own International Space Station(ISS) detector using Python and test it to see if it works
Shrish 05 Mar, 2021
-
Understanding Gradient Descent Algorithm
Gradient descent is a first-order iterative optimization algorithm. In this article, learn how does gradient descent work and optimize model
Shipra Saxena 21 Feb, 2024
