-
Complete Solution: How I got in Top 11% of Kaggle Telstra Competition ?
This is a complete solution of machine learning data mining competition Kaggle Telstra network disruption competition using xgboost ensemble
Aarshay Jain 02 Aug, 2019
-
10 Questions R Users always ask while using ggplot2 package
This is a tutorial on creating maps, scatter plots, bar plots, box plots, heat maps, area chart, correlogram using ggplot package in R
Analytics Vidhya 24 Jun, 2022
-
Tutorial on 5 Powerful R Packages used for imputing missing values
Learn about powerful R packages like amelia, missForest, hmisc, mi and mice used for imputing missing values in R for predictive modeling in data science.
Analytics Vidhya 05 Jul, 2020
-
XGBoost Parameters Tuning
Explore XGBoost parameters and hyperparameter tuning like learning rate, depth of trees, regularization, etc. to improve model accuracy.
Aarshay Jain 03 Dec, 2025
-
A Complete Tutorial to learn R Programming for Data Science from Scratch
Learn R Programming For Data Science, data manipulation, machine learning, with our guide covering everything from installation to predictive modeling.
Analytics Vidhya 06 Oct, 2025
-
Guide to Build Better Predictive Models using Segmentation
A perfect guideline for doing optimal segmentation for model development. In this article learn about building predictive models using segmentation.
Guest Blog 05 Jul, 2020
-
Quick Insights: India Analytics and Big Data Salary Report 2016
Here are quick insights from India analytics & big data salary report 2016. Salary trends by data science tools, techniques, skills and location
Kunal Jain 05 Aug, 2016
-
Hewlett Packard Enterprise in association with Imarticus Learning presents LIVE WEBINAR on “NEXT BEST OFFER”
Imarticus Learning and Hewlett Packard Enterprise (HPE) present to you a joint webinar on the ‘Next Best Offer’ Analytics.
Analytics Vidhya 23 Feb, 2016 -
India Exclusive: Analytics and Big Data Salary Report 2016
This report conveys key analysis of job roles in analytics industry in India featuring important tools, cities, experience in data analytics
Kunal Jain 31 Jan, 2017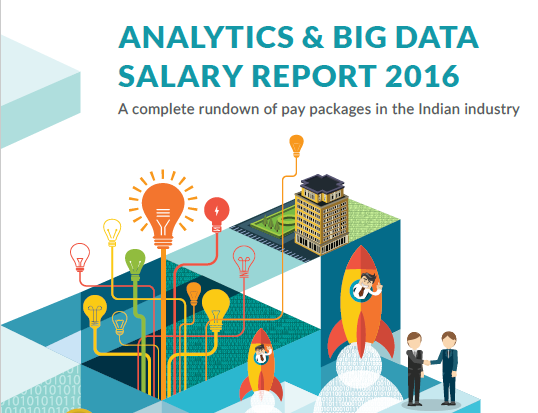
-
Complete Machine Learning Guide to Parameter Tuning in Gradient Boosting (GBM) in Python
Take your GBM models to the next level with hyperparameter tuning. Find out how to optimize the bias-variance trade-off in gradient boosting algorithms.
Aarshay Jain 04 Apr, 2025