This article was published as a part of the Data Science Blogathon
Introduction
A Pandas DataFrame is a 2-dimensional data structure present in the Python, sort of a 2-dimensional array, or a table with rows and columns. DataFrames are most widely utilized in data science, machine learning, scientific computing, and lots of other fields like data mining, data analytics, for decision making, and many more.
Pandas DataFrames are in tabular format and we can also apply styles over these DataFrames to make them more interactive and easy to understand. Like if we want to highlight any particular value or tuple present in the DataFrame we can style it with the help of the style class of Pandas DataFrame.
Pandas DataFrame Styler
We can apply any type of conditional formatting to the DataFrame and visualize the styling of a DataFrame depending on the condition on data within, by using the DataFrame.Style property. This property returns pandas. Styler object that has varied helpful ways for data formatting and displaying DataFrames.
The styling is accomplished using CSS. We will write “style functions” that would be taken as scalars (single values representing one unit of data), DataFrame or series, and return like-indexed DataFrames or Series along with CSS “attribute: value” pairs for that values.
These functions are gradually passed to the Styler class that collects all the styles through the functions before rendering.
Let’s understand the various styles to add to Pandas DataFrame one by one:
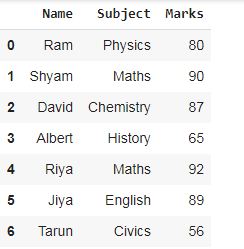
For example, we will create a DataFrame that contains the result of students like their Names, Subject, and Marks. We will apply the various type of styles to the DataFrame and on its values. Let’s get started.
Setting DataFrame Table Style
To add style to the table we will use the set_table_style() method of the Styler class in the Pandas module. Let’s see the example:
#importing the pandas module
import pandas as pd
#creating a simple DataFrame
Result = {'Name': ['Ram', 'Shyam', 'David', 'Albert', 'Riya', 'Jiya', 'Tarun'],
          'Subject': ['Physics', 'Maths', 'Chemistry', 'History', 'Maths', 'English', 'Civics'],
      'Marks': [80, 90, 87, 65, 92, 89, 56]}
df = pd.DataFrame(Result)
#Show df
df
#adding color to border of table
df.style.set_table_styles([{'selector' : '','props' : [('border','5px solid green')]}])
Output:
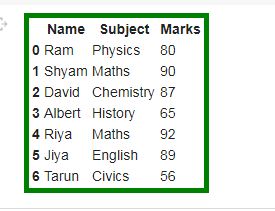
In the example, we can see that the border color is applied. And by seeing the code we also understood that the styling is applied in the form of CSS like we apply CSS for any HTML page.
Applying background color to DataFrame
To apply background color to the DataFrame we will use Styler.set_properties method. Let’s see the example:
#importing the pandas module
import pandas as pd
#creating a simple DataFrame
Result = {'Name': ['Ram', 'Shyam', 'David', 'Albert', 'Riya', 'Jiya', 'Tarun'],
          'Subject': ['Physics', 'Maths', 'Chemistry', 'History', 'Maths', 'English', 'Civics'],
      'Marks': [80, 90, 87, 65, 92, 89, 56]}
df = pd.DataFrame(Result)
#applying backgound color
df.style.set_properties(**{'background-color': 'black',
                           'color': 'cyan',
                           'border-color': 'white'})
Output:
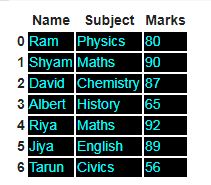
In this example background color is set to black font color is set to cyan and the border color is white. Again the code is written in the CSS format.
Highlighting the specific values:
We can also highlight any specific value present in the DataFrame with style. Like, add a specific colour to the value or on its background. In this example, we will Highlight the minimum and maximum marks of students. Let’s see the example:
#importing the pandas module
import pandas as pd
#creating a simple DataFrame
Result = {'Name': ['Ram', 'Shyam', 'David', 'Albert', 'Riya', 'Jiya', 'Tarun'],
          'Subject': ['Physics', 'Maths', 'Chemistry', 'History', 'Maths', 'English', 'Civics'],
      'Marks': [80, 90, 87, 65, 92, 89, 56]}
df = pd.DataFrame(Result)

#applying highlight_max()
df.style.highlight_max()
#applying highlight_min()
df.style.highlight_min()
Output:
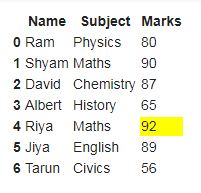
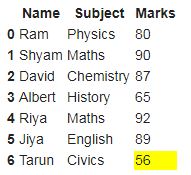
We can see that the highest mark is 92 given to Ria in Maths and the lowest mark is 56 given to Tarun in Civics. The max and min operations can only be applied to numerical columns.
Adding bar charts in the DataFrame:
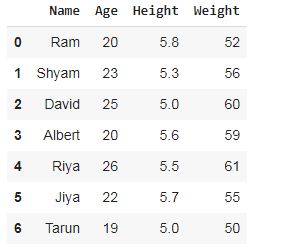
We can add bar charts in the DataFrame depending on the values of the column. In this example, we have information about students like Name, Age, Height, and Weight. We will add a bar chart to the numeric columns. Let’s see the example:
#importing the pandas module
import pandas as pd
#creating a simple DataFrame
Info = {'Name': ['Ram', 'Shyam', 'David', 'Albert', 'Riya', 'Jiya', 'Tarun'],
        'Age': [20, 23, 25, 20, 26, 22, 19],
        'Height': [5.8, 5.3, 5.0, 5.6, 5.5, 5.7, 5.0],
        'Weight': [52, 56, 60, 59, 61, 55, 50]}
df = pd.DataFrame(Info)
#Show df
df
#adding bar chart
df.style.bar(subset=['Age', 'Height', 'Weight'], color='lawngreen')
Output:
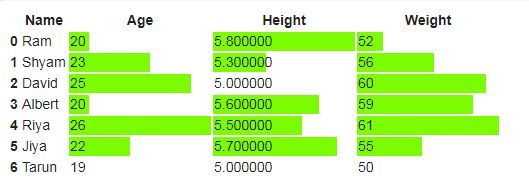
The bar charts are added depending upon the values of the columns.
Adding gradient background to DataFrame:
We cab add gradient colors also to the background of the DataFrame. For adding gradient colors we have to import the seaborn module also. Let’s see the example:
#importing the pandas module
import pandas as pd
#creating a simple DataFrame
Info = {'Name': ['Ram', 'Shyam', 'David', 'Albert', 'Riya', 'Jiya', 'Tarun'],
        'Age': [20, 23, 25, 20, 26, 22, 19],
        'Height': [5.8, 5.3, 5.0, 5.6, 5.5, 5.7, 5.0],
        'Weight': [52, 56, 60, 59, 61, 55, 50]}
df = pd.DataFrame(Info)
#importing seaborn module
import seaborn as sns
#getting the color palette
cm = sns.light_palette("orange", as_cmap=True)
#applying on dataframe
df.style.background_gradient(cmap=cm)
Output:
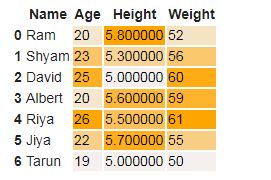
The gradient color style added to the background of the DataFrame.
In this blog, we have seen various styles which can be added to a DataFrame for more interactive visualization of DataFrames. Do let me understand if there is any comment or feedback.
Thanks for reading.
The media shown in this article are not owned by Analytics Vidhya and are used at the Author’s discretion.


