This article was published as a part of the Data Science Blogathon.
Introduction
Hello to everybody! I hope everything is going well. In this post, we’ll talk about pandas, another crucial and fascinating subject. We all know that the data science field is one of the most in-demand areas for study and employment. Among the numerous programming languages that may be used for data science projects, Python is currently leading the pack. One of its major advantages is the use of libraries. And in this post, we’ll examine Pandas, one of the well-known and essential libraries for data research. Pandas is a crucial library for the field of data science.
What is Pandas library?
– Panel library
– Mainly used for data manipulation (single and multiple dimensional data structures) and data analysis

Pandas – Installation Process
Although there are a lot of IDEs and workspaces available for Python programming, I usually like to use Jupyter Notebook on Anaconda Platform. To install any packages in Jupyter Notebook, simply add the ‘!’ symbol before the pip command as seen below.
– pip install pandas
– conda update pandas
– conda update pandas==0.11.0
By default, panda’s library is pre-installed in any IDE. If not means, you can install by the above-mentioned codes or even you can install particular versions.
So, once all the process gets over, the first and foremost thing is to import the library to proceed further, hence
#importing library
import numpy as np
import pandas as pd
Data structures in Pandas
There are mainly two different data structures,
– Single Dimensional (Series) – if the data is in a one-dimensional array, then we call it a Series format
– Multi-Dimensional (Data frame) – if the data is more than a one-dimensional array, like two or three or even more, then we call it a DataFrame format.
In order to see the full code of pandas, please click the GitHub link, https://github.com/anandprems/Pandas-library—A-must-know-library-in-Data-Science
Pandas – Series Object:
First, we will see how and what we can do with the series data structure in Pandas library,
Python Code:
import pandas as pd

series_ = pd.Series([16,20,26,8,2022])
print(series_)
we know, in order to check the type of the variable,
type(series_)
so these are the very initial levels of understanding of wrt series data structure in pandas. First will see how to change the index of the series,
series_1 = pd.Series([16,20,26,8,2022], index=['S','A','N','K','Yr'])
series_1
anything we can give within the single quote to change our index. We all know a dictionary is one kind of special data collection type. So what is the connection between dictionary and series in pandas, we will see it in the upcoming code,
#dictionary type can be written as
dict_ = {'S':16, 'A':20, 'N':26, 'K':8, 'Yr':2022}
dict_
#how to change from series object to dictionary type
series_2 = pd.Series({'S':16, 'A':20, 'N':26, 'K':8, 'Yr':2022})
series_2
so it’s not only with the help of dictionary keyword to convert, we have an option in pandas too. So can we change the order of the index, YES!, that’s the flexibility of the pandas library,
series_3 = pd.Series({'S':16, 'A':20, 'N':26, 'K':8, 'Yr':2022}, index = ['Yr','K','N','A','S','Chumma'])
series_3
So, suppose if we want to extract some particular information or data from the series object means,
series_ = pd.Series([16,20,26,8,2022])
series_[0]
series_[4]
and if you are using index value for the extraction process, then it should be within the range as like mentioned above, and it should not be like,
series_[5]
And there are also, other ways to extract information from series are as,
series_[-1:]
series_[-3:]
series_[:4]
Apart from the extraction, if you ask, can we perform some basic mathematical operations,
series_ + 2
series_ - 2
series_ *2
And not only that, we can perform,
series1_ = pd.Series([16,20,26,8,2022])
series2_ = pd.Series([16,20,26,8,2022])
series1_ + series2_
series1_ - series2_
series1_ * series2_
series1_ / series2_
So, series data structure, not only perform with numbers, we can do with strings too,
series3_ = pd.Series(['i','love','to','learn','python','language'])
series3_
with strings some functions like,
series3_.str.upper()
series3_.str.lower()
and also we can perform concatenation operations too,
series1_ = pd.Series([16,20,26,8,2022])
series2_ = pd.Series([16,20,26,8,2022])
pd.concat([series1_, series2_])
but if you look into this, we won’t be able to achieve proper output, we need to do some parameter tuning wrt rows and columns,
pd.concat([series1_, series2_], axis = 1)
then we can do sorting operations to,
sort1 = np.array([3,4,6,4,2,7,1,9])
sort1.sort()
sort1
So, I hope we get to know some basic knowledge about series data structure in the pandas library. And we won’t be using this kind of data all the time, hence if we go for real-time or tabular kind of data, then we go for another type called DataFrame.
Pandas – DataFrame Object:
If the data or dataset, has rows and columns or we can say, the dataset is in tabular format then we call the particular data structure as DataFrame in pandas. We will see some important functions and operations related to this particular type,
df_ = pd.DataFrame({"Name":['San','Prem','Bhubhu','Pinky'], "Data":[16,20,26,8]})
df_
and again we you need to know about the type,
type(df_)
we create some random multiple arrays,
data = {'Name':['San', 'Prem', 'bhubhu', 'pinky'],
        'Age':[34, 34, 5, 0.6],
        'BP':['Palacode', 'Palacode', 'Chennai', 'Chennai'],
        'Professional':['Doctor', 'Engineer', 'Student', 'Infant']}
data
the above format can be converted into dataframe by,
df_1 = pd.DataFrame(data)
df_1
and suppose if you want to choose a particular column, then
df_1[[‘Name’, ‘Professional’]]
we can perform sorting operations too,
sort2 = np.array([[2,1,8],[6,2,3],[8,2,6]])
sort2.sort()
sort2
So will see a brief about the usage of Pandas library with the help of the dataset,
I am using the IRIS dataset, https://www.kaggle.com/datasets/uciml/iris you can download the dataset from the given Kaggle link.
First, we will see about the loading of the dataset and viewing too,
dataset = pd.read_csv('iris.csv')
dataset
In order to visualize the dataset, with any particular feature or we call column then,
dataset['SepalLengthCm'].plot(kind='hist', title='details of sepallength in cm', bins=50)
Suppose if you want to delate any particular single column then
dataset2 = dataset.drop(dataset.index[2])
dataset2
dataset2 = dataset.drop("SepalLengthCm", axis=1)
dataset2
In the same way, you can delete multiple columns too,
dataset3 = dataset2.drop(["SepalWidthCm","PetalLengthCm"], axis=1)
dataset3
and the opposite way of adding any new feature or column,
dataset3['blabla'] = "23456"
dataset3
after editing the dataframe, if you want to save the file externally in .csv format then
dataset3.to_csv('edited_iris_dataset.csv')
apart from the real-time dataset, manually if you want to use pandas to load,
dataset1 = [[120, 2400, 603],
            [312, 1565, 465],
            [953, 5890, 545.],
            [1699, 2430, 590]]
dataframe1_ = pd.DataFrame(dataset1, index = [1,2,3,4], columns = ['x', 'y', 'z'])
print(dataframe1_)
some of the built-in functions of pandas that can be used for any dataset to get information are as,
dataset.head() #default top 5 rows with all columns
dataset.head(10) #customized visibility
dataset.tail() #bottom 5 rows with all columns
dataset.shape #dimentionality
dataset.dtypes #column types
dataset.index
dataset.columns
dataset.describe() #basic statistics
dataset.mean() #mean statistics
dataset.median() #median statistics
dataset.min() #minimum value
dataset.max() #maximum value
dataset.to_numpy
dataset.to_numpy() #dataframe to number or array format
dataset.sort_index(axis=1, ascending=False) #sorting
dataset.sort_index(axis=1, ascending=True) #sorting
dataset.sort_values(by='PetalLengthCm') #sorting by columns
dataset[dataset['PetalWidthCm']>2] #logical understanding
dataset[dataset['PetalWidthCm']>10]
dataset.isnull() #missing values any
dataset.isnull().count()
pd.isna(dataset)
dataset['PetalLengthCm'] #one column
dataset[1:10] #data extraction
dataset.iloc[1:5, 1:3] #data extraction
dataset.loc[1:5, ("SepalWidthCm", "PetalWidthCm")] #data extraction
dataset.drop('Id', axis=1) #for column -1 #dropping least important columns from dataset
#dropping least important columns from dataset
dataset.drop([2,3], axis=0) #for column -0
#groupby concept
dataset.groupby('Species').SepalLengthCm.mean()
dataset[dataset.Species=='Iris-virginica'].SepalLengthCm.mean()
dataset.groupby('Species').SepalLengthCm.max()
dataset.groupby('Species').SepalLengthCm.agg(['count','mean','max','min'])
dataset.groupby('Species').mean()
dataset.groupby('SepalLengthCm').sum()
dataset.apply(np.cumsum)
dataset.value_counts()
dataset.stack()
dataset.unstack()
pd.pivot_table(dataset, index=['SepalLengthCm','SepalWidthCm'])
Pandas with Lambda
Not only it can work individually but also Pandas can combine with other functions to make our easier, one among them here is Lamba.
dataset.apply(lambda x: x.max())
dataset.apply(lambda x: x.min())
Pandas – Visualization
Apart from data manipulation and data analysis, pandas can be used to visualize the data’s too
dataset.groupby('Species').mean().plot(kind='bar')
import matplotlib.pyplot as plt
dataset['SepalLengthCm'].hist()
plt.show()
dataset.plot.line(x ='SepalLengthCm', y ='SepalWidthCm')
plt.show()
dataset.plot.scatter(x ='SepalLengthCm', y ='SepalWidthCm')
plt.show()
dataset.plot.box()
plt.show()
dataset['SepalLengthCm'].plot.kde()
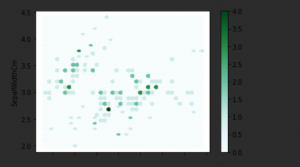
dataset.plot.hexbin(x ='SepalLengthCm', y ='SepalWidthCm', gridsize=40)
plt.show()
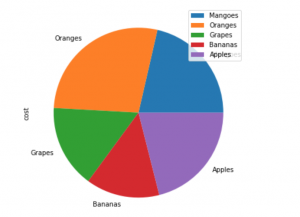
dataset1= pd.DataFrame({'cost': [61, 79, 45, 40 , 60]},index=['Mangoes','Oranges', 'Grapes','Bananas', 'Apples'])
dataset1.plot.pie(y='cost', figsize=(8, 6))
plt.show()
Advantages of Panda
– For a better understanding of data and its representation
– As functions are more, we can extract more work
– Filtering and segmentation can be done in real-time datasets
– Customizing the dataset
Disadvantages of Panda
– Lots of effects need to be put into the dataset for certain functions for a better understanding
– Syntax of functions present in pandas’ library is not user friendly
Applications of Panda
– Data Science
– Data Analytics
– Natural Language Processing
– Statistics
– Recommendation System and many more
Conclusion
The learners should now have some insight into the most significant Pandas library, I hope. Pandas may be used for more than just data analysis and manipulation; using this library, we can extract the most information possible through statistical analysis, visual representation, and integration with other well-known functions like lambda. There are still a lot of things we need to learn, even though the information I presented here is fundamental and helpful for the projects we will be utilising. In the future columns, I’ll be revealing. I appreciate you taking the time. Go on reading!
The media shown in this article is not owned by Analytics Vidhya and is used at the Author’s discretion.
Premanand S is a dedicated academic with over a decade of research experience specializing in Bio-signal Processing, Machine Learning, and Deep Learning. He earned his B.Tech in 2009 from Amrita Vishwa Vidyapeetham, Bangalore, and completed his M.E. in 2011 from Rajalakshmi Engineering College, Chennai, where his thesis focused on Deep Learning for ECG Signal Processing.
Currently pursuing his Ph.D. at VIT-Chennai, his research, titled "Deep Learning Approaches for Enhanced ECG Signal Processing and Arrhythmia Classification," aims to leverage cutting-edge deep learning techniques to improve the accuracy and efficiency of ECG signal analysis, contributing significantly to advancements in cardiac health monitoring.
A recipient of the prestigious TCS-RSP (Research Scholarship) in 2014, Cycle 9, Premanand has established himself as a recognized figure in the academic community. He has been invited to deliver talks on Data Science, Machine Learning, and Deep Learning at prominent institutions across India, sharing his expertise and insights with researchers and students alike.
As an Assistant Professor at VIT-Chennai, he continues to mentor and inspire the next generation of researchers while pushing the boundaries of knowledge in his field.


