Efficient decision-making is the result of combining information, analysis, and effectiveness. That’s why businesses of all types and sizes are embracing data visualization, albeit often with a simplified approach. Power BI and Tableau, popular and user-friendly data visualization tools, help businesses organize large datasets. While both software are crucial for efficient data organization, comparing Power BI vs Tableau allows us to optimize their features based on our specific requirements. They have distinct differences and shared similarities. This section explores their advantages and disadvantages, helping you determine which one is the ideal contributor for your business.
Table of contents
- Power BI vs Tableau – Overview
- What is Power BI?
- What is Tableau?
- Key Differences Between Power BI vs Tableau
- Similarities Between Power BI and Tableau
- Use Cases and Industry Applications of Power BI vs Tableau
- Factors to Consider When Choosing Between Power BI vs Tableau
- Power BI vs Tableau: Which is Better?
- Frequently Asked Questions
Power BI vs Tableau – Overview
From interface and performance to data preparation and analytics, there are multiple factors contributing to the difference between Power BI and Tableau. Have a look.
| Aspect | Power BI | Tableau |
|---|---|---|
| User Interface and Ease of Use | Suited for Microsoft tool users | Flexible and highly tailored visualizations |
| Data Preparation and Cleansing Capabilities | Similar capabilities | Tableau Prep offers advanced data preparation |
| Data Visualization Options and Flexibility | Limited customization compared to Tableau | Extensive visualization options and flexibility |
| Advanced Analytics and Predictive Modeling | Steadily improving, but Tableau has more features | Supports complex calculations, statistical analysis, forecasting, and clustering |
| Integration with Other Tools and Platforms | Seamless integration with Microsoft products | Broad native integration with various platforms |
| Pricing and Total Cost of Ownership | Freemium model (free version and subscription-based paid version) | Traditional licensing model based on users or cores |
What is Power BI?
Power BI is a data visualization tool that enables businesses to connect to various data sources, clean the data, and create interactive visualizations, reports, and dashboards. Developed by Microsoft, the tool provides a user-friendly interface that allows teams to explore data, discover insights, and share them with others in an organization.
Features and Capabilities of Power BI
Power BI enables businesses to analyze data and share insights across organizations, helping to make data-driven decisions. Some of the key features of Power BI include:
- A wide of visualizations and data sources
- Customizable dashboards
- Easy-to-use interface
- Q&A box for faster navigation to desired information
- Report sharing
Data Connectivity Options and Integration with Various Data Sources
Power BI allows businesses to connect to a wide range of data sources, such as cloud services, spreadsheets, online services and the list goes on. It supports both on-premises and cloud-based data sources, which makes it flexible for both accessing and consolidating data from multiple systems.
Visualization Options and Interactive Dashboards
Power BI offers a strong set of interactive visualizations with which you can explore data. It includes various chart types like line charts, pie charts, bar charts, maps, and gauges. You can customize the visual appearance, apply filters, and drill down into details to gain deeper insights. Moreover, dashboards in Power BI provide a sweeping overview of key metrics and KPIs and the reports highlight a detailed analysis with visuals.
Collaboration and Sharing Capabilities
The tool enables collaboration and sharing of reports and dashboards within organizations. You can publish reports to the Power BI service and share them with specific individuals or groups. It also provides features like commenting, annotations, and real-time collaboration, allowing teams to work together on data analysis and decision-making.
Pricing and Licensing Models
Power BI’s desktop model is free and the tool also comes for a free trial for its versions. It typically has three pricing models:
- Power BI Pro: $9.99/ user/ month
- Power BI Premium: $20/ user/ month
- Power BI Premium: $4,995/ capacity/ month
Tableau vs Power BI: pros and cons
Tableau Pros:
Easy to Use: Tableau is straightforward to learn and lets you make visuals by dragging and dropping stuff.
Looks Nice: You can make your data look really cool with Tableau. It offers lots of ways to show information in pretty pictures.
Smart Analysis: Tableau can help you dig deep into your data to find interesting trends or predictions.
Helpful Community: If you get stuck, there are lots of other Tableau users who can give you tips and tricks.
Works for Big Stuff: Tableau can handle lots of data and make complex visuals, which is great for big companies.
Cons:
Costly: Tableau can be expensive, especially if you’re a small business or just starting out.
Takes Time to Master: While it’s easy to start, becoming an expert in Tableau might take some time and practice.
Limited Connections: Sometimes it’s tricky to connect Tableau to all the different types of data you might have.
Needs Good Computer: Making fancy visuals in Tableau can slow down your computer if it’s not powerful enough.
Power BI: Pros:
Fits with Microsoft Stuff: If you use Microsoft programs like Excel or Azure, Power BI works really well with them.
Affordable: You can use Power BI for free or get more features with paid versions, which is great for smaller businesses.
Easy to Learn: Power BI is pretty easy to understand, especially if you’re used to working with Excel.
Connects Easily: It’s simple to connect Power BI to different types of data Modeling without needing extra tools.
Sharing Made Easy: You can easily share your reports and dashboards with others, which is handy for teamwork.
Cons:
Not as Customizable: While Power BI has good visuals, you might not be able to customize them as much as with Tableau.
Can Get Slow: Sometimes Power BI might struggle with big data or complex calculations, especially online.
Data Setup Can Be Tricky: Setting up your data in other BI tools can be a bit complicated, especially if you’re not used to databases.
Works Best with Microsoft: If you don’t use Existing Microsoft Systems , you might run into some compatibility issues with Power BI Interface.
What is Tableau?
Tableau is a data visualization and business intelligence software that brings with itself a user-friendly interface allowing you to create interactive and visually appealing charts, graphs, dashboards, and reports. The tool has been in the use by businesses for a good time now, thanks to its powerful features and ability to connect to various data sources.
Features and capabilities of Tableau
Tableau is widely used in different sectors, including finance, marketing, and supply chain. The tool has gained momentum for its advanced analytics capabilities that allows organizations and individuals to be efficient at decision-making. Here are some of the key features of Tableau:
- Dashboard with a consolidated view
- Collaboration and sharing on multiple platforms
- Live and interactive dashboards
Data connectivity options and integration with various data sources
Tableau can connect to various data sources, including databases, spreadsheets, cloud services, and big data platforms. It supports direct connections or data extraction and provides options for real-time or scheduled data updates.
Visualization options and interactive dashboards
With Tableau, you can visually explore your data in multiple ways. It supports a wide range of chart types, such as bar charts, line charts, scatter plots, maps, and more. Users can interact with the visualizations, drill down into details, apply filters, and dynamically change parameters. Tableau enables the creation of interactive dashboards, where you can combine multiple visualizations into a single view.
Collaboration and Sharing Capabilities
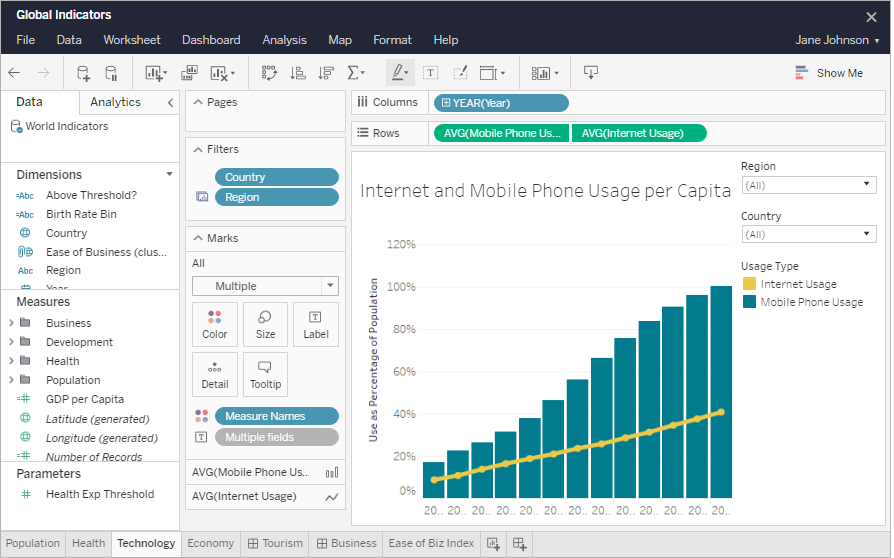
Tableau provides collaboration features that enable multiple users to work on the same project simultaneously. It allows for sharing visualizations and dashboards with others within the organization or publicly on the web. Tableau Server and Tableau Online facilitate secure sharing, publishing, and embedding of interactive visualizations.
Pricing and Licensing Models
Tableau has split pricing models between three user types:
- Tableau Creator: $70/ user/ month
- Tableau Explorer. $42/ user/ month
- Tableau Viewer: $42/ user/ month
Key Differences Between Power BI vs Tableau
Power BI and Tableau are both popular business intelligence and data visualization tools that offer powerful capabilities for data analysis, but they have some key differences. Here are the main differences between Power BI and Tableau:
Company and Integration
- Power BI: Developed by Microsoft, Power BI is tightly integrated with other Microsoft products like Excel, Azure, and Office 365, making it a preferred choice for organizations already using the Microsoft ecosystem.
- Tableau: Developed by Tableau Software (now part of Salesforce), Tableau is platform-independent and can easily integrate with various data sources and other third-party tools.
User Interface and Ease of Use
- Power BI: Power BI has a user-friendly and intuitive interface, making it more accessible to users who are familiar with Microsoft products. It is relatively easier to learn for individuals with basic Excel skills.
- Tableau: Tableau’s user interface is known for its flexibility and interactive visualization capabilities. While it may have a steeper learning curve, it offers more sophisticated customization options for experienced data analysts.
Data Connectivity and Transformation
- Power BI: Power BI has robust data connectivity with a wide range of data sources, including cloud-based services like Azure and online data platforms. Its data transformation capabilities are strong, especially with Power Query, enabling users to clean and prepare data effectively.
- Tableau: Tableau also supports various data connections, but its data transformation capabilities are comparatively limited. Users may need to rely on other tools for extensive data cleaning and transformation.
Pricing and Licensing
- Power BI: Power BI offers competitive pricing and various licensing options, including a free version with limited features and paid plans for individual users and enterprises.
- Tableau: Tableau’s licensing costs tend to be higher than Power BI, which may be a consideration for smaller organizations with budget constraints.
Data Visualization and Interactivity
- Power BI: Power BI offers strong data visualization capabilities and provides interactive dashboards and reports, but some advanced features may require additional development or customization.
- Tableau: Tableau is well-regarded for its powerful data visualization capabilities and ease of creating interactive visualizations, making it a preferred choice for data analysts and data-driven organizations.
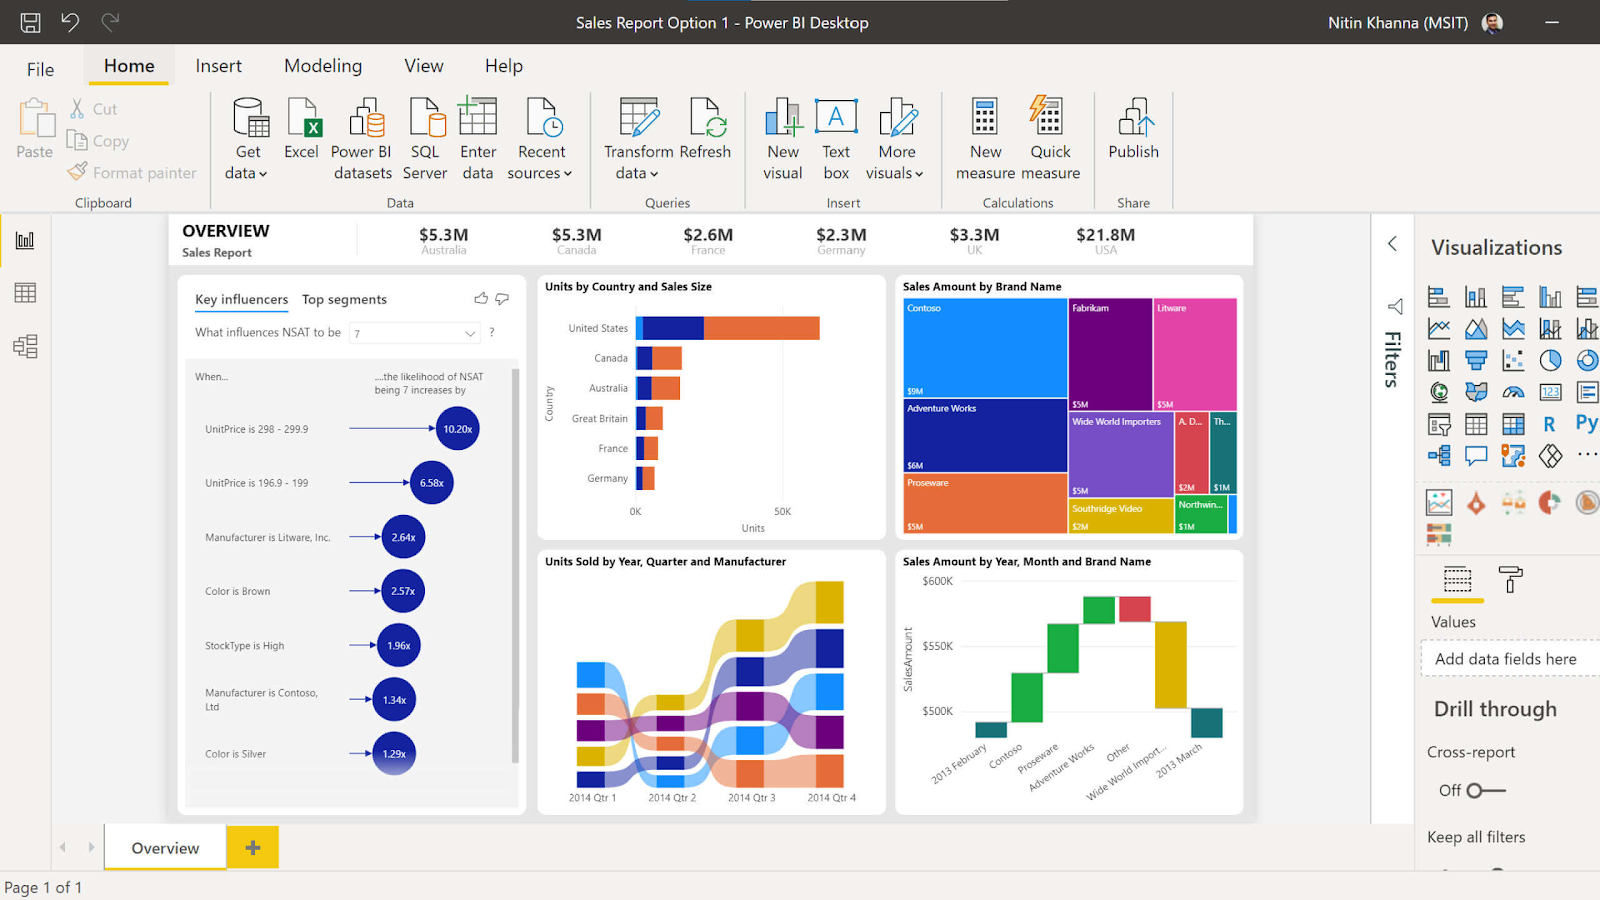
Microsoft Power Bi
Microsoft Power BI is a versatile tool that empowers businesses to gain deeper insights into their data. Here’s a simplified breakdown of its functionalities:
Getting Data: Power BI Desktop can seamlessly gather data from various sources such as spreadsheets, databases, and online services like Google Analytics.
Preparing Data: It streamlines the process of cleaning and organizing data, making it more accessible and comprehensible.
Creating Data Visualizations: Users can leverage Power BI’s capabilities to craft captivating charts and graphs, facilitating easy comprehension of complex data sets.
Creating Reports: With Power BI, users can generate comprehensive reports showcasing their data insights and distribute them efficiently among team members.
Looking for Answers: Utilizing natural language queries, Power BI enables users to inquire about their data effortlessly, with the tool striving to provide insightful responses.
Using on Phones: Through the Power BI mobile app, users can access and view their reports on their smartphones, ensuring data accessibility on the go.
In essence, Power BI Desktop serves as a pivotal tool for businesses, allowing them to analyze data effectively, create compelling data visualizations, and seamlessly integrate data from platforms like Google Analytics, thus facilitating informed decision-making and collaboration within the organization.
Similarities Between Power BI and Tableau
Be it Tableau or Power BI, both are intended towards one end goal: data visualization. Thus, these tools have a lot in common. Here are the similarities between Power BI and Tableau:
Data Visualization Capabilities
The foremost similarity you will find in the Power BI vs Tableau debate is that both are great at data visualization capabilities. The tools allow businesses to create interactive and visually appealing dashboards, charts, graphs, maps, and other visual representations. Moreover, both offer a slew of visualization and customization options, which helps present data effectively and uncover insights.
Interactive Dashboards and Reports
Ease of use and management is a factor that goes a long way when it comes to Tableau or Power BI or any business tool for that matter. These data tools simplify this by enabling businesses to access their dashboards and reports without making an effort, leading to seamless tracking and good user experience.
Data Connectivity Options and Integration with Various Data Sources
When you are choosing between Power BI vs Tableau, you must be considering the data connectivity features both offer. Both the tools bring a number of options for connecting to various data sources, including databases, spreadsheets, cloud services, and web APIs. They also support several data formats and allow businesses to establish live connections or import data for analysis.
Support for Multiple Platforms (desktop, web, mobile)
One of the noteworthy aspects of Power BI or Tableau is that these tools have mobile apps for both iOS and Android devices, which allows businesses to access and interact with the platform easily. The responsive design of these tools enhances the usability and eliminates the need to juggle.
Collaboration and Sharing Features
Power BI and Tableau feature powerful collaboration and sharing capabilities, which allows businesses to share dashboards, reports, and visualizations within their organization. The tools offer different options for sharing through secure online platforms, exporting to different formats for offline sharing, and embedding visualizations in websites.
Community Support and Resources
Whether a business uses Power BI or Tableau, both provide it with active user communities and bring extensive resources, including documentation, tutorials, forums, and user groups to the table. This helps companies understand the tools better, exchange and apply knowledge as well as different practices, and troubleshoot issues.
Use Cases and Industry Applications of Power BI vs Tableau
Decisiveness and efficiency are the need of the hour. From marketing to supply chain, data visualization is proving to be the fuel for every business in day-to-day operations. So, industries have a lot to gain from tools and services like Power BI and Tableau. Here are the use cases of both in different sectors:
Use cases Where Power BI is More Suitable
- Data Analysis and Reporting: Power BI allows users to analyze large volumes of data from various sources and generate interactive visual reports and dashboards. Users can drill down into details, apply filters, and perform calculations to gain insights and make data-driven decisions.
- Sales and Marketing Analytics: Power BI enables sales and marketing teams to analyze sales data, customer behavior, and marketing campaigns. It helps identify trends, track sales performance, measure campaign effectiveness, and optimize marketing strategies.
- Financial Analysis and Budgeting: Power BI can be utilized for financial analysis, including budgeting, forecasting, and expense tracking. It allows finance professionals to visualize financial data, create financial reports, analyze profitability, and identify cost-saving opportunities.
- Supply Chain and Operations Management: Power BI can provide insights into supply chain and operations management by visualizing data related to inventory levels, production efficiency, supplier performance, and logistics. It helps optimize processes, identify bottlenecks, and streamline operations.
Use cases Where Tableau is More Suitable
- Financial Analysis and Planning: Tableau offers financial analysis, budgeting, and forecasting capabilities, which can help finance professionals analyze financial data, track revenue and expenses, perform profitability analysis, and create financial reports
- Operations and Supply Chain Management: The tool can give a hand in optimizing supply chain management by analyzing data related to inventory levels, production efficiency, logistics, and supplier performance. It can also help identify bottlenecks, streamline processes, and improve overall operational efficiency.
- Human Resources Analytics: The HR department can leverage Tableau to analyze different forms of HR data, be it employee performance or workforce demographics. The tool can help HR professionals gain insights into talent management, retention strategies, and employee satisfaction.
- Healthcare Analytics: Tableau finds applications in healthcare for analyzing patient data, clinical outcomes, resource utilization, and hospital performance. It also enables healthcare professionals to visualize and analyze data to improve patient care, optimize resource allocation, and identify areas for improvement.
Factors to Consider When Choosing Between Power BI vs Tableau
Specific business requirements
It all begins and ends with business goals and requirements. The most important difference between Tableau and Power BI is why you want to use them. Identify your organization’s goals, data sources, intended users, budget, and specific use cases for the business intelligence tool. Understand the types of data you’ll be working with, the level of analysis required, and the desired visualization capabilities.
Technical expertise and user skill levels
When choosing between Power BI vs Tableau, you must also consider the user-friendliness of each tool’s interface and the learning curve for your team. Power BI’s interface may be more intuitive for users that are comfortable with the Microsoft ecosystem. Tableau is more visually oriented and suitable for users seeking data exploration.
Budget and cost considerations
Evaluate the compatibility of each tool with your existing data sources, databases, and other applications. Consider the ease of integration with platforms such as Excel, cloud services, and other third-party tools that you currently use or plan to implement.
Scalability and future growth potential
Yet another important factor, the scalability and deployment options offered by both tools must be considered. Assess the tools based on their ability to handle large data volumes, support for on-premises or cloud deployment. Moreover, determine the availability of dedicated server solutions for sharing and collaboration.
Integration with existing systems and tools
Comparing the pricing models and licensing options of both tools can significantly help you with Power BI vs Tableau decision. Tap factors, including upfront costs, subscription fees, and user-based licensing. Determine the total cost of ownership over the long term and which pricing structure matches right with your budget and expected usage.
Power BI vs Tableau: Which is Better?
Both data visualization tools are great to use, but depending on the purpose and level of usage, a business can opt for the one which seems more suitable. Whether you go with Power BI or Tableau, it is highly recommended to learn the know-how’s of these tools to stay ahead of the game.
No Code AI program explain data visualization tools in dept. Enroll now and start learning.
Frequently Asked Questions
Q1. Is Power BI easier than Tableau?
A. Both the tools offer a wide range of services and work in ways that suit specific sectors and businesses. However, Power BI triumphs as an easier route to take because it is beginner-friendly.
Q2. Q2. Why is Power BI more popular than Tableau?
A. Power BI features a user-friendly interface that is more convenient for beginners compared to Tableau.
Q3. Does Tableau require coding?
A. No, Tableau does not require users to know programming languages nor does it demand any specific technical expertise.
Q4.Q4.What is the price difference between Power BI and Tableau?
Power BI is easy to learn, but the Powerful data visualization tools Pro license has been offered at an average of $2.99 per month while Tableau Creator is available for $12-$70 for users.
Hello, I am Nitika, a tech-savvy Content Creator and Marketer. Creativity and learning new things come naturally to me. I have expertise in creating result-driven content strategies. I am well versed in SEO Management, Keyword Operations, Web Content Writing, Communication, Content Strategy, Editing, and Writing.


