MongoDB is a widely used NoSQL database that stores data in flexible documents similar to JSON objects rather than traditional tables and rows. This document-based structure makes it easier to handle complex or frequently changing data, which is why MongoDB is commonly used in modern web applications, analytics platforms, and large-scale data systems.
Developers can interact with MongoDB using command line tools like the MongoDB shell, but many users prefer a graphical interface for managing and exploring data. MongoDB Compass was created for this purpose, providing a visual way to work with databases and documents. In this article, we explore how MongoDB Compass helps simplify database management.
Table of contents
What is MongoDB Compass?
MongoDB Compass is a graphical interface created by MongoDB that helps users interact with their databases visually. Instead of using command line queries, users can manage and explore data through a simple interface.
Key Features:
- Provides a visual environment to work with MongoDB databases.
- Allows users to explore databases and collections easily.
- Helps run queries and analyze data without writing complex commands.
- Displays the structure of databases and documents clearly.
- Enables users to open documents, filter data, and edit records directly.
- Useful for beginners because it removes the need to memorize commands.
- Also helpful for experienced developers when debugging queries and exploring datasets.
- Helps monitor and manage database performance efficiently.
Installing MongoDB Compass
Installing MongoDB Compass is a simple process and takes only a few minutes.
First, you need to download MongoDB Compass from the official MongoDB website. The installer is available for Windows, macOS, and Linux.
After downloading the installer, you can run the installation file and follow the setup instructions. Once the installation is complete, the application can be opened like any other software program.
Create Your First Free MongoDB Cluster
MongoDB provides a free cloud database service through MongoDB Atlas. A cluster is a group of servers that store and manage your database. You can create a free cluster to start working with MongoDB.
Steps to Create a Free Cluster
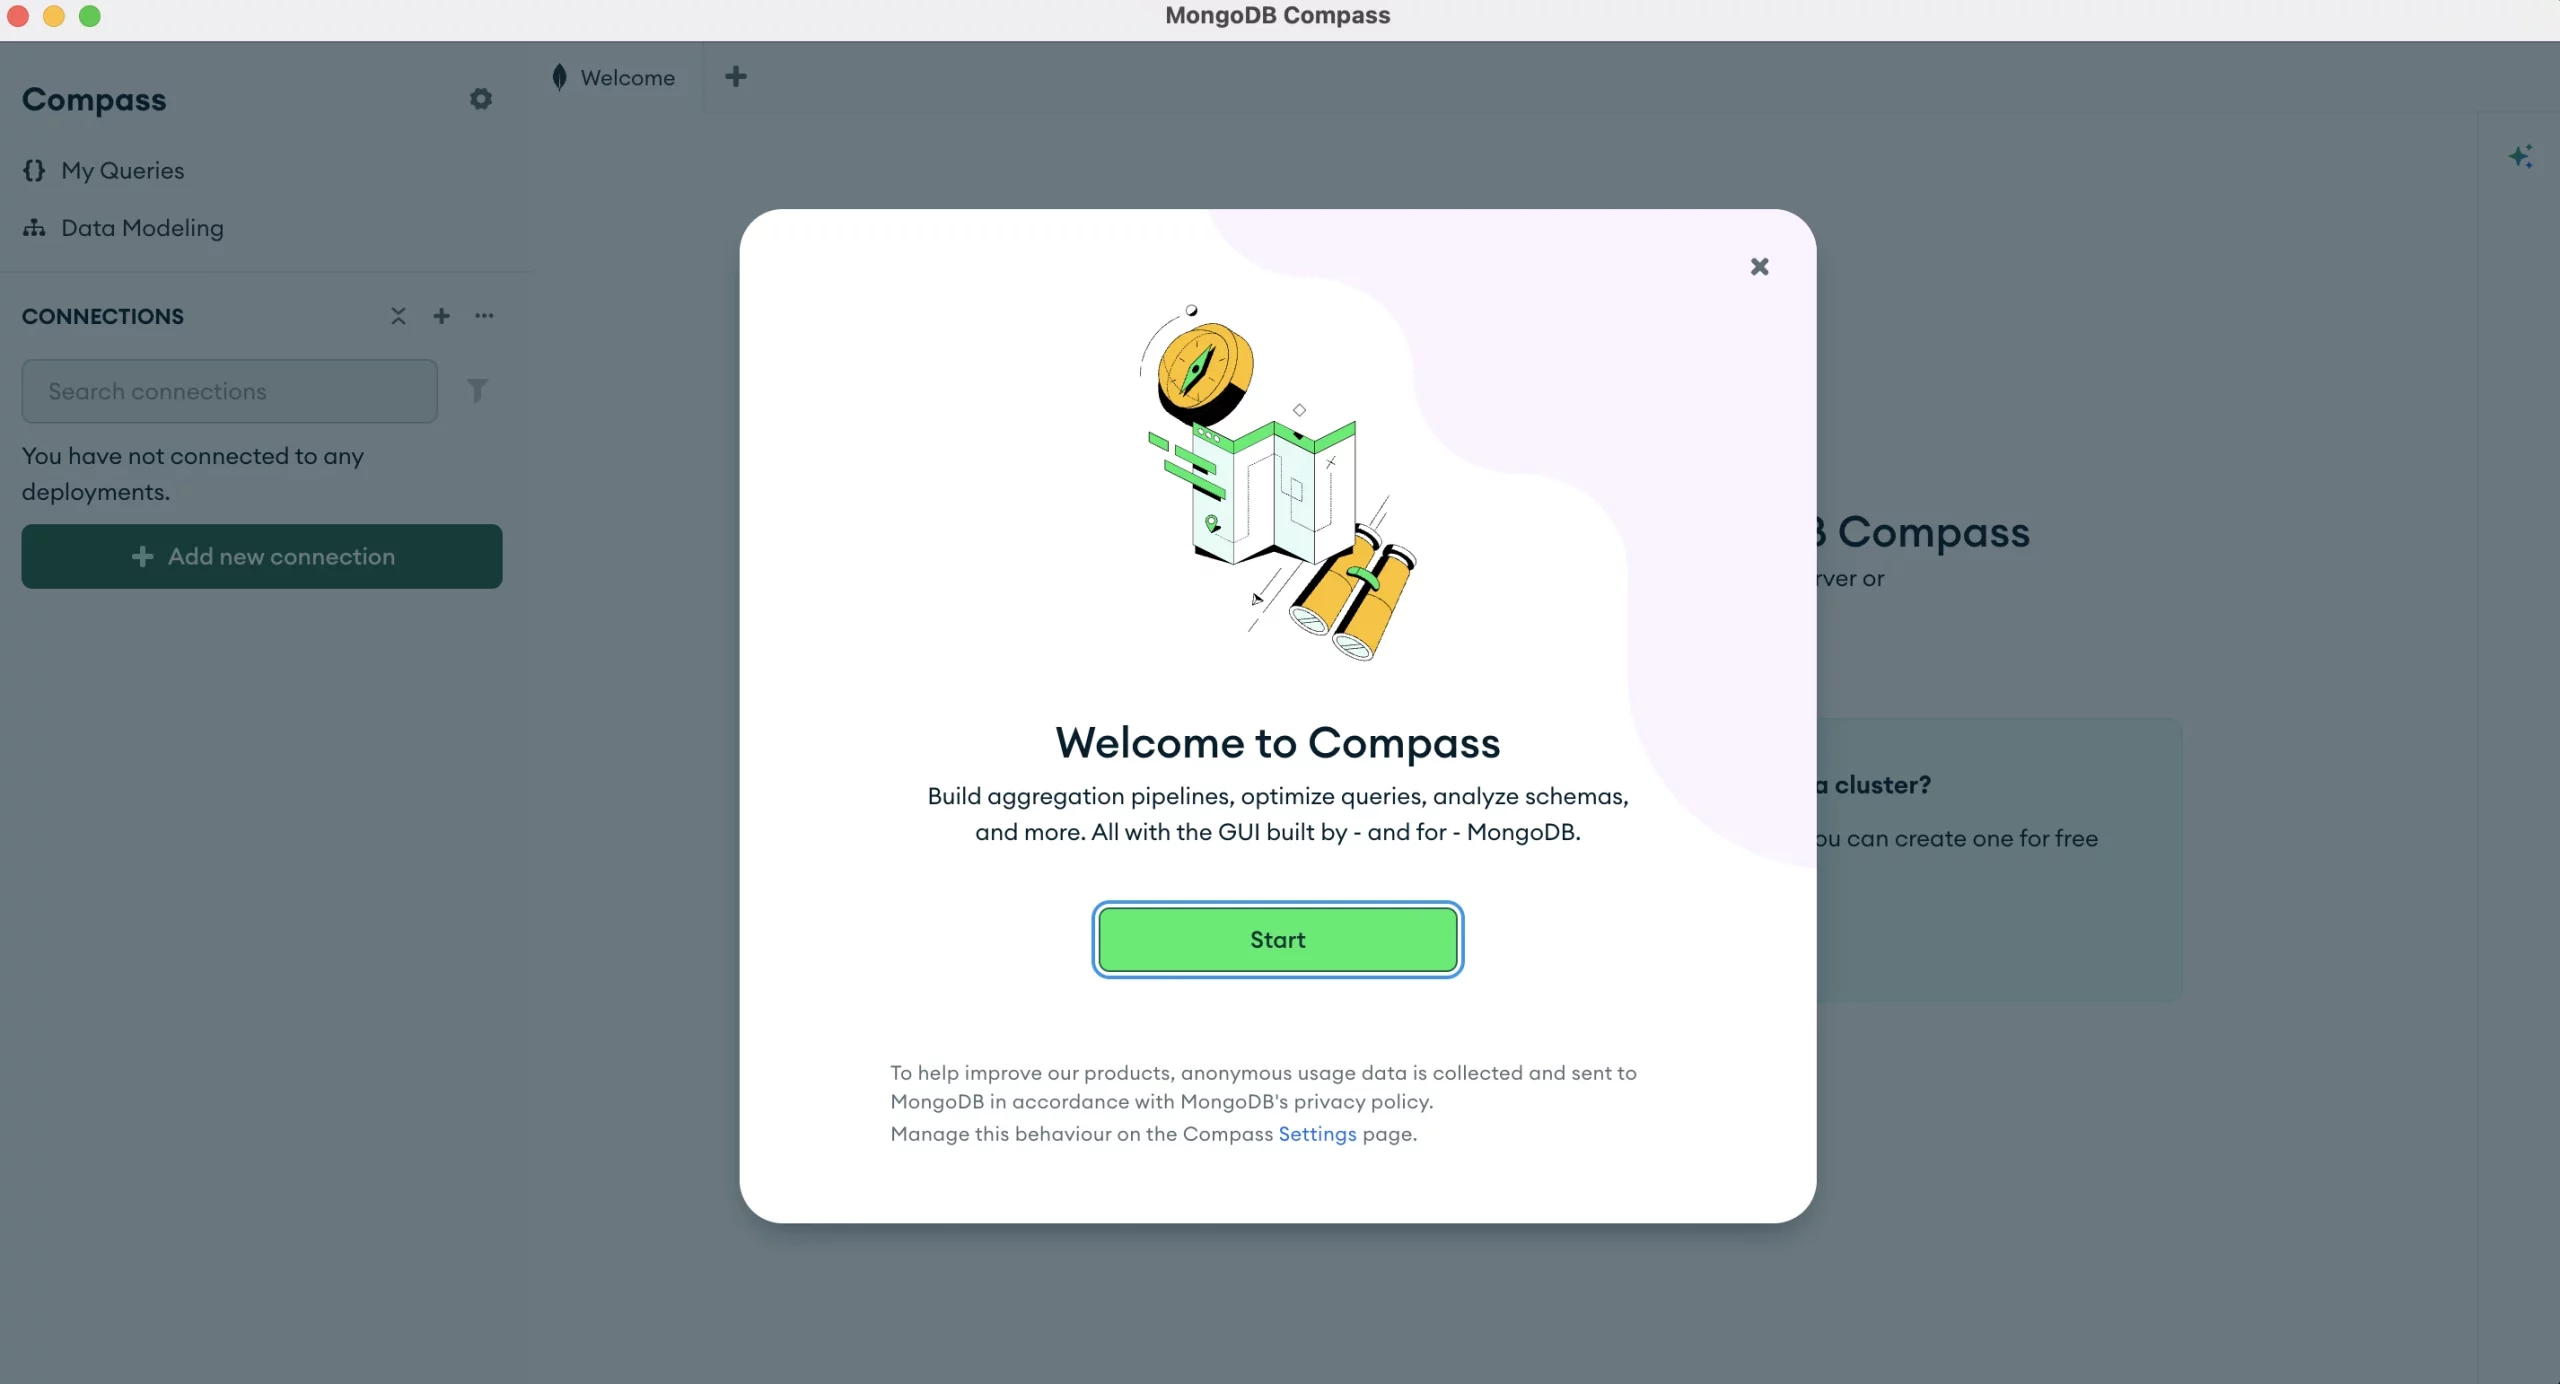
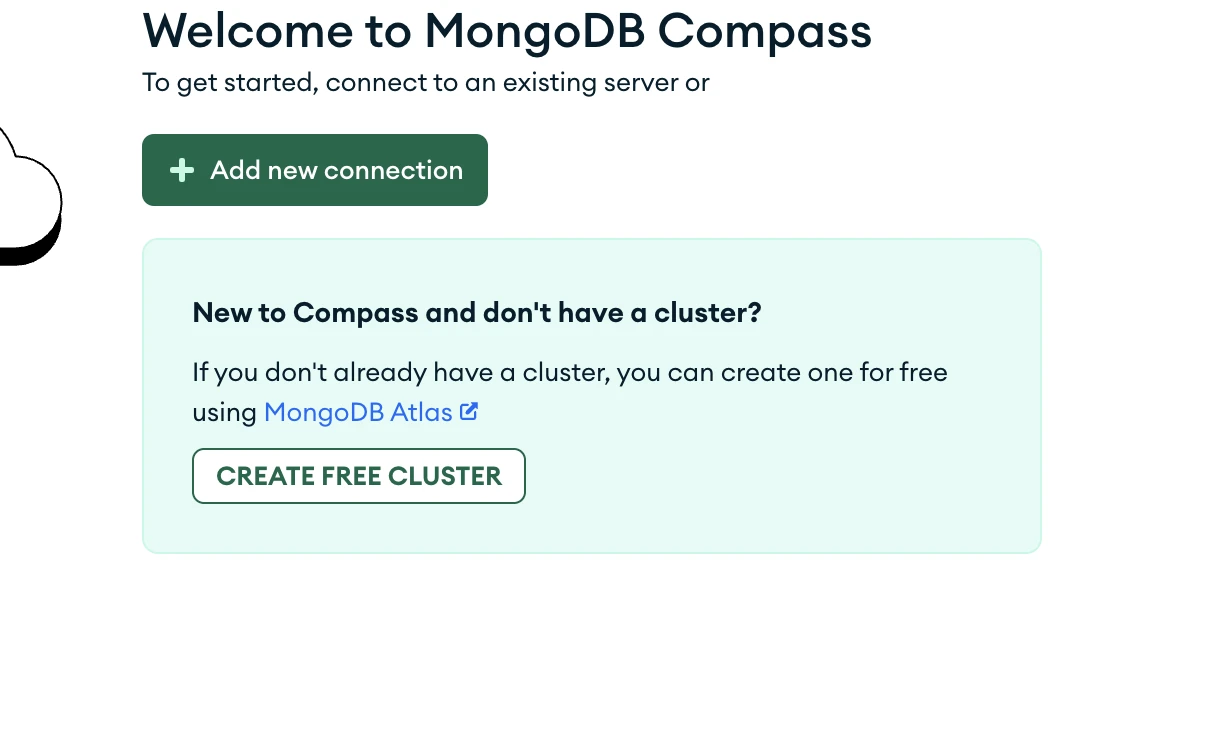
- Go to the MongoDB Compass.
- Click Create Free Cluster and create a new account.
- Sign in to your MongoDB Atlas dashboard.
- Click Create a Cluster.
- Choose the Free Shared Cluster option.

- Select your cloud provider and region.
- Give your cluster a name.
- Click Create Cluster.
After the cluster is created, you need to set up access.
Configure Database Access
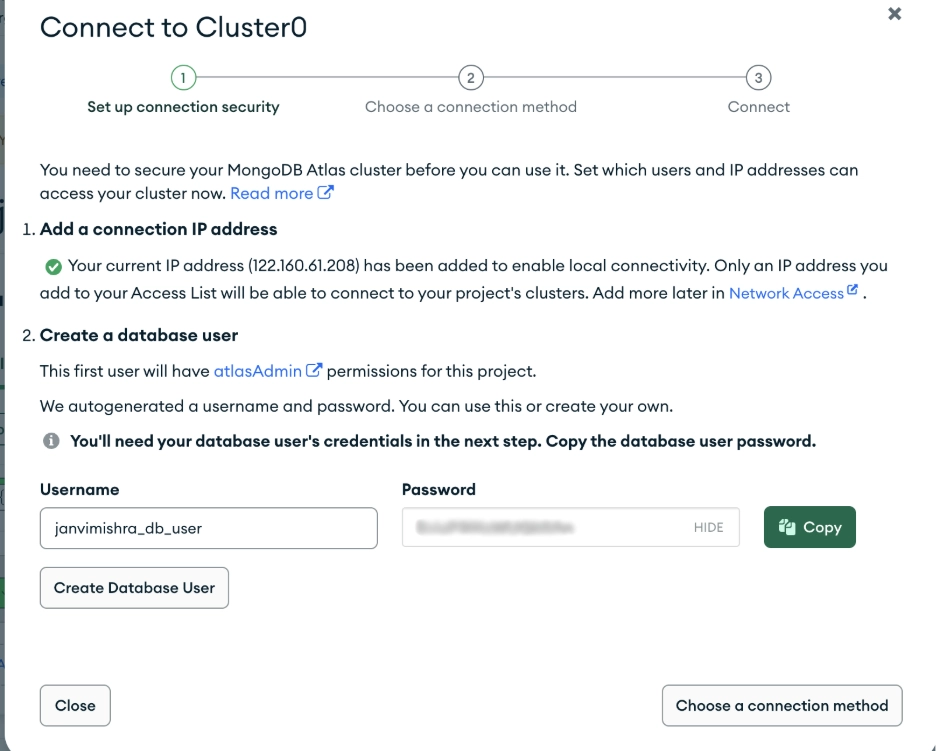
- Connect your cluster to Compass to Set up connection security
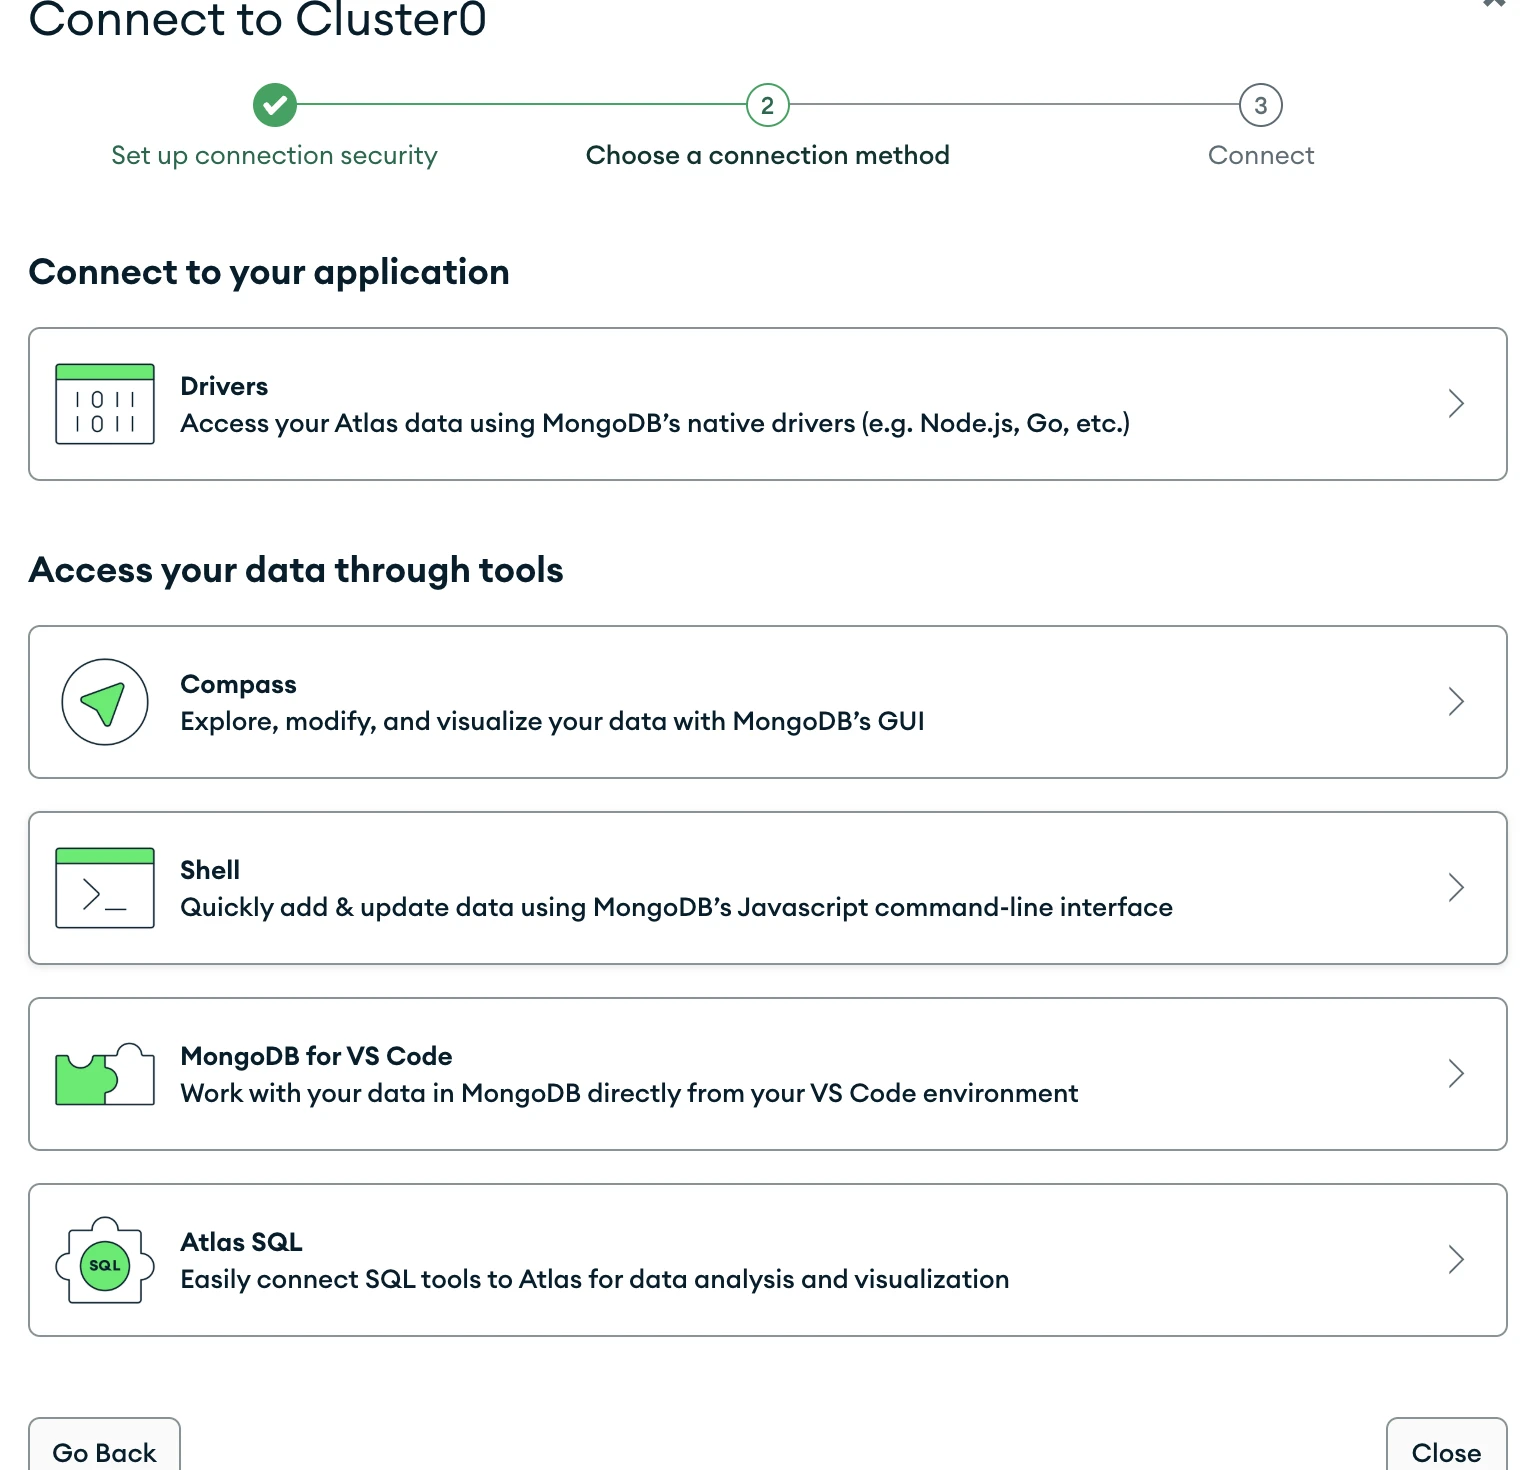
- Click on Create a database user and store the username and password. And click on “Choose a connection method”.
- If you don’t have MongoDB Compass installed click on that option and download from the provided link and if you already have MongoDB Compass installed click on that option .

You can now copy the connection string and use it to connect your cluster with MongoDB Compass. This allows you to start creating databases, collections, and documents in your cloud cluster.
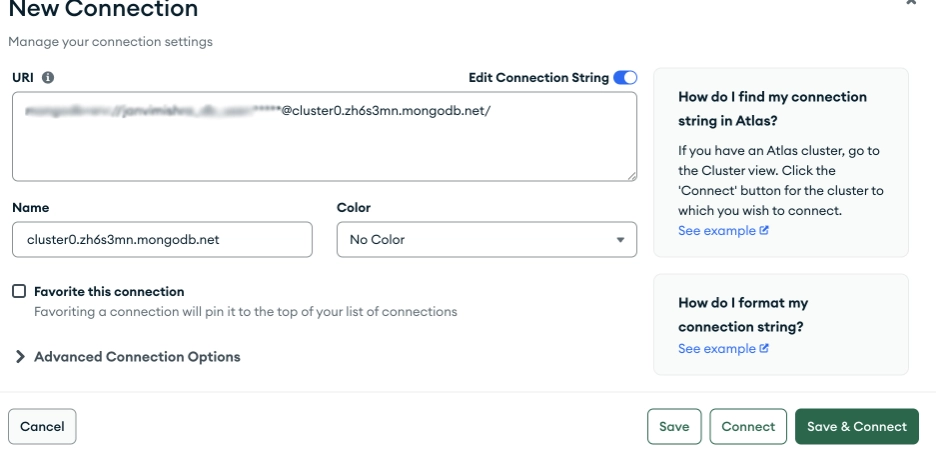
- Now Go to the MongoDB Compass and click on add new connection.

- Paste the connection string that contains the server address, port number, and authentication details. And press Save and connect
Once connected, the dashboard displays the available databases and collections.
Managing Databases with MongoDB Compass
MongoDB Compass allows users to perform several database management tasks without writing commands.

Creating a Database
To create a database in MongoDB Compass, users simply select the option to create a new database. The user must provide a database name and create the first collection.

MongoDB requires a collection to exist before the database can store data.
Working with Collections
Collections are similar to tables in relational databases. MongoDB Compass allows users to create new collections, rename existing ones, and delete collections when they are no longer needed.
Managing Documents
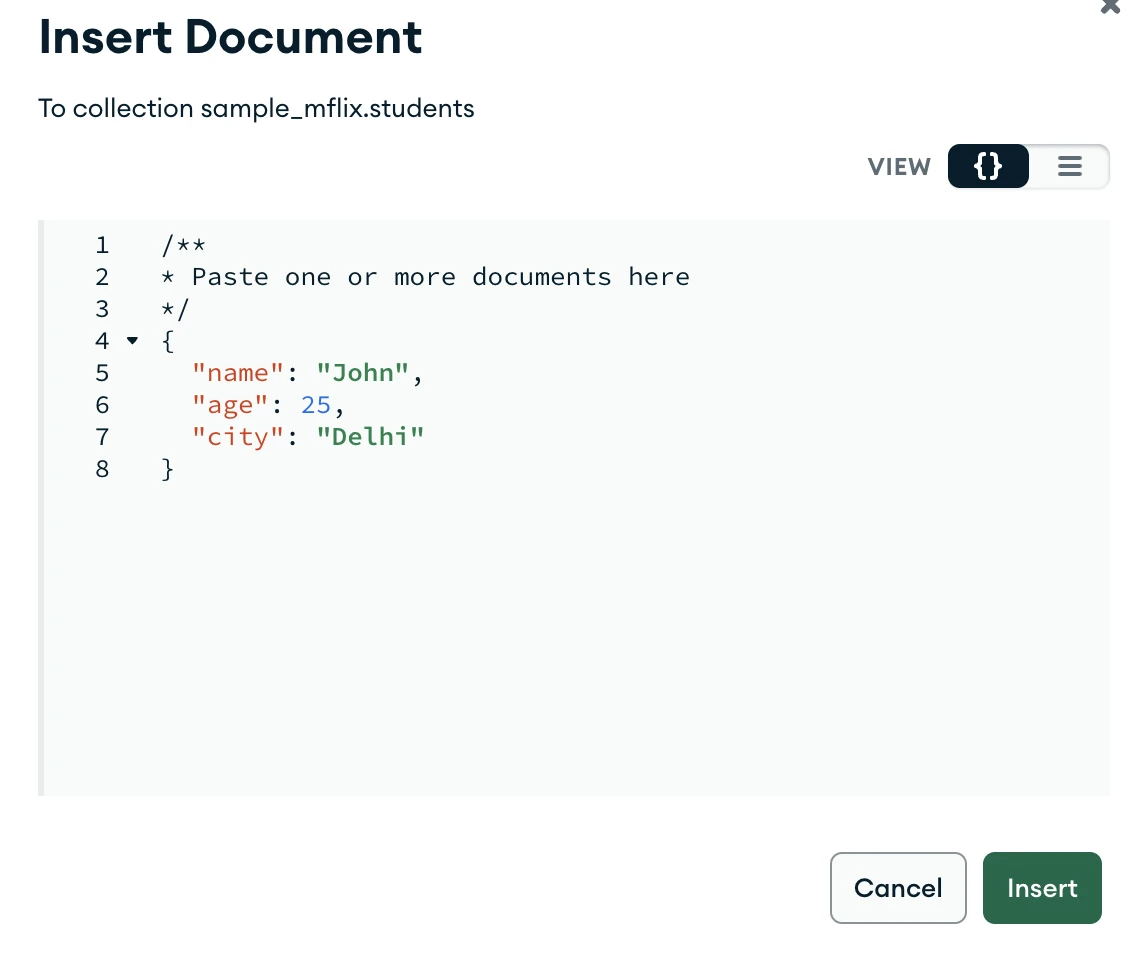
Documents are the individual records stored in a MongoDB collection. In MongoDB Compass, users can add new documents, update existing documents, or delete documents directly from the interface.
Documents are displayed in JSON format, which makes them easy to read and modify.
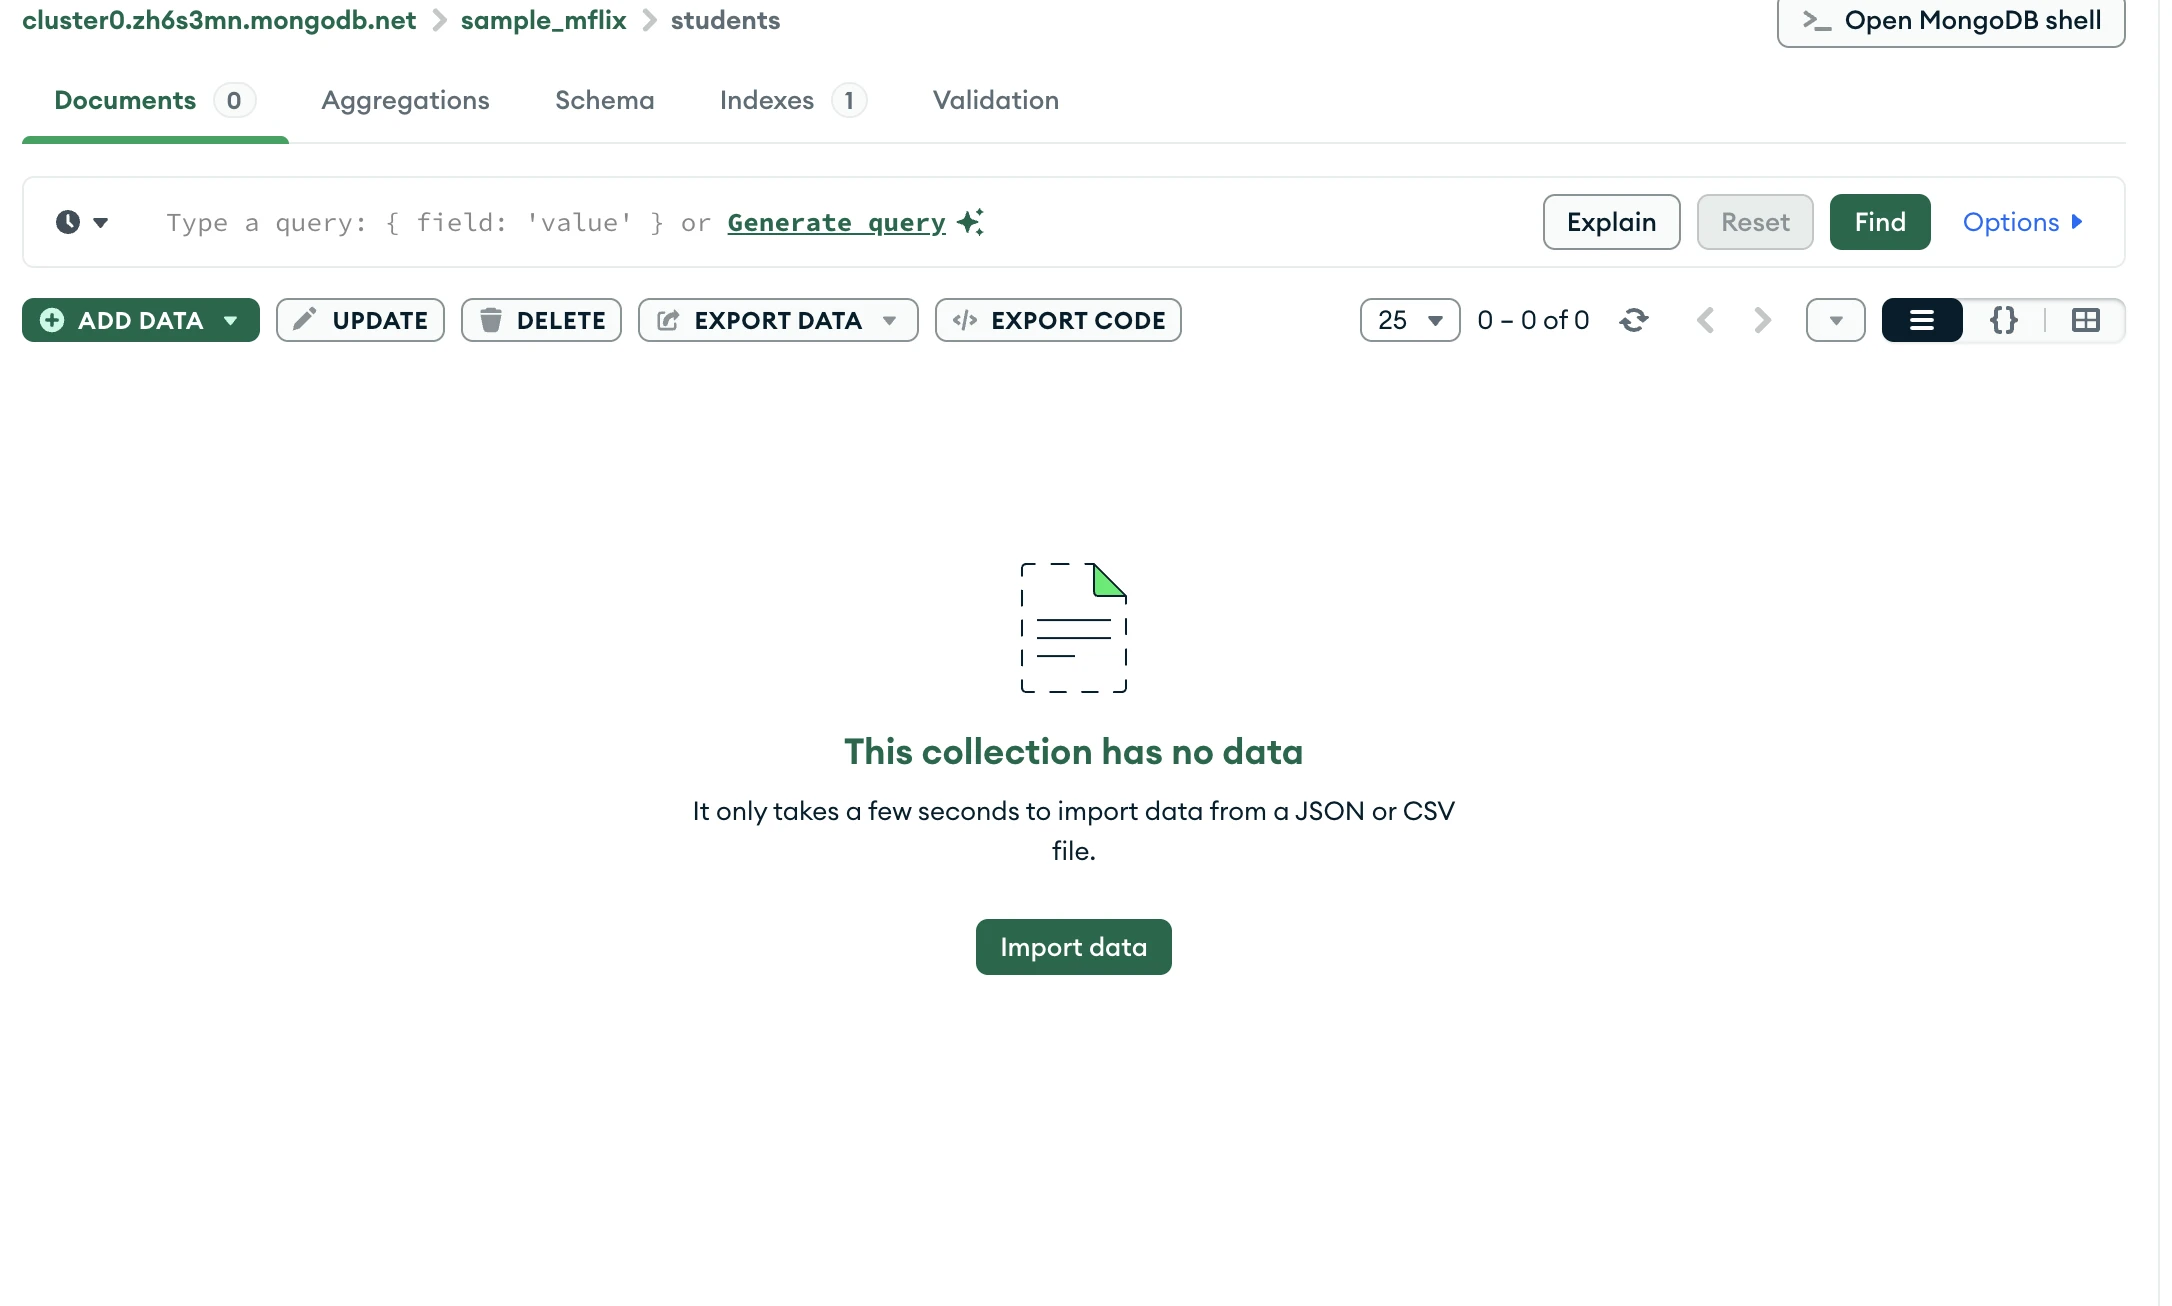
You can either add data or import data from a JSON or CSV file.
This is how you can insert in the document just by clicking on “ADD DATA”. You can even Update, Delete , Export Data and Export Code in the document.
Aggregation in MongoDB Compass
Aggregation in MongoDB Compass is used to process and analyze data stored in a collection. It allows users to perform operations such as filtering, grouping, sorting, and calculating results. MongoDB Compass provides a visual aggregation pipeline builder that makes it easier to create and test aggregation queries without writing complex commands.
To perform aggregation, open MongoDB Compass and connect to your database. Select the sample_mflix database and open the movies collection. Then click the Aggregations tab. Here you can create a pipeline and add different stages to process the data.
For example, you can group movies by year and count how many movies were released each year.
Stage 1: Group movies by year
{
  "_id": "$year",
  "total_movies": {
                    "$sum": 1
                  }
}
This stage groups documents based on the year field and counts the number of movies in each year.
Stage 2: Sort the result
{
  "_id": 1
}
This stage sorts the results by year in ascending order.
Schema Visualization in MongoDB Compass
Schema visualization helps users understand the structure of data in a collection. It shows field names, data types, and how often each field appears in the documents.
Steps to View Schema
- Open MongoDB Compass and connect to your database.
- Select the database you want to explore.
- Open the collection (for example sample_mflix → movies).
- Click the Schema tab.
- Select the number of documents to analyze.
- Click Analyze Schema.
MongoDB Compass will scan the documents and display the schema, including fields, data types, and their frequency in the collection.

MongoDB Compass vs MongoDB Shell
| Feature | MongoDB Compass | MongoDB Shell |
| Interface | Graphical user interface | Command line interface |
| Ease of Use | Easy for beginners | Requires knowledge of commands |
| Main Purpose | Explore and analyze data visually | Run commands and scripts |
| Data Inspection | Quickly view databases, collections, and documents | Requires queries to inspect data |
| Automation | Limited automation | Supports scripting and automation |
| Use Case | Visual exploration and debugging | Advanced operations and scripting |
When Should You Use MongoDB Compass?
MongoDB Compass is helpful in many situations. It is especially useful when learning MongoDB because it provides a clear visual representation of databases and collections. Developers also use it when exploring new datasets, debugging queries, and analyzing database structures. Data analysts and engineers often use Compass to inspect documents and understand how data is organized before writing queries or building applications.
Frequently Asked Questions
Q1. What is MongoDB Compass?
A. MongoDB Compass is the official graphical interface for MongoDB that allows users to explore databases, manage collections, and run queries visually without using command-line tools.
Q2. Why is MongoDB Compass useful?
A. It simplifies database management by providing visual tools for browsing collections, building queries, analyzing schemas, and understanding data without memorizing commands.
Q3. When should you use MongoDB Compass?
A. It is useful for learning MongoDB, exploring datasets, debugging queries, analyzing schemas, and visually managing databases during development.
Hi, I am Janvi, a passionate data science enthusiast currently working at Analytics Vidhya. My journey into the world of data began with a deep curiosity about how we can extract meaningful insights from complex datasets.


