-
Effective Data Visualization Techniques in Data Science Using Python
Data Visualization techniques involve the generation of graphical or pictorial representation of DATA, to understand the insights
Shanthababu Pandian 23 Oct, 2024
-
DATA VISUALIZATION : What Is This And Why It Matters
Data Visualization is one of the parts of descriptive analysis and it is the process of transferring the data into the visual context.
Keerthika 01 Aug, 2021
-
Construct various types of Bar Race Charts with Plotly
Data Visualization is a key skill to master. In this article, construct various types of Bar Race Chart with Plotly library in python.
Kashish Rastogi 29 Jul, 2021
-
Using Seaborn’s FacetGrid Based Methods for Exploratory Data Analysis
FacetGrid is a multi-axes grid with subplots visualizing the distribution of variables of a data and relationship between multiple variables
Rahul Shah 12 Nov, 2024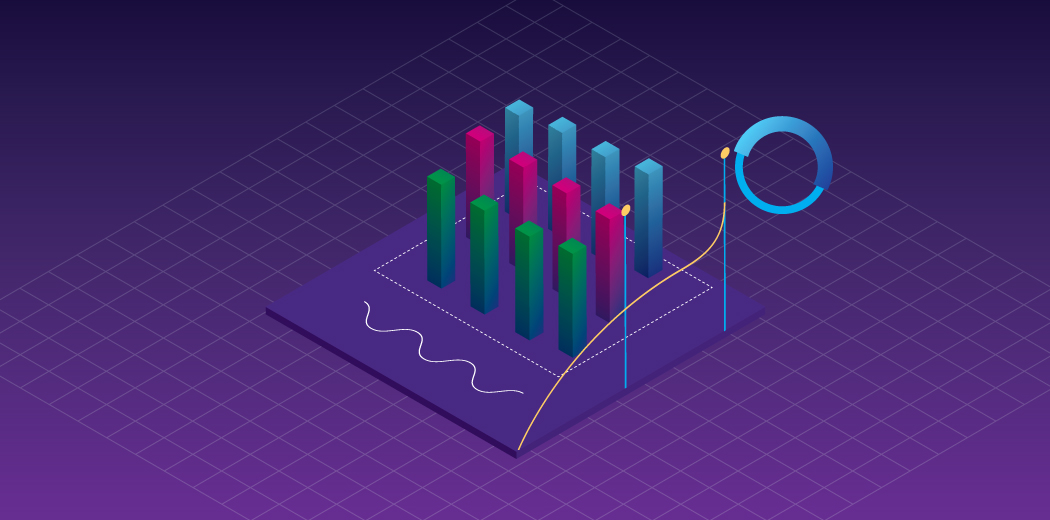
-
Cyberpunk Themed Charts: Advanced Data Visualization in Python
Cyberpunk is a fictitious genre of Science backed by technology resembling the dystopian future. We will see Cyberpunk Themed Charts.
Rahul Shah 28 Oct, 2024
-
Interactive Data Visualization Plots with Plotly and Cufflinks
In this article we will discuss how to make interactive data visualization using opensource python Libraries Like plotly and cufflinks.
Hardikkumar 28 Oct, 2024
-
Visualizing Netflix Data Using Python!
In this article, we will be visualizing Netflix data using python. Here, we will utilize on two python libraries Matplotlib and seaborn.
Karan 23 Oct, 2024
-
Data Visualization Using Seaborn For Beginners
Seaborn is a Python data visualization library based on Matplotlib. In this article, we'll see how to make interesting plots using Seaborn.
Bahauddin 14 Jul, 2021
-
Analyzing popular repositories on GitHub
GitHub is one of the most popular version control and source code management platform. Here, we will be analyzing popular GitHub repositories
Padhma 27 Oct, 2024
-
Stock Price Analysis With Python
Explore stock price analysis in Python, covering libraries, data description, exploratory analysis, moving averages, scatter plots.
Maverick 29 Jan, 2025
