-
New to Kaggle? Here’s How you can Get Started with Kaggle Competitions
New to Kaggle and don't know how to start? Get started with Kaggle competitions with this article to know how to make your first Kaggle submission
Aniruddha Bhandari 27 Oct, 2024
-
Build your own Animated Data Visualization in Tableau in Just 5 Minutes
Animated visualizations are a pwoerful way of showing your data and results. Learn how to use Tableau to created animated visualizations.
Pranav Dar 15 Jun, 2020
-
Guide to Geospatial Analysis using Folium
Explore Folium: Easy map tool. Install, plot maps, markers, paths, layers, & plugins. Visualize COVID-19 hotspots & NYC bus traffic.
Abhishek Sharma 26 Jun, 2024
-
SQL for Beginners and Analysts – Get Started with SQL using Python
SQL is an important skill to master for any analyst. Therefore, we explore the basics of SQL in this article using the SQLite database in Python!
Aniruddha Bhandari 08 Jun, 2020
-
Introduction to ANOVA for Statistics and Data Science (with COVID-19 Case Study using Python)
ANOVA is a key topic in statistics and data science. Learn how ANOVA works using a COVID-19 case study in Python.
Guest Blog 14 Oct, 2024
-
Learn How to Visualize Geospatial Data in Jupyter using kepler.gl
Visualizing geospatial data using kepler.gl for jupyter notebooks. In this article we'll learn about kepler.gl and use it for visualizing geospatial data.
Abhishek Sharma 23 Oct, 2024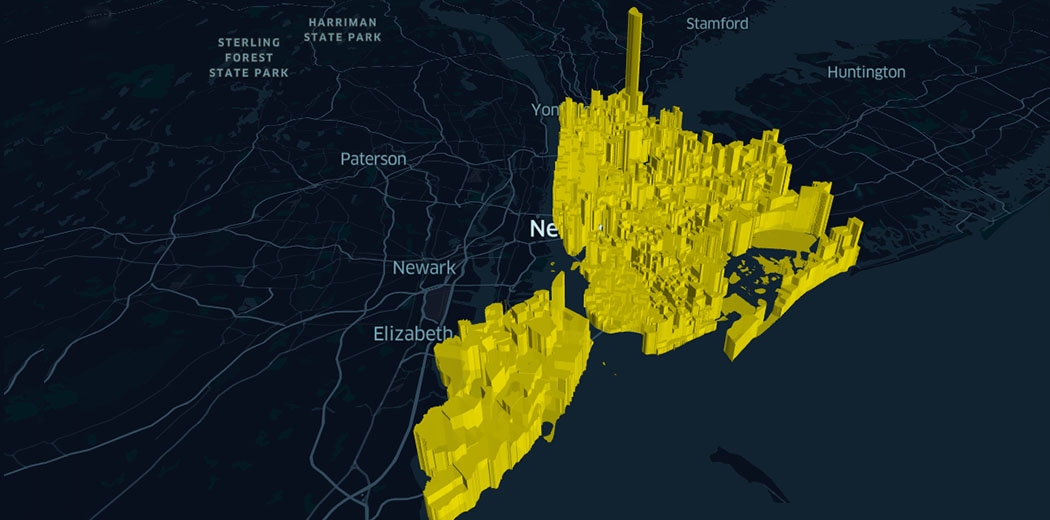
-
Decision Tree vs Random Forest | Which Is Right for You?
Compare Random Forest and Decision Tree algorithms through detailed explanations, Python examples, and insights on model performance.
Abhishek Sharma 01 May, 2025
-
All you Should Know About Datetime Variables in Python and Pandas
Learn to manipulate date and time features with Python's datetime library. Also, learn to make new datetime features with Pandas library!
Aniruddha Bhandari 23 Oct, 2024
-
10+ Simple Yet Powerful Excel Tricks for Data Analysis
Here are some useful excel tips and tricks. The excel tips for data analysis and data science include tricks on data cleaning functions, keyboard shortcuts
Sunil Ray 28 Apr, 2020
-
What is Feature Scaling and Why is it Important?
Learn how feature scaling, normalization, & standardization work in machine learning. Understand the uses & differences between these methods.
Aniruddha Bhandari 03 Dec, 2025
