In business intelligence and analytics, the initial source of data is rarely ideal for decision-making. The manager or analyst receives a long list of transactions that can easily confuse anyone and be cumbersome to interpret. The final output of a long list of transactions, typically, is summarized to convey trends/ patterns/ performance indicators. This is where pivot tables are essential, made possible by SQL PIVOT Operator or conditional aggregation with CASE expressions. Here, we shall explore both
With a pivot operation, we are turning rows into columns (the performance indicators), while simultaneously aggregating the information. In simple terms, instead of looking at thousands of records of sales over time, the pivot table can show total sales per geography for each of the products. It thus makes the data easier to interpret. The SQL Server PIVOT operator was first introduced in SQL Server 2005 and allows for pivoting of rows to columns easily.
Prior to the existence of the PIVOT operator, developer reliance on grouping of columns and aggregation of multiple CASE statements in a SELECT clause to easily transform rows to columns was common. The older methods were functional, but they were very wordy, and don’t tend to be legacy-friendly as they are much more difficult to interpret and maintain. The PIVOT operator provides a clean syntax to summarize data into performance indicators and retain meaningful names for the performance indicators. It allows you to do the summarization directly in SQL rather than exporting it and performing calculations and transformations in Excel or other business intelligence solutions.
Also read: Create Pivot Table Using Pandas in Python
Table of contents
- SQL PIVOT Operator: What it Does
- SQL PIVOT Operator: Syntax and Structure
- SQL PIVOT Operator: Step-by-Step Example
- SQL PIVOT Operator: Performance Considerations
- SQL PIVOT Operator: Limitations
- Dynamic Pivoting
- Alternative: Conditional Aggregation
- PIVOT vs. CASE Aggregation
- Conclusion
- Frequently Asked Questions
SQL PIVOT Operator: What it Does
The PIVOT operator takes the unique values from a source column and turns them into multiple new columns as headers in the query output, while applying an aggregate function to the values from another column, grouping by one or more non-pivoted columns.
PIVOT makes it easier to change the structure of datasets in order to use them for analysis. Rather than writing a complex logic to get the data reformatted, the PIVOT operator allows SQL Server to manage the pivoting internally. What’s more, it mostly achieves better performance than a client application.
The PIVOT operator shines most when we want to design cross-tabulation reports quickly. PIVOT helps analysts visualize and see their aggregated detail values by categories, such as monthly total, product sales, or performance metrics related to a department, very concisely, and in a more readable layout.
SQL PIVOT Operator: Syntax and Structure
The PIVOT operator is specified in the FROM clause of a query, usually as a subquery. The subquery is called the source query and must return three things: a non-pivoted column (or columns), a pivot column, and a value column.
Here’s the general syntax for a PIVOT query:
SELECT <non_pivoted_columns>, [pivoted_column_1], [pivoted_column_2], ...
FROM (
    SELECT <non_pivoted_columns>, <pivot_column>, <value_column>
    FROM <source_table>
) AS SourceQuery
PIVOT (
    <aggregate_function>(<value_column>)
    FOR <pivot_column> IN ([pivoted_column_1], [pivoted_column_2], ...)
) AS PivotTableAlias;
Now, let’s understand what these keywords mean:
- The non-pivoted columns are the data that will remain as rows in the result. These are the grouping keys to the pivot operation. For example, within a sales dataset, this could be a Region column.
- The pivot column is the column whose unique values will now become the new columns in your result set. For example, if you are pivoting by product type, the product names each become a column in your output.
- The value column contains the numeric or measurable data you want to aggregate. You will specify any aggregate function in this column as you normally would (i.e. SUM, AVG, COUNT, MIN, or MAX).
- The aggregate function is used to combine the column values at every intersection of a non-pivoted and a pivoted column. For example, SUM(SalesAmount) represents total sales for each pivoted column for each grouping key column.
- The IN list in the PIVOT clause specifies exactly which of the pivot column values should become columns in the output. These values are hard-coded; if your data changes and has new product types that are not referenced here, you will need to change your query.
- Lastly, both the source subquery and the final results of the PIVOT require aliases. In the absence of aliases, SQL Server will throw a syntax error.
SQL PIVOT Operator: Step-by-Step Example
Let us work through an example using a simple dataset.
Source Data
Let us consider the following ProductSales table:
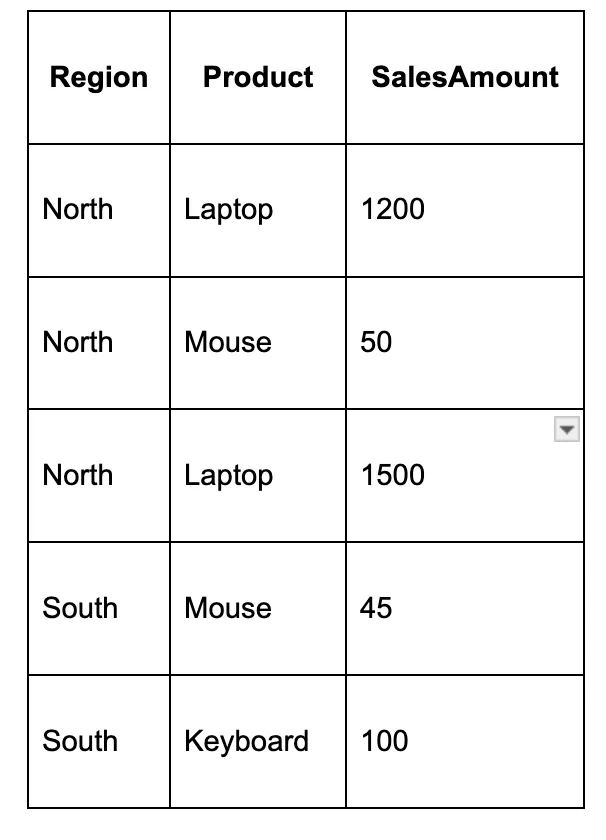
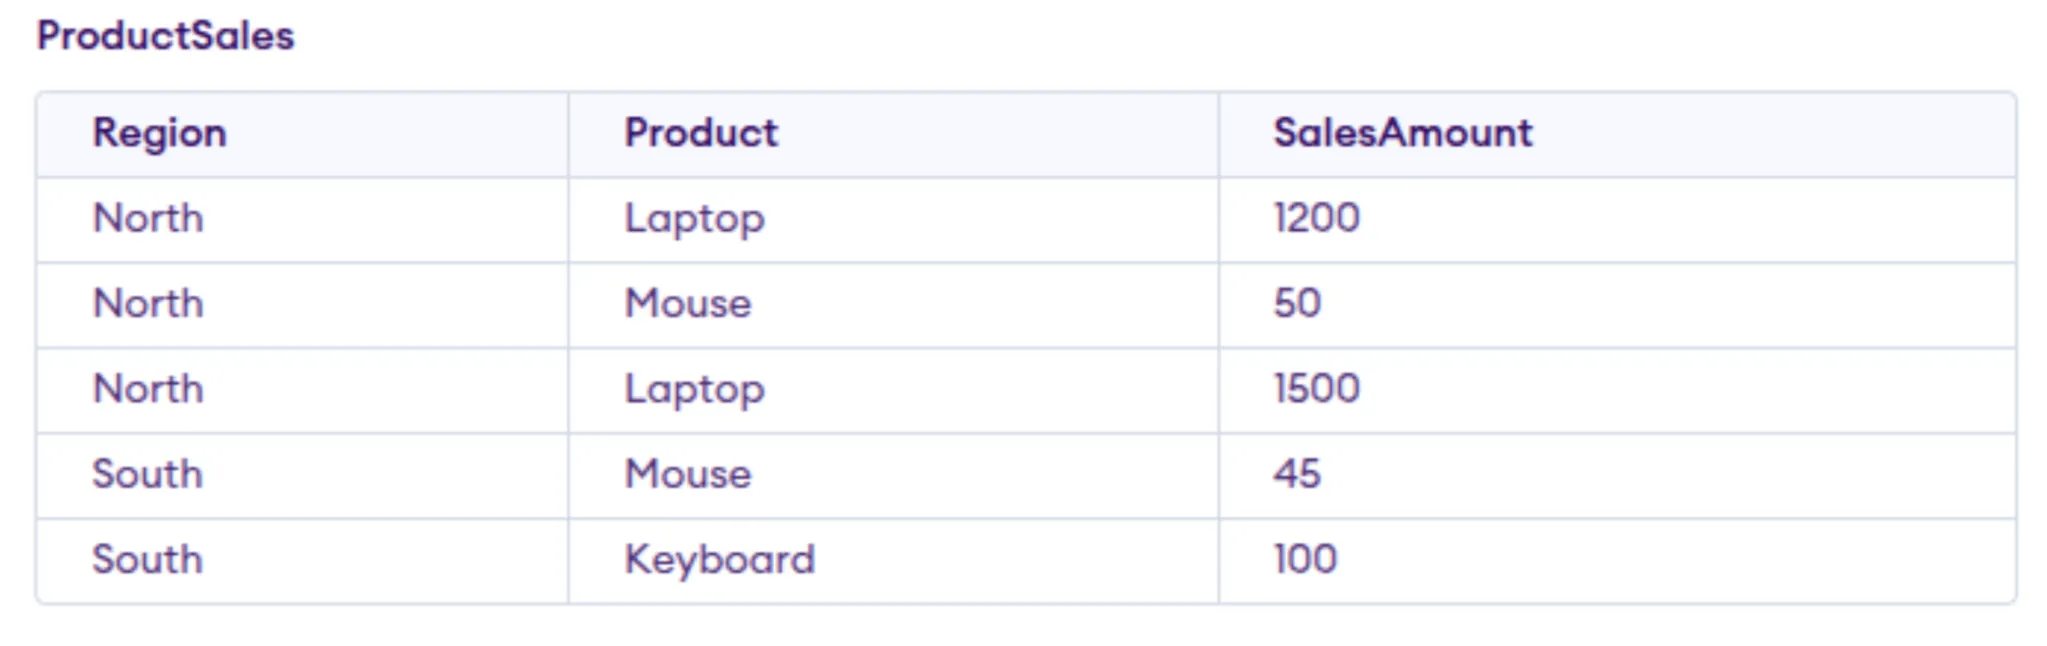
We want to produce a report that shows total sales per region, with each product being its own column.
Step 1: Set up the Subquery
The subquery must return the non-pivoted, pivot, and value columns:
SELECT Region, Product, SalesAmount
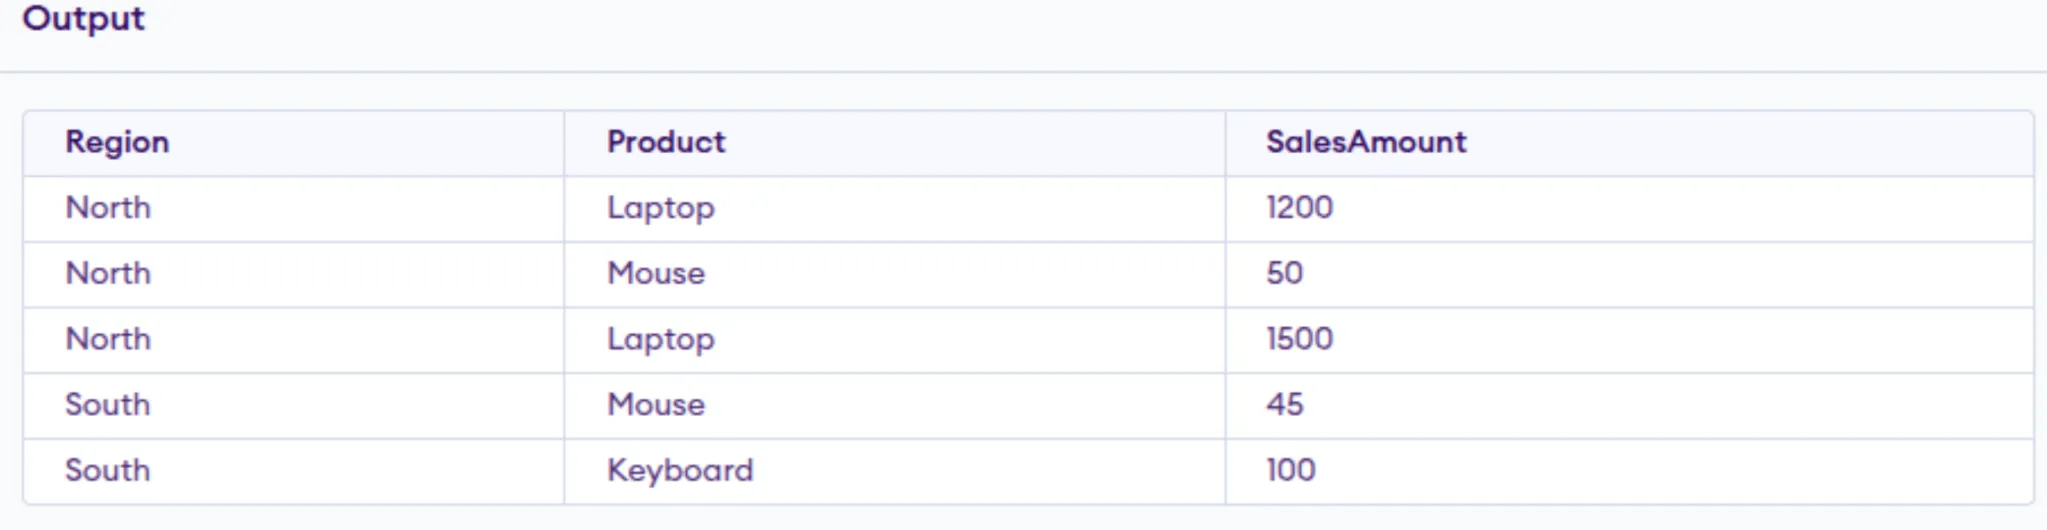
FROM ProductSales;In our case, Region is the non-pivoted column, Product is the pivot column, and SalesAmount is the value column.
Output:
Step 2: Use PIVOT
We will pivot on Product and aggregate the sales by summing them:
SELECT Region, [Laptop], [Mouse], [Keyboard]
FROM (
SELECT Region, Product, SalesAmount
FROM ProductSales
) AS SourceData
PIVOT (
SUM(SalesAmount)
FOR Product IN ([Laptop], [Mouse], [Keyboard])
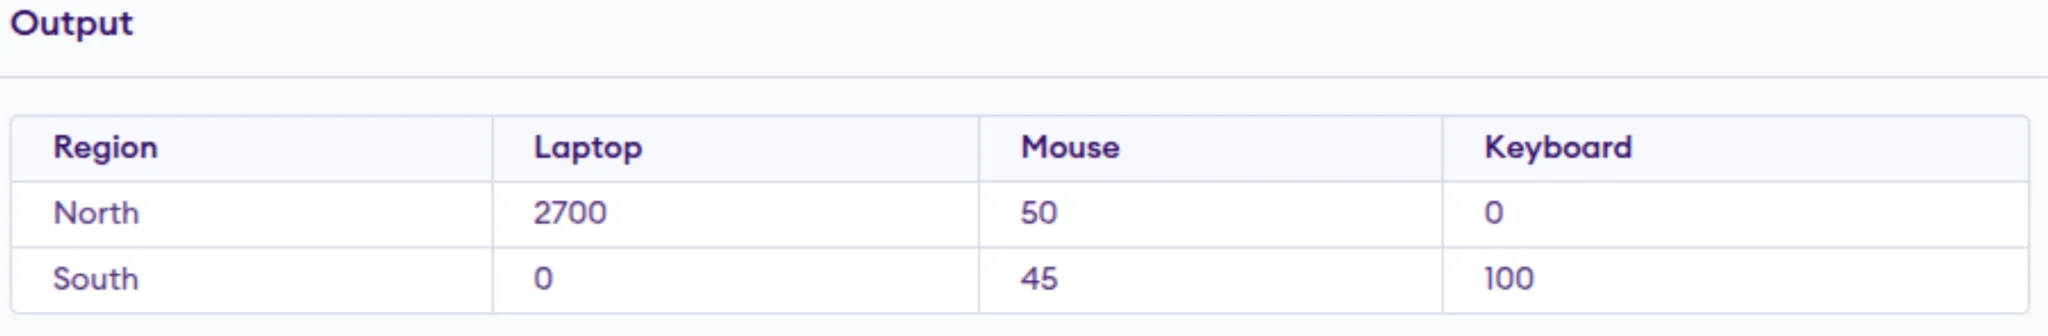
) AS PivotTable;Step 3: Examine the Results
The outcome of the query is:

The North total for Laptop is 2700 because it calculates the sum of 1200 plus 1500. NULL values represent that there is no matching data.
Step 4: Replacing NULLs
To turn NULL to 0, use ISNULL or COALESCE:
SELECT Region,
ISNULL([Laptop], 0) AS Laptop,
ISNULL([Mouse], 0) AS Mouse,
ISNULL([Keyboard], 0) AS Keyboard
FROM (
SELECT Region, Product, SalesAmount
FROM ProductSales
) AS SourceData
PIVOT (
SUM(SalesAmount)
FOR Product IN ([Laptop], [Mouse], [Keyboard])
) AS PivotTable;
SQL PIVOT Operator: Performance Considerations
The performance of the PIVOT query has a lot to do with the base source subquery performance. Filtering in the subquery will limit the amount of data you have to pivot, and will make it easier on the database. Indexes on included pivot and non-pivot columns can improve performance on larger datasets.
A wider pivoted output means the pivot column has the most different values. It leads to more memory being used and lower performance. So, think about the size of your pivoted output and consider further summarizing it if necessary.
SQL PIVOT Operator: Limitations
Let’s see some of the limitations of PIVOT tables:
- Requirement for a static column list:
You are required to explicitly define all pivoted column values in the IN clause for the first run of your pivot query. If your data contains new values later, new pivot output values will not appear until the query is updated manually. - Single aggregate function allowed for each pivot:
The PIVOT query operator allows only one aggregation for each pivot value table. So if you want to calculate multiple aggregation functions (e.g., SUM and COUNT), you must either do them in separate pivots or use conditional aggregation. - Poor portability:
PIVOT is specific to SQL Server. As a result, your implementation in different databases will likely require changes. Your queries will not run in other databases without these changes. - Performance hit for wide pivots:
When you pivot columns with a lot of unique values, memory problems are possible, leading to reduced/capped performance. - Complex dynamic pivots:
Dynamic pivoting requires building the PIVOT column values dynamically as part of a dynamic SQL string. Once you build, you can execute it using sp_executesql. Although dynamic pivoting is appealing because it enables more flexibility in creating pivot values, it adds complexity and risk when needing to build dynamic SQL. You should always use parameterized queries when building dynamic SQL to avoid SQL injection.
Dynamic Pivoting
When situations arise and you do not know the values of your pivot columns beforehand, dynamic SQL can be used. Dynamic SQL is useful because you can query the distinct values of your pivot columns, build the distinct values into a string to build your PIVOT query, and run it using sp_executesql.
Dynamic pivoting, while providing flexibility, adds complexity and risk. It is very important that when building any dynamic SQL queries, you use parameterized queries to safeguard against SQL injection.
Alternative: Conditional Aggregation
One of the more popular alternatives to PIVOT is conditional aggregation with CASE expressions. This method is runnable in all SQL dialects and allows for multiple aggregate functions with ease.
Below is the same example above using conditional aggregation:
SELECT
Region,
SUM(CASE WHEN Product = 'Laptop' THEN SalesAmount ELSE 0 END) AS Laptop,
SUM(CASE WHEN Product = 'Mouse' THEN SalesAmount ELSE 0 END) AS Mouse,
SUM(CASE WHEN Product = 'Keyboard' THEN SalesAmount ELSE 0 END) AS Keyboard
FROM ProductSales
GROUP BY Region;
This produces the same result as the PIVOT example, but has more verbosity. The benefit is portability and easier enforcement of dynamic column situations.
PIVOT vs. CASE Aggregation
PIVOT is a little cleaner for simple cross-tabulation, but is less flexible when you want more than one aggregate, or dynamic columns. CASE-based aggregation is much more verbose, but is runnable on many different database platforms, and adapts more easily to ever-changing data.
Conclusion
The SQL Server PIVOT operator is a powerful tool for summarizing and reshaping data. And it excels when the list of pivoted values is fixed and clean, and concise syntax is preferred over verbose alternatives. However, it is static in nature, and a single aggregate limitation means it is not always the best choice.
By mastering both PIVOT and CASE-based aggregation, you can choose the right approach for each reporting scenario. Whether you are using it for building monthly sales reports, analyzing survey results, or tracking inventory levels, these techniques will allow you to perform transformations directly within SQL, reducing the need for external processing and producing results that are both accurate and easy to interpret.
Frequently Asked Questions
What is the SQL PIVOT operator?
It takes one column’s unique values and converts them into multiple columns in the result set, using an aggregate function on another column. It is used for summary reports or cross-tab style reports within SQL Server.
Can I use multiple aggregate functions in one PIVOT?
No. SQL Server only supports one aggregate with the PIVOT operator. If you require multiple aggregates (SUM and COUNT), you will need to either do two pivots and join them on a common column or use CASE expressions with a GROUP BY clause.
Why do I get a syntax error when I try to run my PIVOT query?
A syntax error is usually due to one of three reasons:
You are running it on a database that isn’t SQL Server (MySQL, PostgreSQL, or SQLite won’t understand).
You forgot to alias the sub-query or the final pivot result.
You left your IN list blank or formatted incorrectly.
Do I have to hard-code the column names in the IN list?
Yes, you always need to provide a static IN list in a PIVOT query. If your data changes and your pivot column has new values, you will have to manually update the list or create the query dynamically.
How do I change NULL values in the result to something else?
You can wrap the pivoted columns in ISNULL() or COALESCE().
Example:
ISNULL([ColumnName], 0) — replaces NULL with 0
COALESCE([ColumnName], ‘N/A’) — replaces NULL with text
Will this work in MySQL or PostgreSQL?
Not with this syntax. PIVOT is a SQL Server-only feature. In other databases, you will need to use CASE expressions and GROUP BY to achieve the same result.
Is PIVOT better than using CASE expressions?
The PIVOT is easier to read for straightforward summaries, but it’s not necessarily faster. CASE expressions work everywhere, which is an advantage when you need more than one aggregate.
Hi, I am Janvi, a passionate data science enthusiast currently working at Analytics Vidhya. My journey into the world of data began with a deep curiosity about how we can extract meaningful insights from complex datasets.


