-
Examining the Simple Linear Regression method for forecasting stock prices using Excel
Linear Regression is one of the simplest ways to make predictions. In this article, we are forecasting stock prices of Infosys in Excel.
Allwyn 26 Oct, 2021
-
35 Classic Excel Hacks, Tips and Tricks for Analytics Professionals on Excel’s 35th Birthday!
MS Excel has been at the forefront for analytics and data science for 35 years. Lets celebrate this with excel hacks and 35 excel tips
Ram Dewani 02 Dec, 2020
-
10 Most Commonly Used Statistical Functions in Excel (Updated 2026)
Step-by-step tutorials to learn Statistical functions in Excel. Master formulas and functions to quickly analyze data in Excel like a pro!
Ram Dewani 07 Jan, 2026
-
Time Series in Excel! Learn Exponential Smoothing Models for Time Series Forecasting in Excel
The exponential smoothing algorithms are popularly used for forecasting univariate time series. We will see how to use them in MS Excel.
Aishwarya Singh 23 Sep, 2020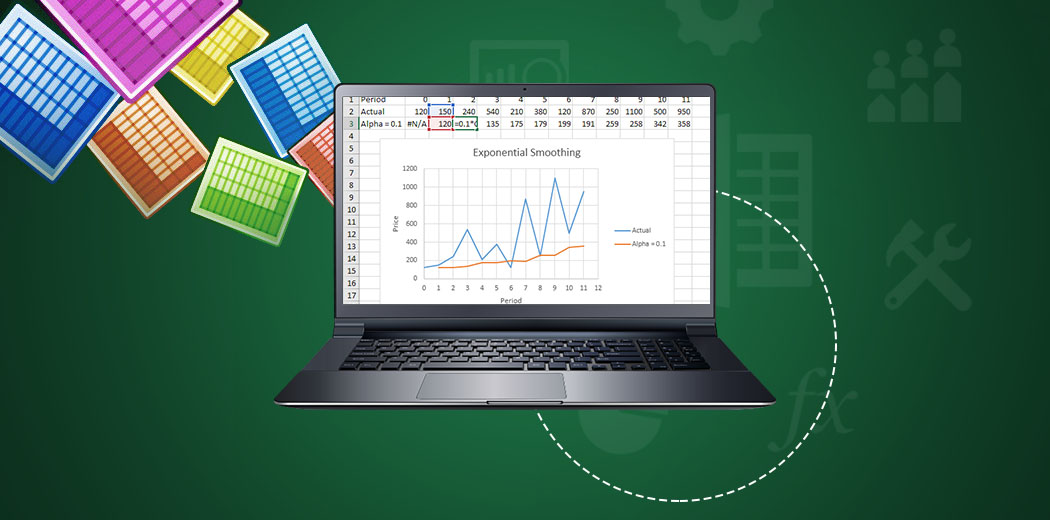
-
How to Build a Sales Forecast using Microsoft Excel in Just 10 Minutes!
Forecasting in Excel is a remarkably easy operation but you need to know how to perform it. Learn forecasting in Excel here.
Ram Dewani 23 Dec, 2020
-
How to Use Python to Automate Google Sheets? (2026 Edition)
Learn how to use Python to automate Google Sheets with our updated blog. Save time and effort by automating your Google Sheets with Python.
Lakshay arora 06 Jan, 2026
-
3 Ambitious Excel Charts to Boost your Analytics and Visualization Portfolio
Excel charts enable analysts to create powerful and ambitious visualizations. Here are 3 Excel charts: Waterfall, Funnel and Pareto for analytics domain.
Ram Dewani 26 Aug, 2021
-
Predictive Modeling in Excel – How to Create a Linear Regression Model from Scratch
Learn how to perform predictive modeling in Excel by creating a linear regression model. Follow our guide to analyze and improve your results.
Ram Dewani 11 Nov, 2024
-
3 Advanced Excel Charts Every Analytics Professional Should Try
Advanced excel charts tutorials explains 3 advanced excel charts sparklines, gantt charts and thermometer charts that every analytics professional should try
Ram Dewani 26 Aug, 2021
-
5 Powerful Excel Dashboards for Analytics Professionals
Learn to represent crucial data using Excel for quick consensus and strategic decision-making. Explore five powerful Excel dashboards here.
Ram Dewani 31 Jan, 2025
