Elevate Your Python Apps with NiceGUI, the Ultimate GUI Framework
Introduction
With the rapid growth in Machine Learning and Deep Learning website applications, developers are on the constant look for new Web Frameworks that make building these website applications much easier. The popularity of Data science applications has gone up, thus a rise in new Frameworks. Developers create numerous new frameworks that prove helpful in constructing these website applications. And one such Framework is NiceGUI. In this article we will be focusing on this Framework and how to build simple applications with it.
Learning Objectives
- To understand NiceGUI
- Learn to write Basic Elements with NiceGUI
- Understand the working of Value Bindings
- Working with NiceGUI to display data in UI
- To build applications with NiceGUI
This article was published as a part of the Data Science Blogathon.
Table of contents
What is NiceGUI?
NiceGUI is a simple-to-use Python-based Web-UI Framework, with the purpose of making developing Frontend applications easy in Python. NiceGUI Framework’s UI elements are based on Vue and Quasar. Nice GUI comes with many ready-to-use elements. It even allows value binding between different elements. NiceGUI enables easy display of a wide range of plots. Its developers chose to build it on top of the Fast API Framework for its fast performance and user-friendly interface.
The styling in NiceGUI gets change with CSS, Tailwind, and Quasar. By default, it allows customizable styling. Use NiceGUI to build from short scripts to dashboards to full robotics projects and even Machine Learning website applications.
Some of the features include:
- Preloaded with ready-to-use GUI elements like buttons, labels, checkboxes, sliders, switches, etc
- Emoji favicon, SVG and base64 support
- Provides easy data binding
- Built-in Timer for refreshing the data
- Able to render 3D scenes, plot graphs
- Can easily display Images and Videos
- It makes it easy to customize the pages and layouts and has built-in support for Tailwind CSS
Installing NiceGUI
Download NiceGUI like other normal Python packages with pip. The following Python’s pip command will NiceGUI and even installs the dependencies it relies on.
pip install niceguiNote that the NiceGUI even provides a Docker Image to test its features without downloading it to the machine. Let’s look at some example code:
from nicegui import ui


ui.label('Welcome to NiceGUI!')
ui.button('Click Here', on_click=lambda: ui.notify('Button Pressed'))


ui.run()
To work with NiceGUI, we need to import the library nicegui. We will use three functions from nicegui here
- label(): Use this function to display text on the UI
- button(): This function is for creating a clickable button for the UI.
- notify(): A popup at the bottom will display whatever is written in this function.
Let’s run the code and see the output below
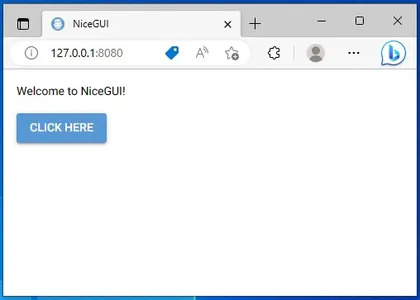
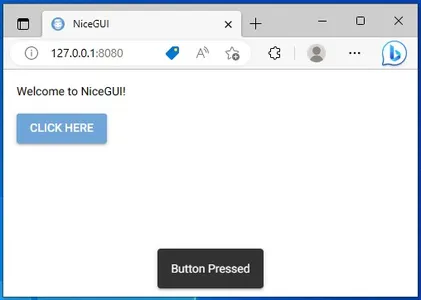
The application can be accessed from PORT 8080. We see that a button Click Here is present here. Upon clicking that button, a popup displayed telling that the Button Pressed
Basic Elements of NiceGUI
In this section, we will look into some of the basic elements which we will create with the NiceGUI framework.
Icons and Links
Let’s start with displaying Icons and Linking websites to texts in the UI
from nicegui import ui


ui.label('Display Icon')
ui.icon('fingerprint', color='primary').classes('text-5xl')
ui.link('NiceGUI on GitHub', 'https://github.com/zauberzeug/nicegui')


ui.run()
Functions
Create the following functions from the above code:
- The function “icon()” allows us to display Icons on the UI. To display an Icon, we need to provide an Icon name. This function relies on Quasar’s QIcon. The color option can be specified using CSS, Quasar, or Tailwind color. The size option is determined by the classes() method, using CSS units.
- The function “link()” enables us to assign links to text in the UI. First, we specify the text that should be linked, followed by the corresponding website URL.
Running the code will result in the below output
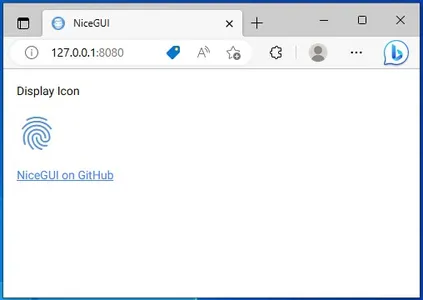
We see that the fingerprint icon is displayed on the screen. Also clicking on the “NiceGUI on GitHub”, will redirect us to NiceGUI’s GitHub Page.
Selection Elements
NiceGUI has different selection elements like Toggle Boxes, Radio Selections, and Check Boxes. The below code contains all these elements imported from NiceGUI.
from nicegui import ui


ui.label('Toggle Box')
toggle = ui.toggle([1, 2, 3], value=1)


ui.label('Radio Selection')
radio = ui.radio(["one","two","three"], value=1).props('inline')


ui.label('Dropdown Select')
select = ui.select(["red","blue","green"], value=1)


ui.label('Check Box')
checkbox = ui.checkbox('check me')


ui.run()
The functions in the above code include:
- toggle(): This function can generate a toggle box, where we pass the options through a list of values of dictionaries containing a mapping of values to labels. When the user selects an option, it is saved in the toggle variable.
- radio(): This works like the toggle() function but here we get radio options to select
- select(): This function generates a dropdown to select a specific option. The input to this function and the output value stored is the same when compared to the above functions
- checkbox(): When the user checks the checkbox, the checkbox variable is assigned a boolean True value.
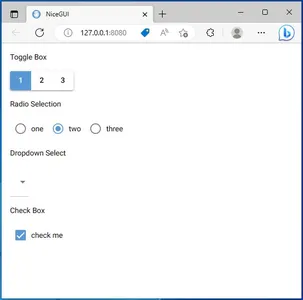
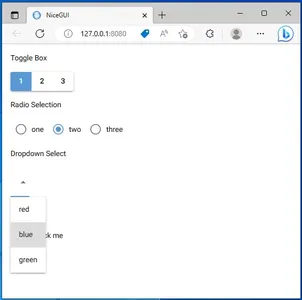
Here we see all the selection elements that we have created. Click on the Dropdown Selection, a dropdown action takes place allowing us to select one of the options. These are just some of the elements that we have looked into. NiceGUI offers a wide range of elements to work with in various scenarios.
User Inputs and Value Bindings
In this section, we will look at the functions that will allow users to enter text or numerical data in the UI.
from nicegui import ui


ui.input(label='Text',
         on_change=lambda e: text_input.set_text('Your Input: ' + e.value))
text_input = ui.label()


ui.number(label='Number', value=3.1415, format='%.2f',
          on_change=lambda e: number_input.set_text('Your Input: ' + str(e.value)))
number_input = ui.label()


ui.run()
Functions
The functions in the above code include:
- input(): This function when used, will create an empty text box where the user can type the data. It has a variable called “label“, which tells what type of input it’s expecting from the user. Whenever the user enters an input in the Input box, the .set_text() function of ui.label() activates and displays the typed text on the screen.
- number(): This function works similarly to the input() function, the only difference is that this function takes numbers instead of text
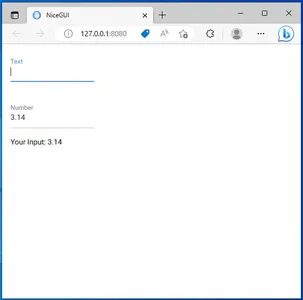
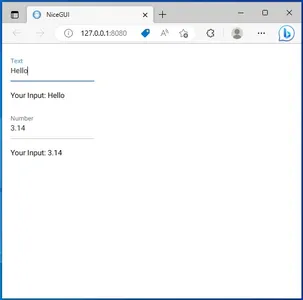
The code when run, will produce the following output
Explore UI Elemts in NiceGUI
In the images above, the user’s input is displayed on the screen when entered into the input field. NiceGUI enables binding values between different UI elements, allowing seamless integration. Let’s explore an example.
from nicegui import ui


ui.label("Value Bindings")


with ui.row():
    radio1 = ui.radio([1, 2, 3], value=1).props('inline')
    toggle = ui.toggle({1: 'A', 2: 'B', 3: 'C'}).props('inline').bind_value(radio1, 'value')


ui.run()
In the code above, we have two elements (radio and toggle) grouped horizontally using the ui.row() element. To group them vertically, we can use ui.column(). The toggle() function includes the variable bind_values(), which connects the radio options to the toggle options. For example, selecting 1 in the radio switches the toggle to A, and selecting 2 switches it to B.
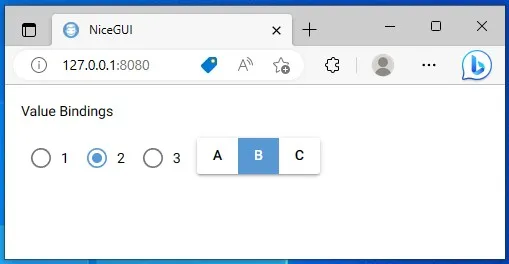
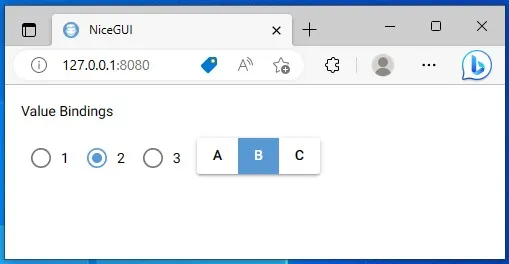
In the above Images, we can clearly look at the value bindings between the two UI elements in action. Similarly, bind_value() function is capable of working in different UI elements provided by the NiceGUI.
Data Elements and Graphs
In this section, we will see the Data Elements provided by the NiceGUI. We will explore how to display tables and charts on the UI using NiceGUI. Firstly, we will start with displaying tabular data through NiceGUI. The code for displaying this will be:
from nicegui import ui


columns = [
    {'name': 'Name', 'label': 'Name', 'field': 'Name', 'required': True, 'align': 'center'},
    {'name': 'Employee-ID', 'label': 'Employee-ID', 'field': 'Employee-ID'},
    {'name': 'experience', 'label': 'experience', 'field': 'experience'}
    ]
rows = [
    {'Name': 'Akash', 'Employee-ID':1230, 'experience': 5},
    {'Name': 'Karen', 'Employee-ID': 1245, 'experience': 10},
    {'Name': 'Thanish', 'Employee-ID': 1980, 'experience': 9},
    {'Name': 'Samuel', 'Employee-ID': 1120, 'experience': 8},
    ]


ui.table(title='Employee Data',columns=columns, rows=rows, row_key='Name')


ui.run()
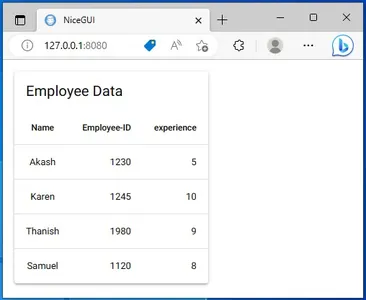
To display a table, specify the column names in the columns list. Each column is represented by a dictionary within the list. Include the name, label, and field values for each column (typically the same for all). Additional key-value pairs can be provided as needed. For example, the “required:True” key-value pair ensures that the Name column requires a value for any new element added to the table. The “align”:”center” aligns the entire row under that column name in the center alignment.
The next is the rows list. The rows list is the list of dictionaries containing values for the above columns. Here using the field names, we provide the field:value pairs in the dictionary. Then with the ui.table() function, we display the table to the UI. Here we can give the title name for the table. The row_key has the column name that contains unique values. Running this code will give the following output
Pandas DataFrame with NiceGUI
We can even display the Pandas Dataframe with NiceGUI. With the table() function itself it is possible to display the Pandas Data.
import pandas as pd
from nicegui import ui


data = pd.DataFrame(data={'Name': ["Karan", "Shoaib"], 'Role': ["Developer", "Designer"]})
ui.table(
    columns=[{'name': column, 'label': column, 'field': column} for column in data.columns],
    rows=data.to_dict('records'),
)


ui.run()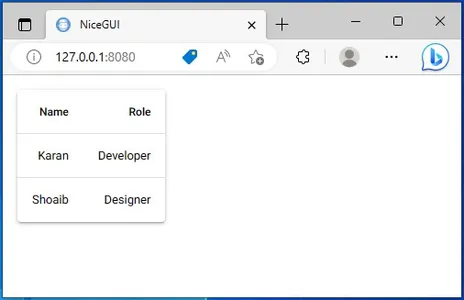
Now we will look at how to display graphs on the screen using NiceGUI. With NiceGUI functions, we can display plots made through matplotlib on the screen. For this, we work with the pyplot() function in the NiceGUI, which displays matplotlib graphs on the UI. The code for this will be:
import matplotlib
import numpy
from nicegui import ui


with ui.pyplot(figsize=(3, 2)):
    x = numpy.linspace(0.0, 10000.0, 10)
    y = numpy.log(x)
    matplotlib.pyplot.title('Log Graph')
    matplotlib.pyplot.plot(x, y, '-')


ui.run()
Here we use the with command followed by the ui.pyplot() function. We even pass the fig size to the function. Now under the with, we write the code for plotting a graph through matplotlib. Here we have written a simple graph, where the x-axis contains the values from 0 to 10000 with a stepsize of 10 and the y-axis contains the log values for them. The output when the code run will be:
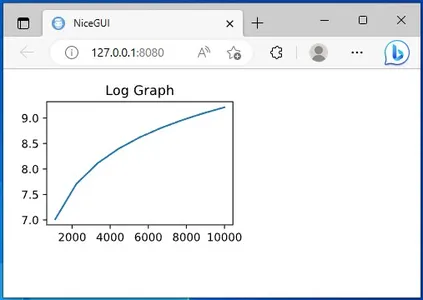
You can see the plot on the above screen. With NiceGUI, we not only can display matplotlib graphs, but we even can display graphs made through Plotly too, which creates interactive graphs.
UseCases and Applications
NiceGUI similar to other Web Frameworks, can be helpful during different development scenarios, like:
- Machine Learning UI: With its multitude of elements, NiceGUI emerges as one of the best libraries for creating Frontend parts for Machine Learning Applications. The different selection elements provided by NiceGUI will really come in handy when dealing with ML applications that need many inputs from users
- Rapid Prototyping: Not writing HTML, CSS, or Javascript files and being able to code everything from displaying text to selection boxes to graphs entirely in NiceGUI, reduces the large amount of effort for developing quick prototypes. And the amount of elements provided by NiceGUI helps in creating full-fledged working prototypes.
- Dashboard Applications: NiceGUI allows developers to display different charts easily through its chart elements. One good thing to note is that NiceGUI can even show 3D Scenes. It even comes with progress bars to showcase the loading of the data. It has different data elements to display different types of Python data types on the screen.
Conclusion
Developers use NiceGUI, a Python Web Framework, to create website applications. NiceGUI provides the necessary tools to develop a full-fledged website with all the frontend parts completely in Python. We have even seen different elements of NiceGUI and how to take user inputs. Finally, we have gone through bind values to learn we can bind between different UI elements
Some key takeaways from this article include:
- NiceGUI comes with different ready-to-use UI elements.
- It provides users to create multi-page websites.
- NiceGUI comes with data binding built into it.
- Based on FastAPI to serve the content to the web.
The media shown in this article is not owned by Analytics Vidhya and is used at the Author’s discretion.
Frequently Asked Questions
A. NiceGUI is a Python-based Web-UI Framework that simplifies front-end application development. It offers a wide range of ready-to-use UI elements and supports value binding between different elements. NiceGUI is built on top of the FastAPI Framework for fast performance and a user-friendly interface.
A. Yes, NiceGUI can be easily installed like any other Python package using pip. Simply run the command “pip install nicegui” to install NiceGUI and its dependencies.
A. With NiceGUI, you can build various types of applications, including machine learning UIs, rapid prototypes, and dashboard applications. It provides user input, data display, and graph visualization elements, making it versatile for different development scenarios.
A. Yes, NiceGUI allows you to display tabular data using the table element. It supports the customization of column names, formatting, and data binding.
A. NiceGUI is beginner-friendly and offers a simplified approach to front-end development in Python. Its intuitive functions and extensive documentation make it accessible to users with varying experience levels.


